
MAP EXPORT OPTIONS
The quickest way to export any map produced in QGIS is in Project -> Import/Export. There are 3 options for exporting the map. Excluding the last one, which is exported to the format .dxf and making it used in the CAD environment, the user can make it in a visual way by producing the raster file. There are 2 ways of exporting the QGIS map to raster though – by using “Export map to image” and “Export map to PDF”.
The first option – export map to image saves our image in the .webp file including an auxiliary file with .pgw extension. It means, that we are receiving a georeferenced .webp file. It’s in this case when we want to load the .png file directly to our QGIS map in another project. By having the geometry detail in the .webp file, the quick location of the .png raster image in our map is possible. Otherwise, you would have to georeferenced this image manually, which obviously takes time. It’s good to know about it then. The .png format is also georeferenced, so it can be plotted on random QGIS projects easily at previously defined locations. The export options for .pdf and .webp files are quite similar. Regarding the georeferenced file, we don’t need to even think about it, as the “Append georeferenced information” option is set as default (Pic. 1). That’s why the auxiliary .pgw file is created. If you need just a pure .png image for print, you can switch this option off and the .pgw file won’t be generated. Other important settings, within the “Export map as image” option are highlighted in the image below (Pic. 1), though I guess the most important is the extent of the image we want to generate. The default setting provides the visible bounds of our current map view expressed with the coordinates of the CRS defined in our QGIS project properties. The choice of our extent is quite wide because we can stick to the particular layer used in our project or even draw our custom range on the map (Pic. 1).
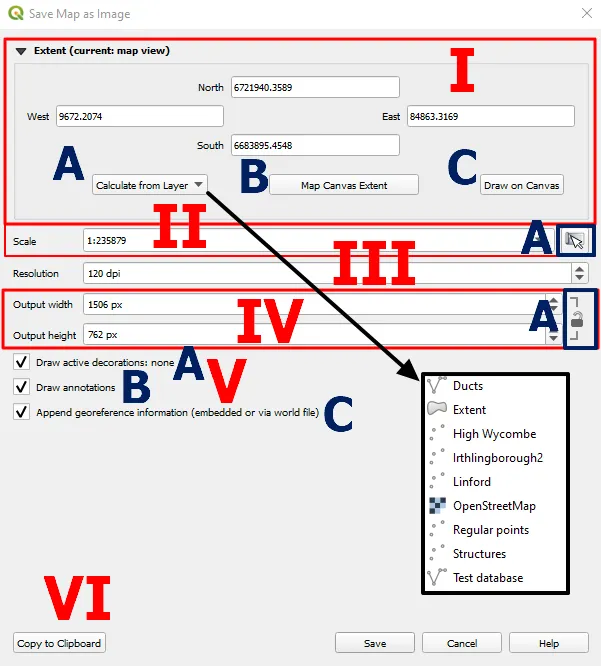
The “Save map as Image” options are listed and explained below:
I – Extent (current map view) – refers to the actual visual range of the map as seen in the major QGIS interface bounded by various toolbars, panels, and sidebars at the bottom. They come in 4 cardinal directions marking the most extreme range of our map in the coordinates adequate to the applied CRS system. They are subject to change when other options listed below are changed (Map scale, Output width & height).
The map extent can be changed by using the following options below:
A – Calculate from layer – the aforementioned 4 points will be determined by the range of the given layer expressed analogically as the box.
B – Map canvas extent – current map canvas extent as discussed above.
C – Draw on canvas – we can manually define the range for export, although it always comes in the box!
II – Scale – another important element. By default, it’s adjusted to the current map scale used in QGIS. It’s still possible to change it by selecting some random scale from the dropdown.
A – the map & cursor icon – restores the current map scale if not applied before.
III – Resolution – as default comes usually with 120 Dpi. If you wish to change it, please refer to this article, where the process has been explained. You can, in fact, always change it manually. The resolution doesn’t have an impact on the map scale but shapes the Output width & height parameters. Admittedly, changes in the resolutions trigger changes in the map tile level of detail. All the vector & raster layers provided into QGIS are enlarged digitally.
IV Output width & height – the final output of image size in pixels. It can be still changed proportionally or not (the padlock icon on the right – A). It changes as the resolution value is modified.
V Other options – they come available in default, but you can always switch them off.
A – Draw active decorations: none – when we have no decorations provided, the text after the colon will be always “none”. When some of them are applied, then the option will look as below:
Draw active decorations: grid, title label
with decorations are listed alphabetically.
B – Draw annotations – if there are any, this option will keep them for our export file.
C – Append georeferenced information (embedded or via world file) – when turned on, an auxiliary .pgw file will be created as discussed earlier.
VI – Copy to clipboard – instead of saving our .webp file on the drive we can keep it in the clipboard and paste it somewhere directly.
MAP DECORATIONS
Decorations in other words mean the map components, which are usually inherent in the typical map canvas like legend, scale, north arrow, or grids. Decorations available in QGIS are:
I Grid – based on the current CRS coordinates with other options listed below (Pic. 2).
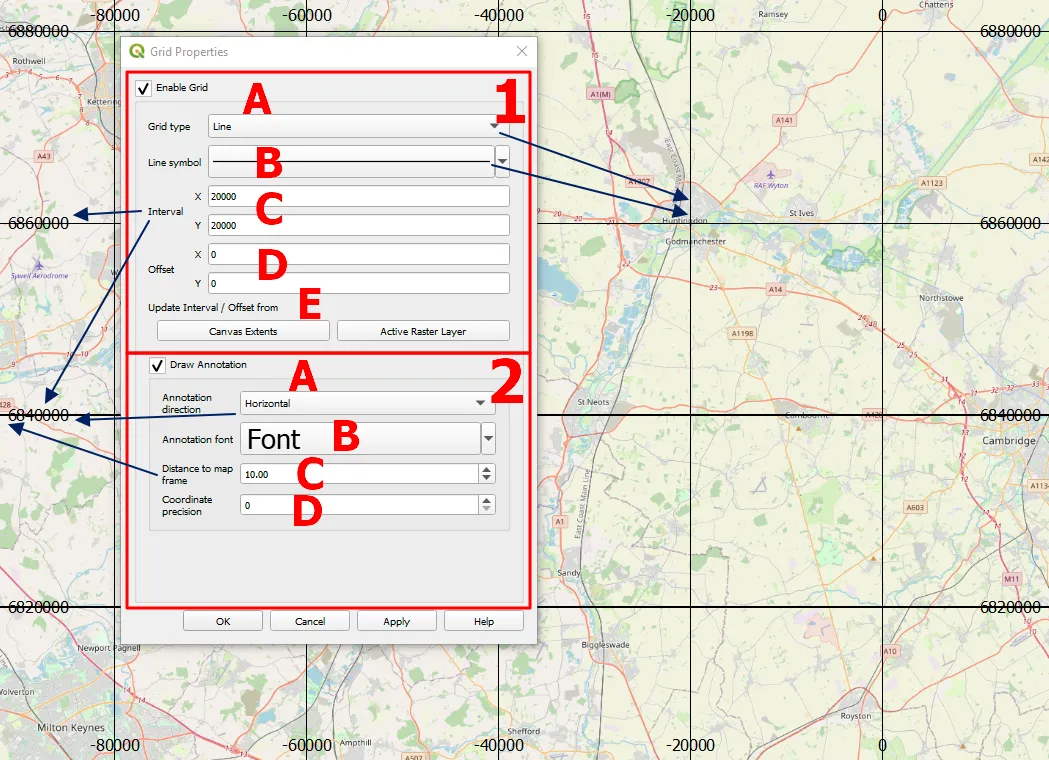
The Grid decoration options are split into 2 sections, where the first one refers to the grid itself and the second one to text annotation.
1 – Enable Grid – makes all grid options available.
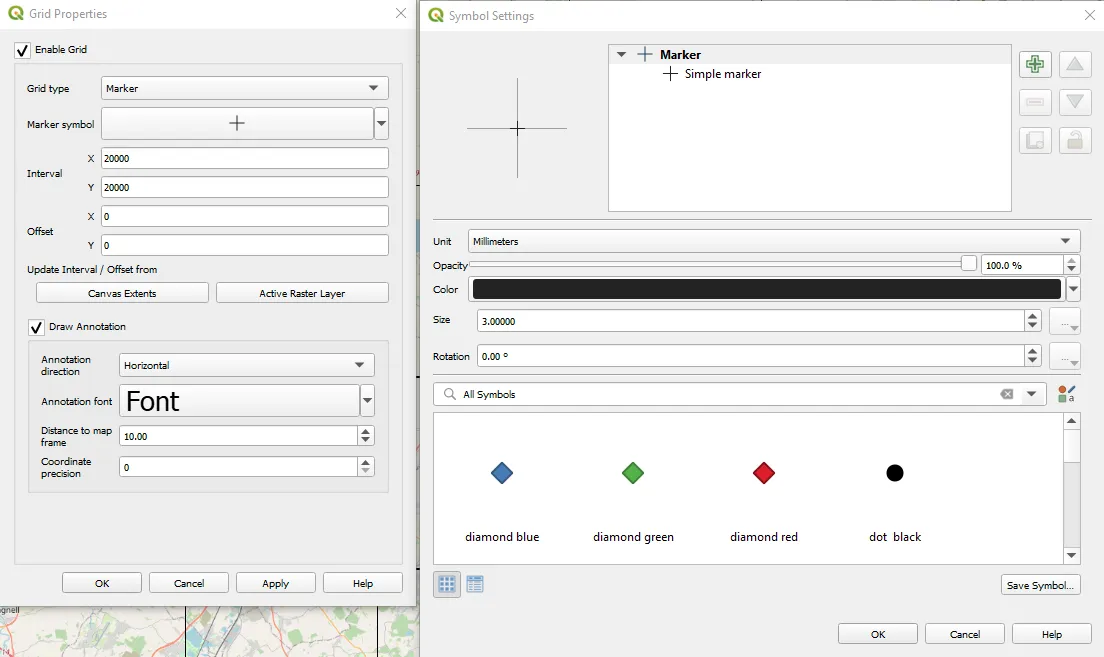
A – Grid Type – usually line in use, but we can toggle the marker if we want (Pic. 3). The customizing options are the same as we style the casual point layer in QGIS. The same applies to line (B).
C – Interval – an important option for setting the density of our grids. Usually, it comes with some default value, typical for the CRS used for our project as well as the map scale we use. We can always change it.
D – Offset – makes the grid lines shifted by the value provided. Along with the offset, the text value changes accordingly.
E – Update interval / Offset from – determines where our grid begins. Is it canvas extent or maybe some raster layer used in our project? If you don’t have a raster layer in your QGIS project, this option won’t be available.
2 – Draw annotation – enables the text to show the grid value.
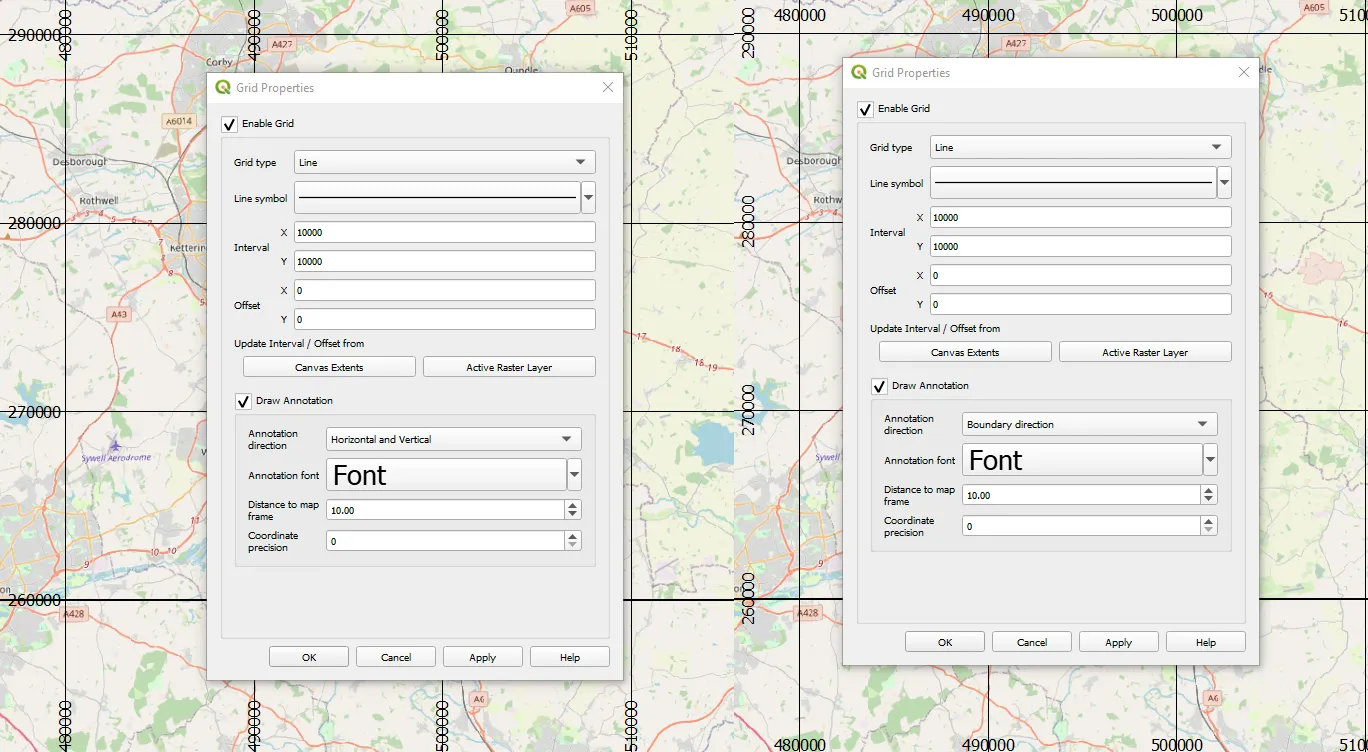
A – Annotation direction – we can choose Horizontal, Vertical, Horizontal & Vertical, or Boundary direction. The image above (Pic. 2) shows a Horizontal direction. The last two options are shown below (Pic. 4).
B – Annotation font – the space for font size and type customization.
C – Distance to the map frame – determines how far the labels can be located from the map frame (in pixels).
D – Coordinate precision – regulates the number of decimals and using it is rather not advisable for small-scale maps.
II Scale Bar Decoration – it’s quite poor when we want to export our map just as an image. All the options are listed and explained below (Pic. 5).
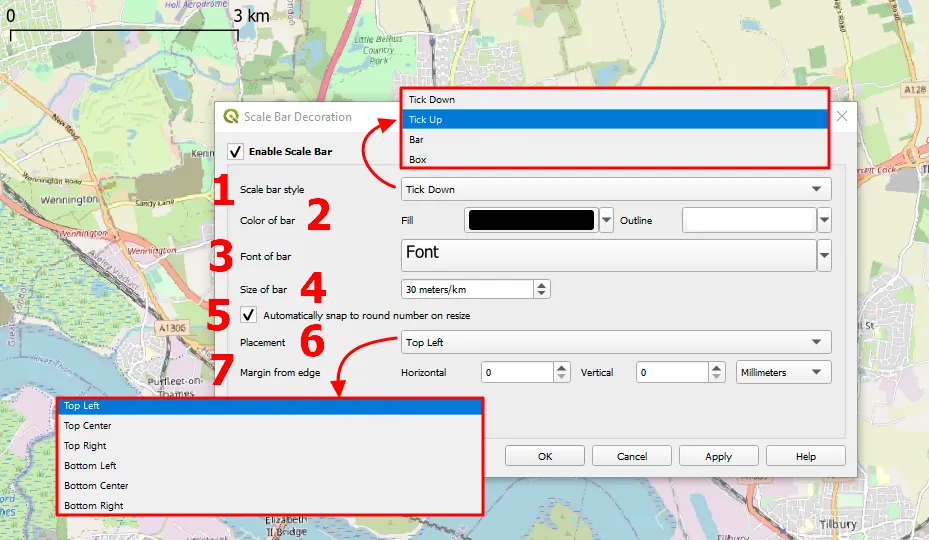
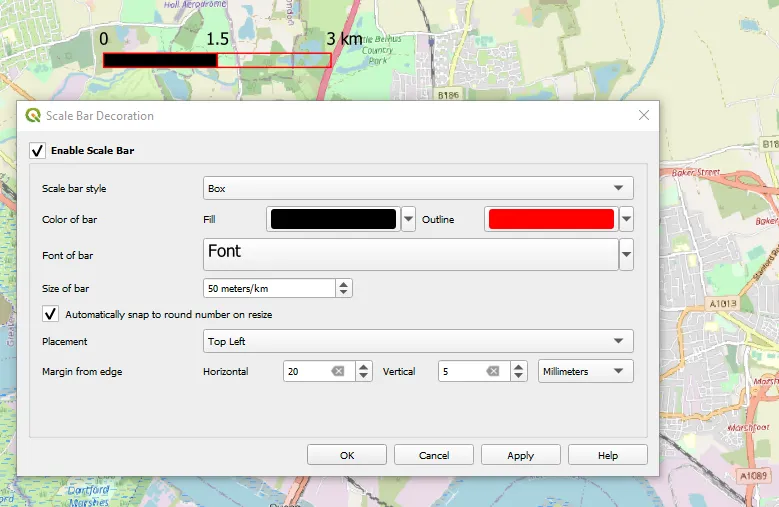
1 – Scale bar style – they are 4, but the most effective one seems to be the Box (Pic. 7).
2 – Color of bar – mostly just Fill is used, the outline comes out when using Bar or Box styles.
3 – Font of bar – the place where a user can customize the font size and type.
4 – Size of bar – determines the distance of which our scalebar will be divided. The upper limit is 99m, and the lower one depends on the scale applied (Pic. 6). In the image below we can clearly see it, the size of a bar smaller than 20 meters/km simply won’t be generated.
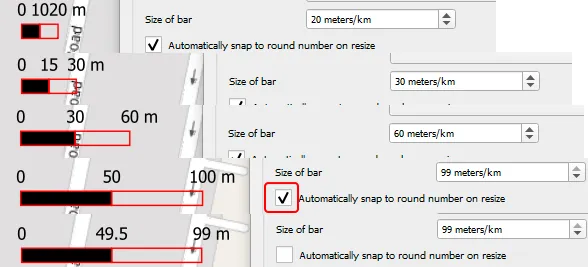
Because the upper limit is just 99m, we have to switch the Automatic snap to the round number or resize option off if we want to have a genuine scale bar like shown above.
6 – Placement – states where exactly we want to have your scalebar displayed.
7 – Margin from the edge – regulates the distance (in pixels) from the map edge both from the top/bottom and left/right.
III Image decoration – refers rather to a logo or watermark, which can be attached to our map image (Pic. 8). You can provide your own to the custom directory and use it.
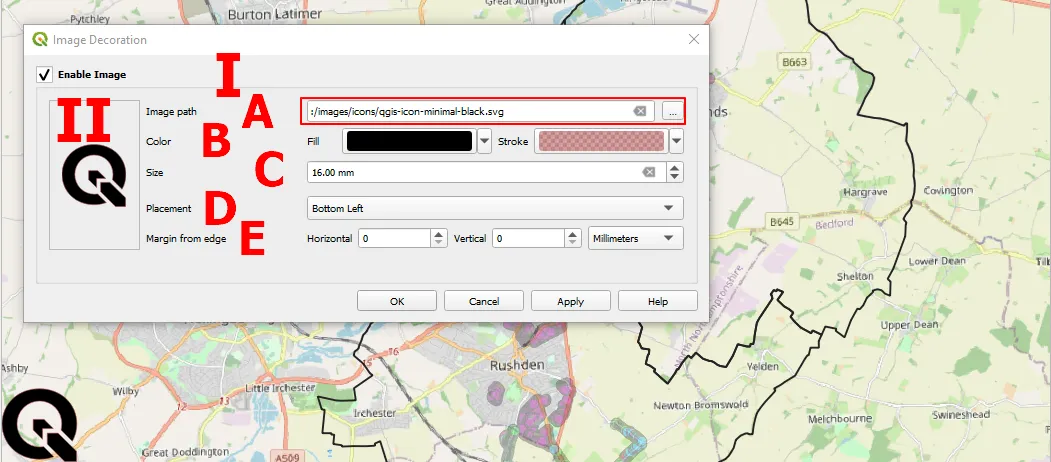
The options here are on the right (I), whereas on the left a user can see the live preview of his image provided or customized (II).
A – Image path – as default, it comes from the basic QGIS logo .svg file. The “three dots” on the right are for searching a user’s own image in the directory.
B – Color – both for Fill and Stroke to be adjusted by the user. It will impact the live preview shortly afterward.
C – Size – changing the dimensions of our image or icon (in millimeters).
D – Placement – top, bottom, or center left or right.
E – Margin from the edge – both Horizontal as well as Vertical to be set in various units.
IV North Arrow Decoration – very useful element the same as the scale bar. Likewise in the case of Image decoration, we can provide our own .svg pattern for the north arrow symbology (Pic. 9). However there is a trick here, which needs to be explained. Namely, the North Arrow keeps showing the north in the same direction even when our map is rotated (Pic. 9).
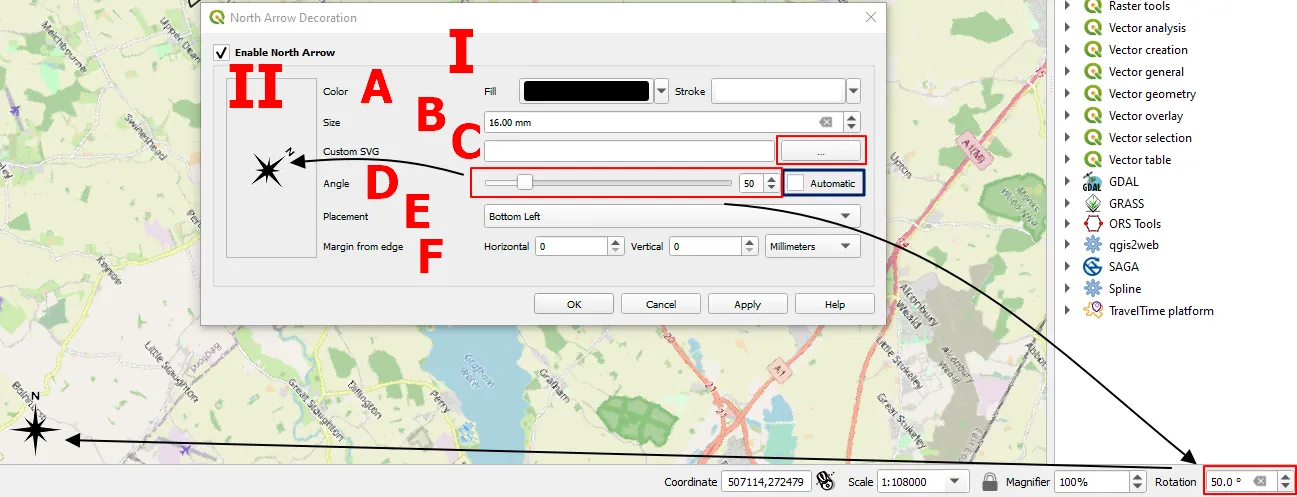
The same as previously, all the options are visible on the right (I) with the live preview on the left (II).
A – Color – the same as above, we can set the shape Fill and Stroke color.
B – Size – defines the dimensions of the north arrow displayed on the map.
C – Custom SVG – the place, where a user can upload its own .svg file representing the north arrow. I truly believe that it can be any .svg file uploaded here.
D – Angle – it’s a very important option due to possible map rotation doable from the status bar at the bottom. Despite a rotation angle other than 0°, the north arrow shape remains in the same position. Therefore using the Angle option is essential for matching the rotation of our north arrow with the rotation of our map set in the status bar. Otherwise, the north direction won’t be genuine anymore!
E – Placement – exactly the same as discussed above.
F – Margin from the edge – also the same as discussed earlier.
V Title Label Decoration – provides the title for our map (Pic. 10).
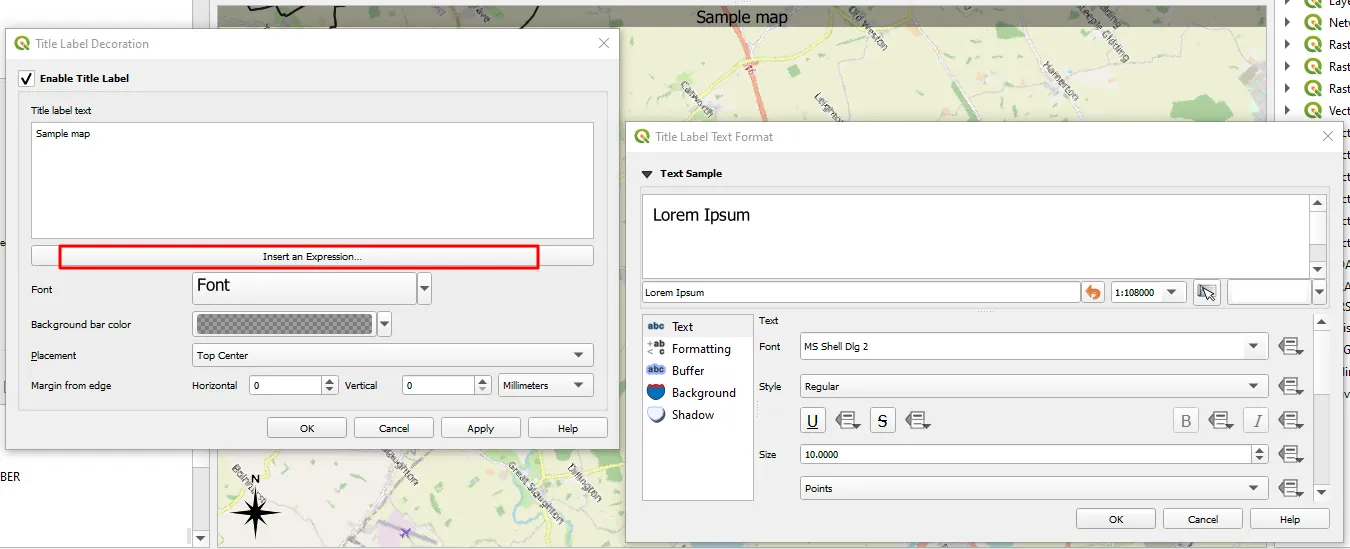
An interesting option is providing the label by using the expression (highlighted in the image above). A user can tie up the map title with some regular value. There’s nothing here apart from the basic font and placement settings. Alternatively, you can set up the Background bar color inside which the label is displayed.
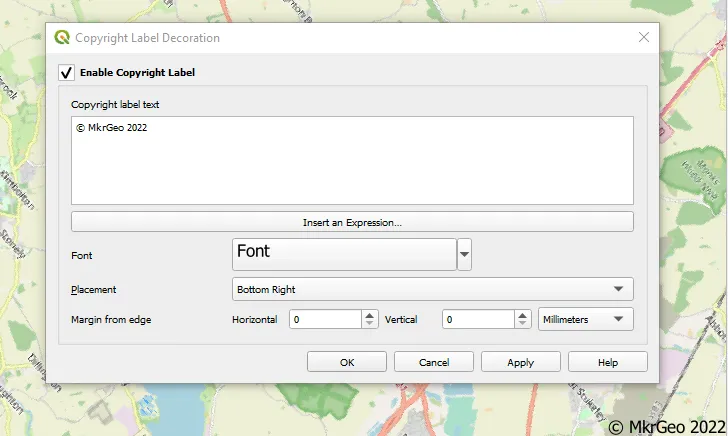
VI Copyright Label Decoration – works pretty much on the same basis as Title Label Decoration, because the customizing options are exactly the same (Pic. 11).
VII Layout extents – a good option for someone, who wants to know the areas of other maps, which are to be printed. This option works only when some print layout is in use. When we have already map opened in the print layout, the layout extent decoration shows the range of the map within the main map canvas (Pic. 12). Moreover, we can apply the text label, which will display the name of the layout and map included.
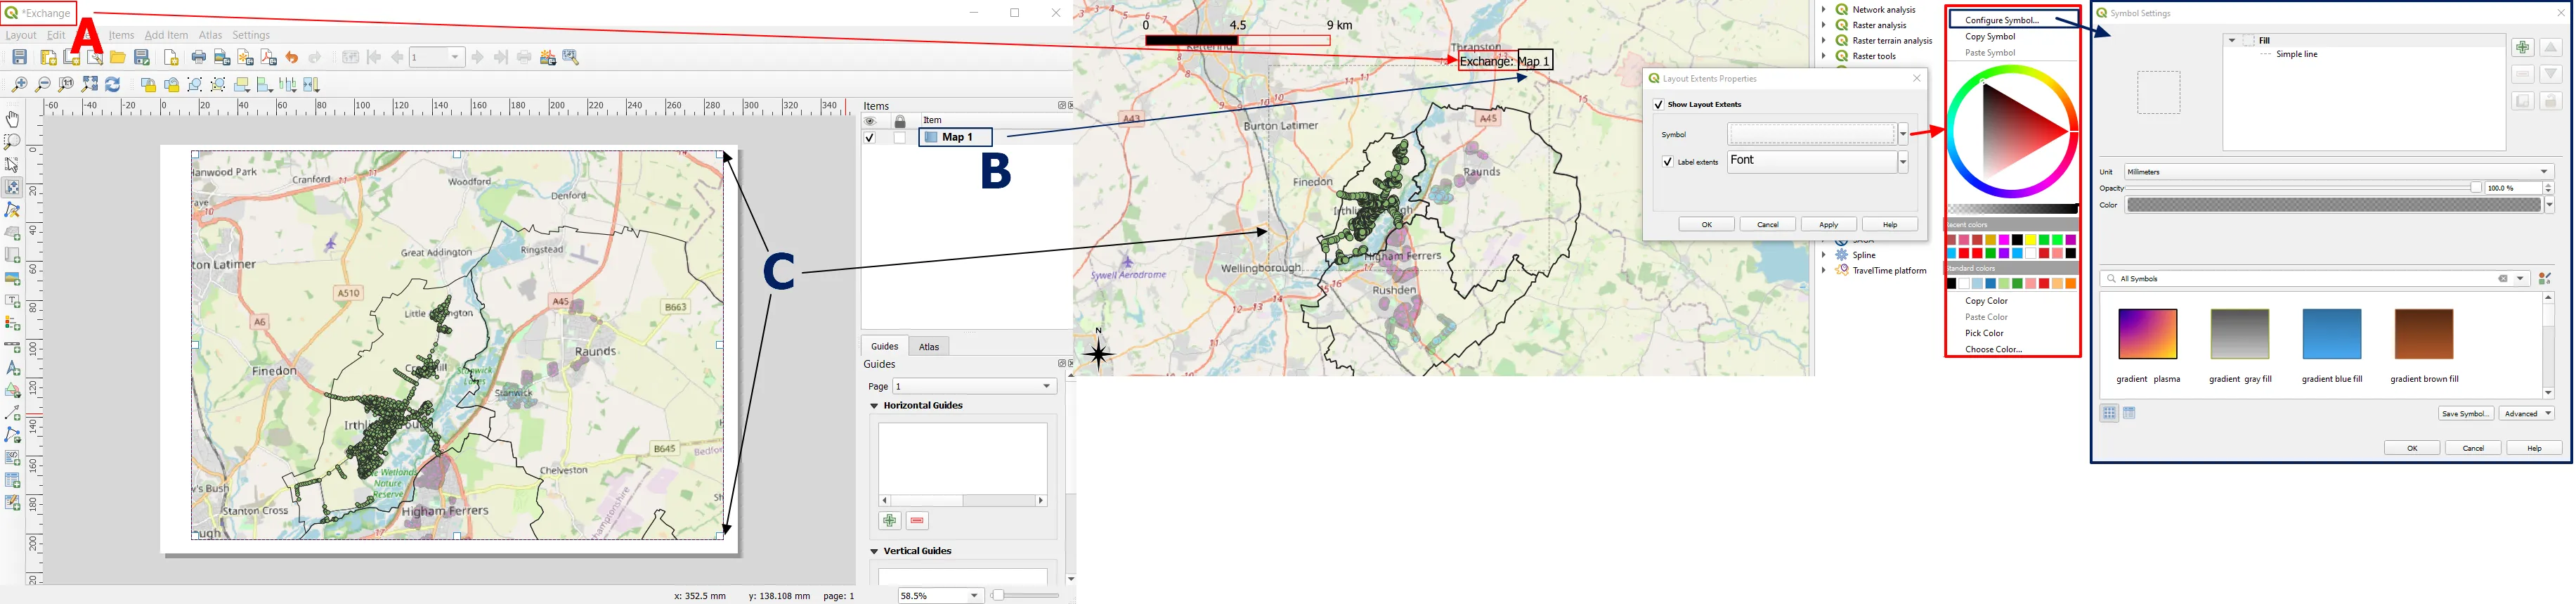
In the Layout Extents decoration, we have 3 crucial elements to explain:
A – The name of our print layout is always presented as the label above the extent box.
B – The name of our map is displayed just next to the name of the print layout, after the colon.
C – The print layout extents usually come as the dotted grey box, but we can always change it by selecting Symbol -> Configure symbol (Pic. 12).
The Layout Extents Properties include also the Label extents options, where a user can configure the font format on the same basis as discussed in earlier examples.
The primary disadvantage of the Layout Extents decoration is the lack of auto-update when moving map content (or changing the map scale) in the print layout. The decoration has to be selected every time separately from View -> Decorations -> Layout Extents if we want to keep it updated.
Forums:
- Github.com: Size of scale bar on canvas: weird behaviour #15647
- https://solveforum.com/forums/threads/solved-qgis-scalebar-shows-does-not-match-scale-shows-wrong-distance.679209/
- https://gis.stackexchange.com/questions/15901/why-does-qgis-scalebar-show-a-wrong-scale
Youtube: