
This writing is a continuation of a whole article about haze as an important weather factor. Previously I have described the basic types of haze and I drew attention to the impact the atmospheric aerosols on human health. Now, in terms of the continuation, I would like to describe the impact of haze on the light scattering in the atmosphere and the visual range.
1. LIGHT SCATTERING IN A HAZY ATMOSPHERE
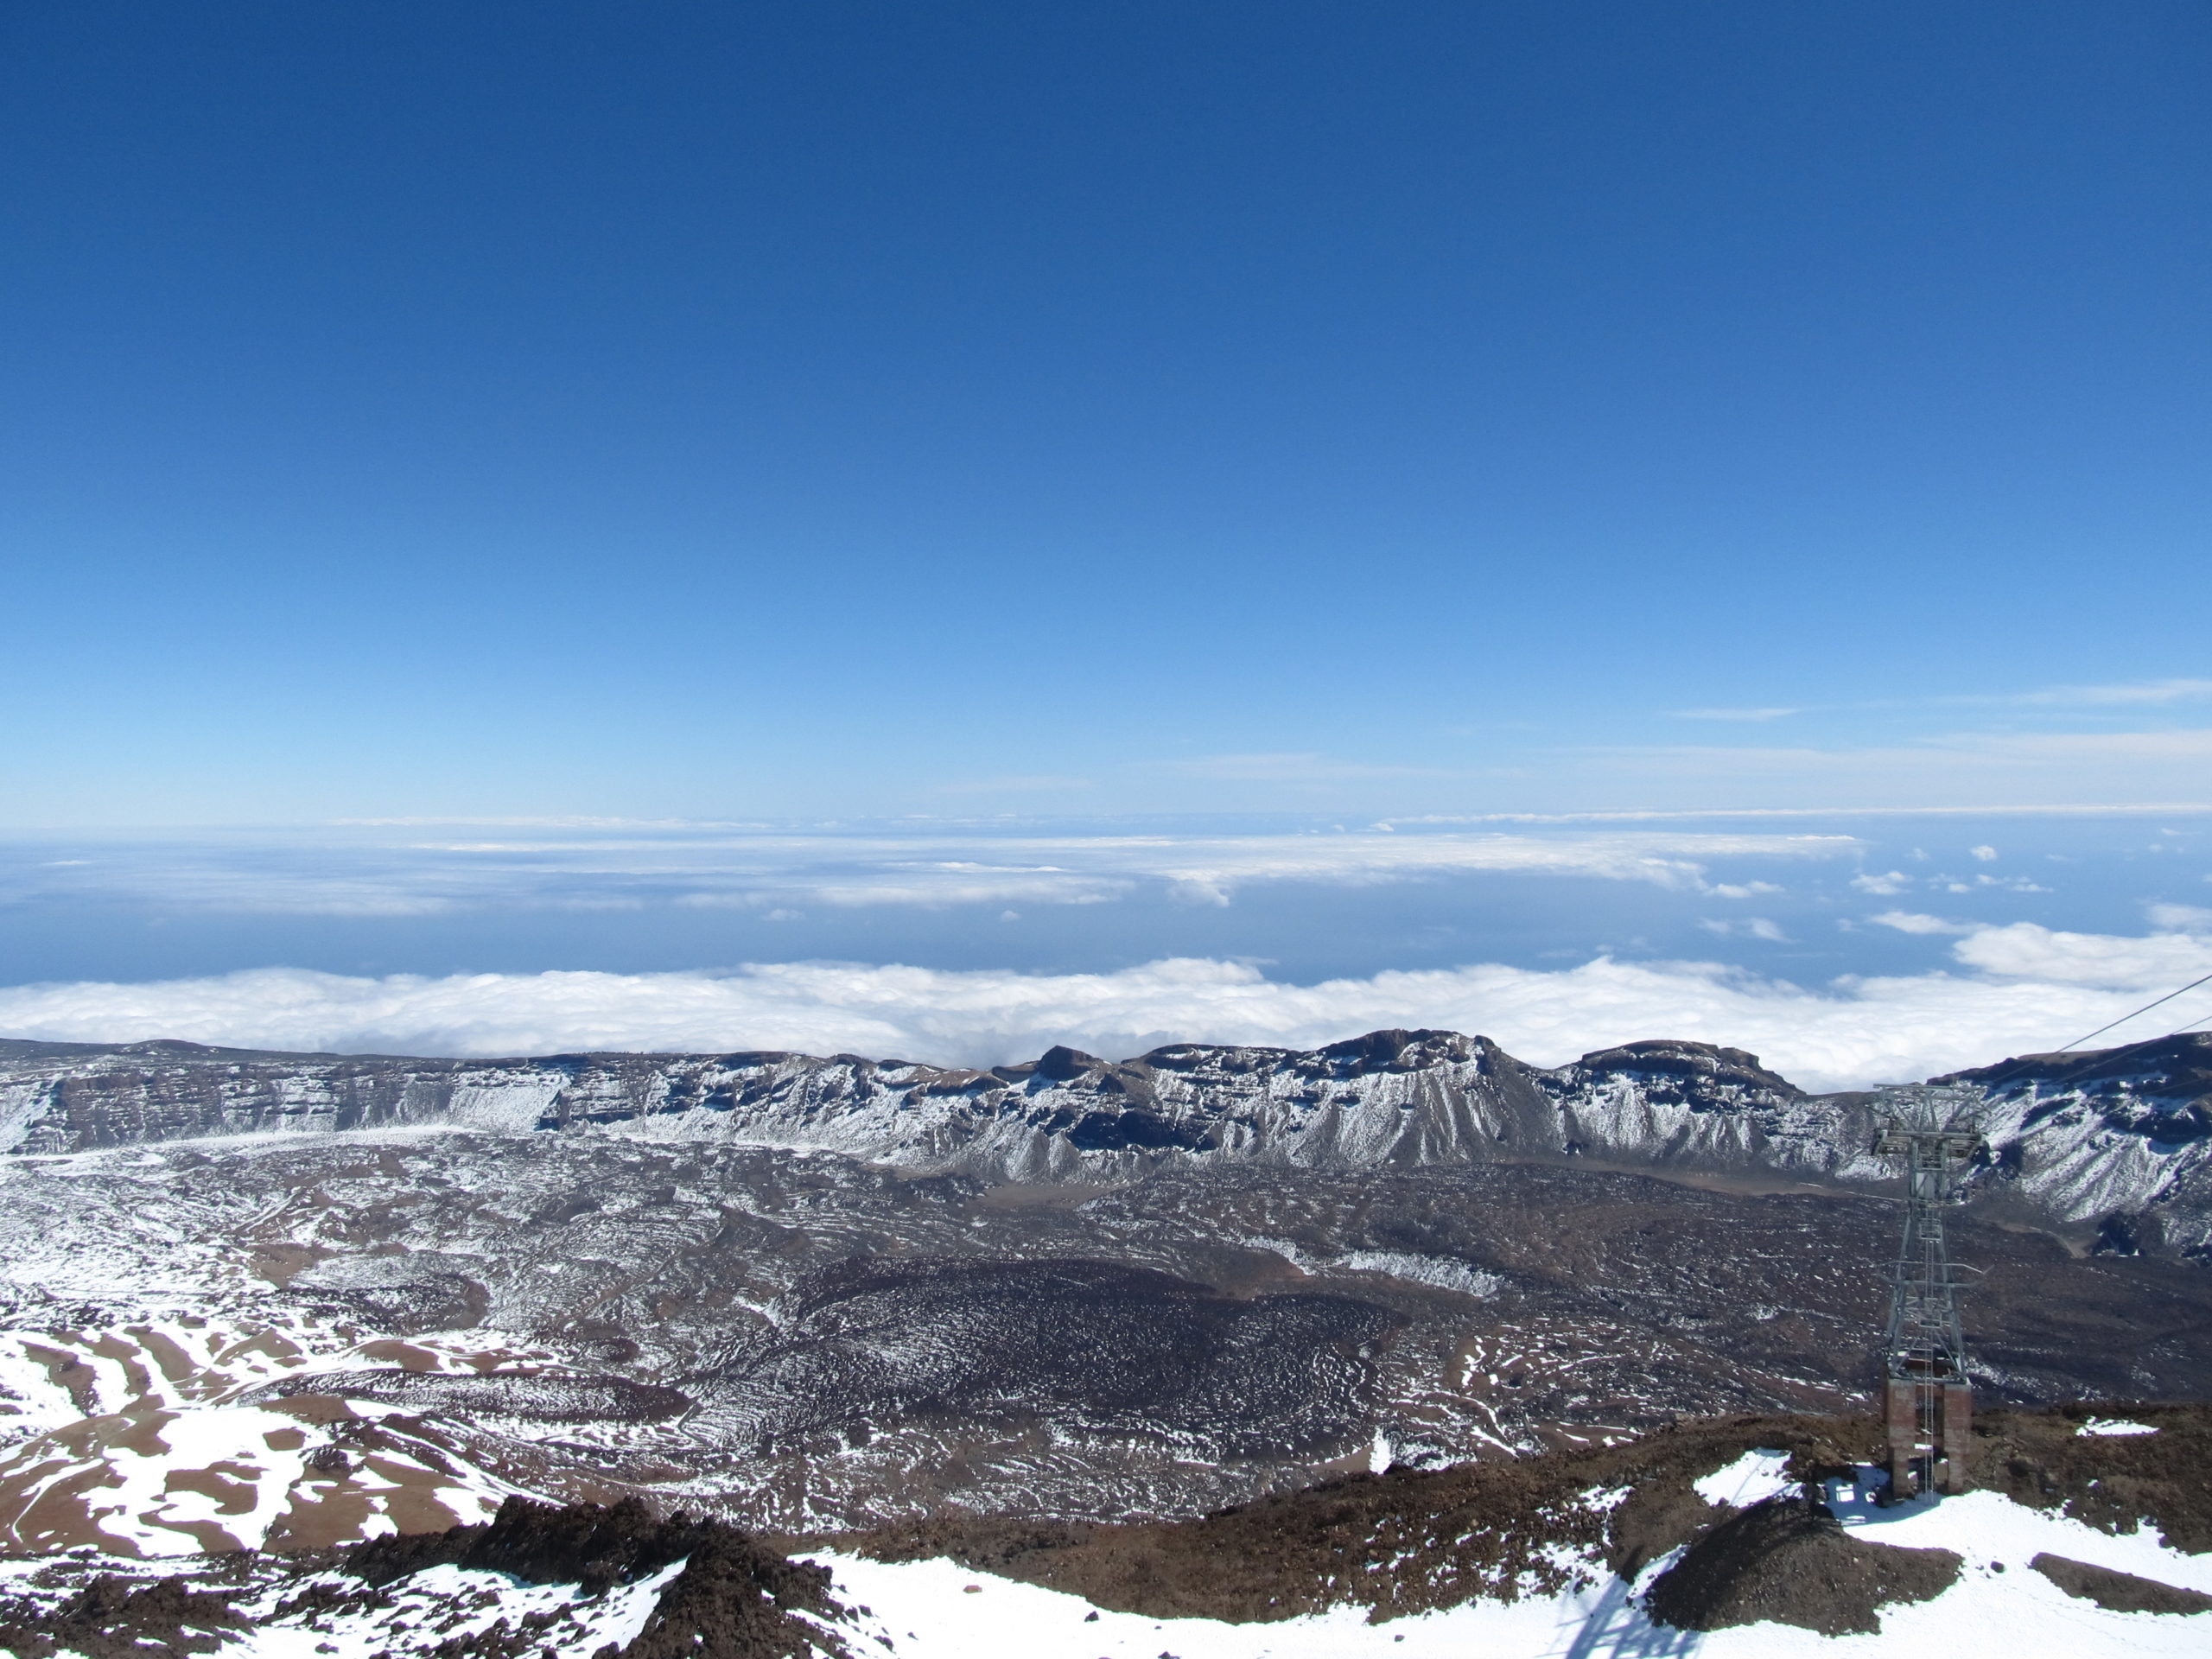
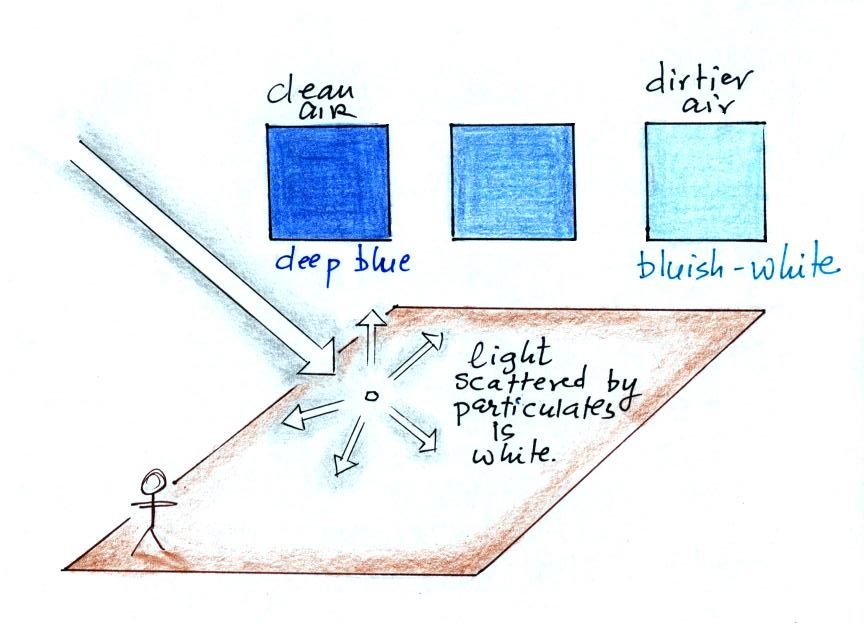
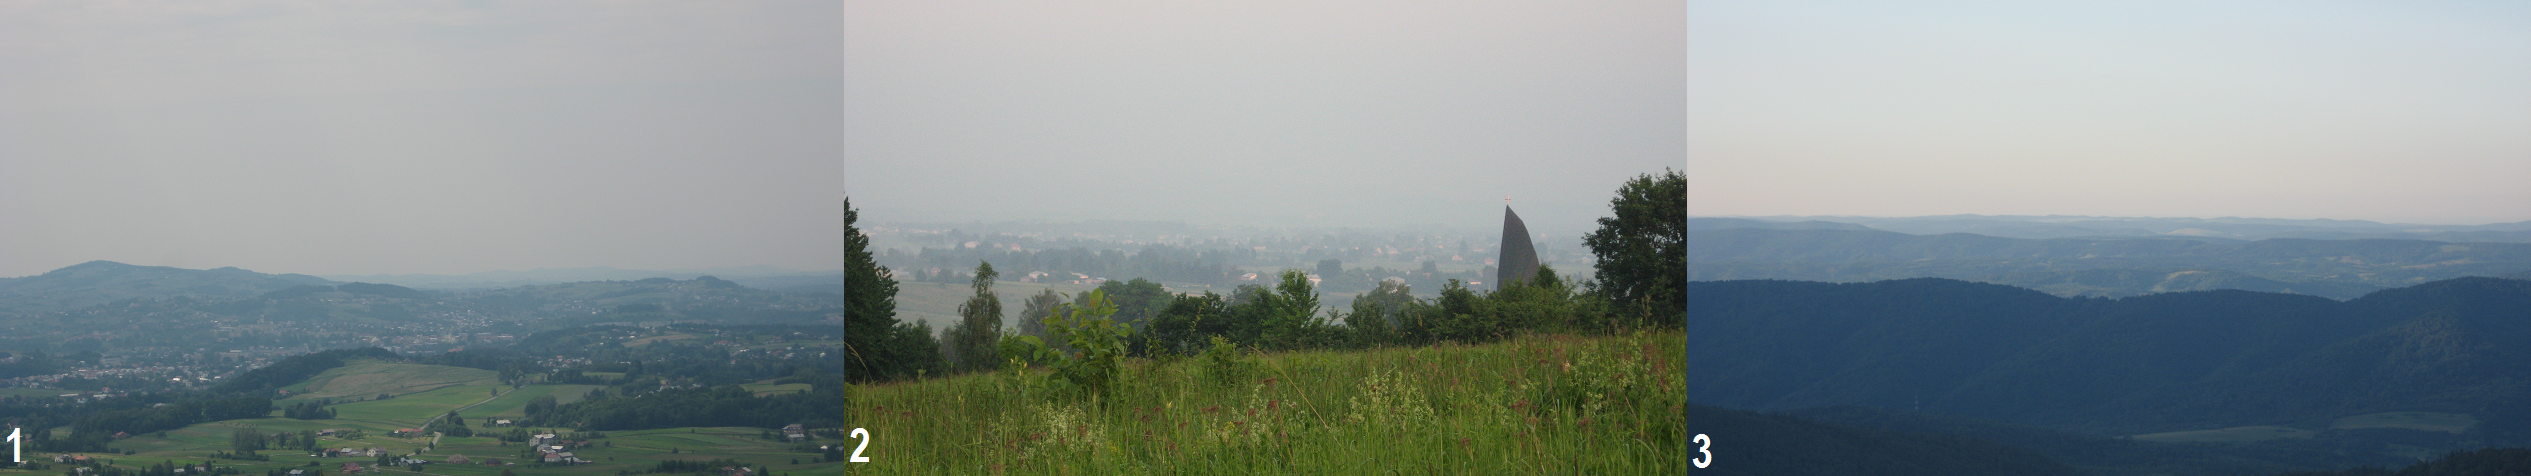
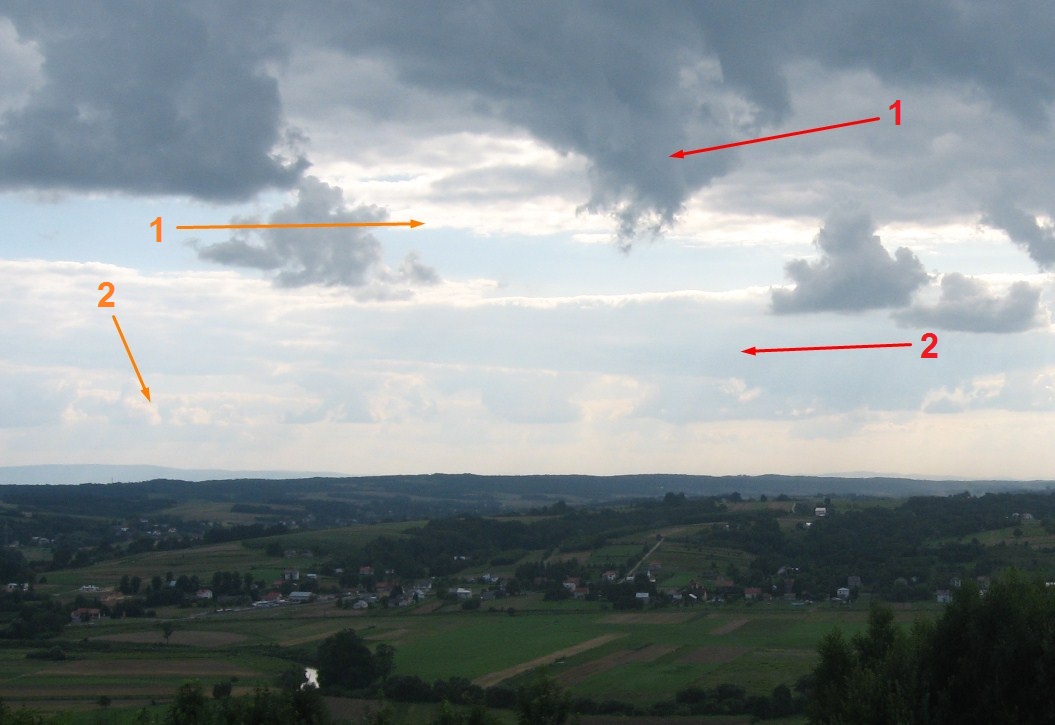
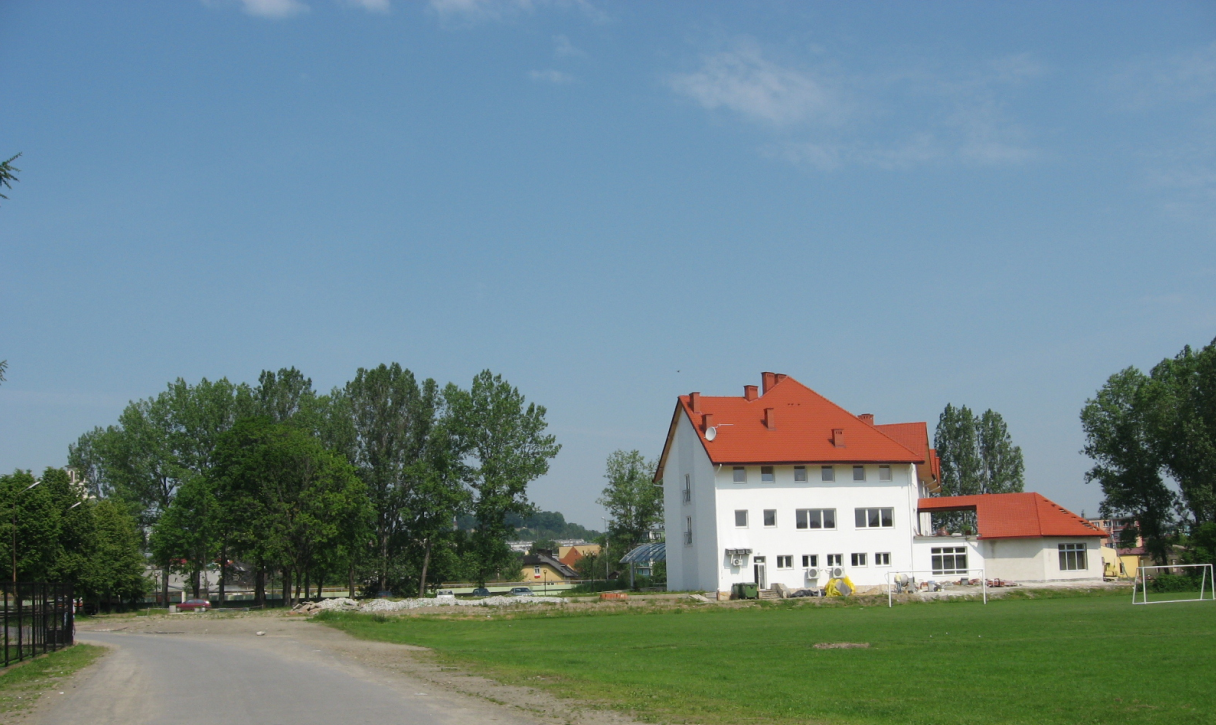
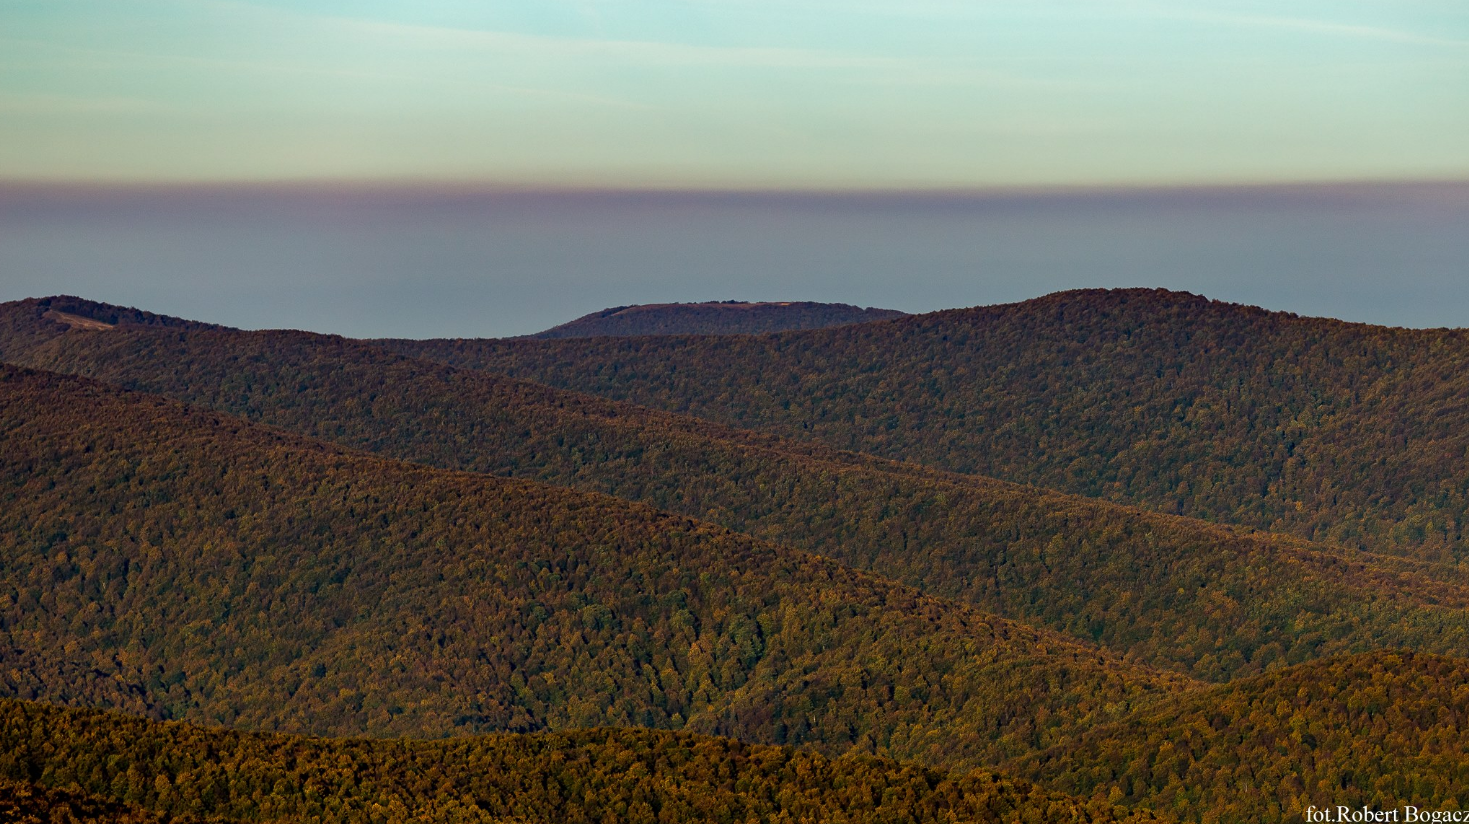
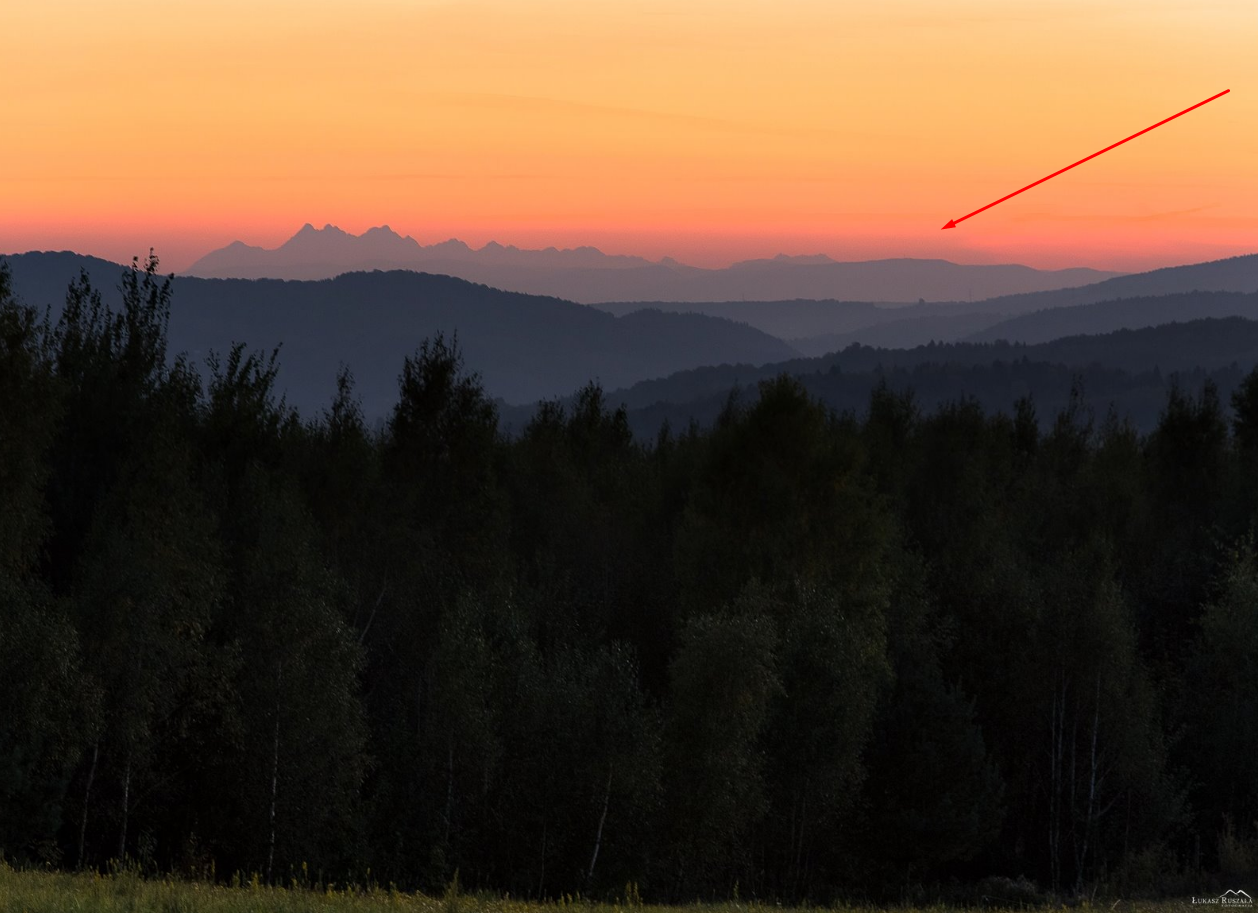
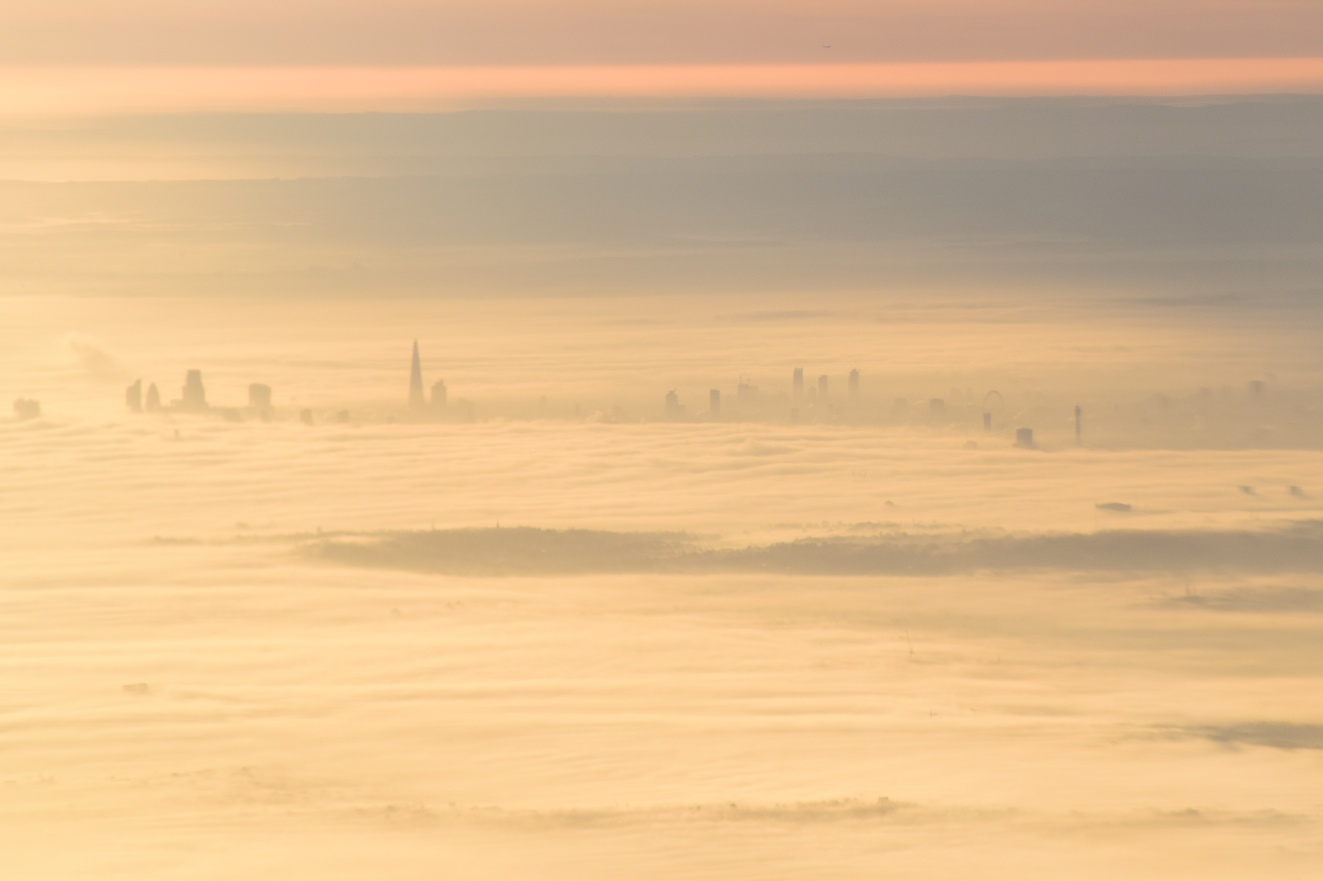
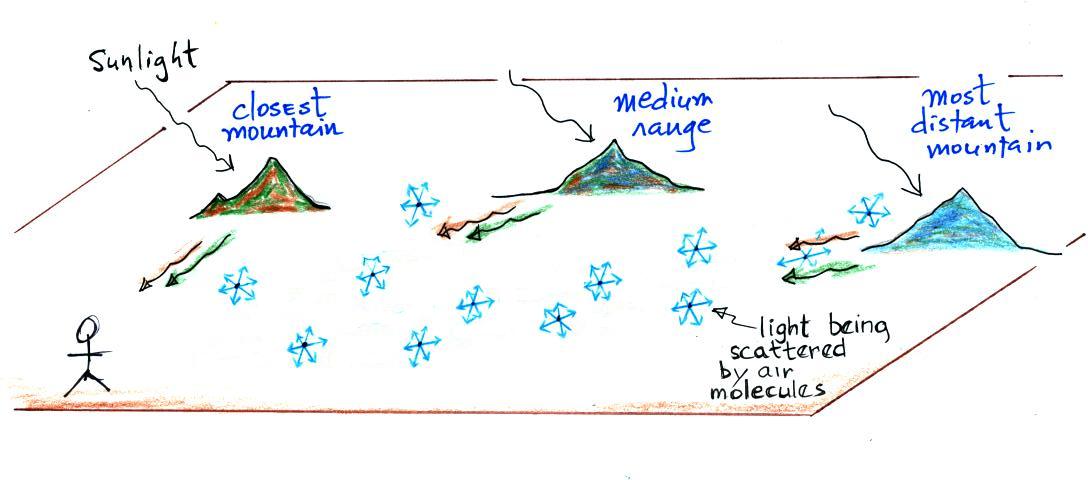
The presence of the haze in the atmosphere impacts the light scattering. Haze makes usually a milky white color for the atmosphere (Pic. 1), while against a bright background, it will become yellowish, grey, or orange-red at sunrise/sunset (Pic. 2); likewise, against a darker background, it will be light blue (Pic. 3). This is due to the optical effect caused by the haze particles; i.e. the scattering of light by the haze particles. The type and direction of scattering depend critically on the size of the particle (Ackerman, Knox, 2007). The presence of haze is strongly related to the Beer-Lambert Law, described in an earlier article. It means, that as the cloud is further from the observer, its color turns from dark to bluish when shaded and from yellowish to reddish when illuminated.
There are 3 main sources of the particular matter in the terrestrial atmosphere (Kokhanovsky, 2008):
– surface (e.g. dust or sea salt),
– gas-to-particle conversion
– cosmic aerosols
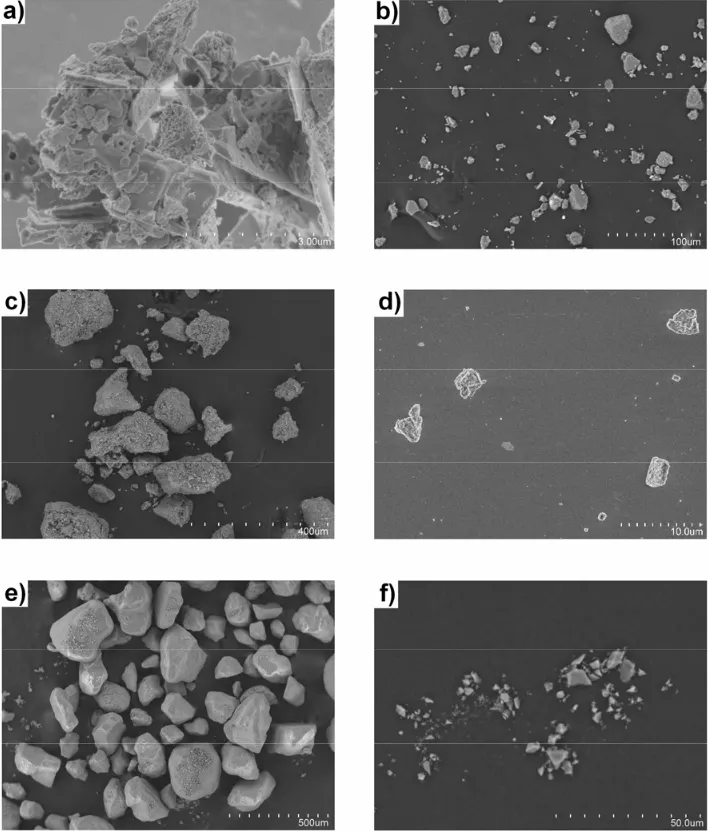
Important is the orientation and shape of the aerosol particles also, which can slightly modify the route of light through the hazy environment. These shapes are different depending on the kind of environment. In an arid environment, like a desert, semi-desert as well as in continental air mass these shapes can be really various and irregular due to local factors. One of these is the local soil composition and thus aerosol source composition, which can vary dramatically from one region to another (Reid et al., 2003). Another factor is the time of atmospheric residence (see details in the previous article) these particles, which for all this time fall into reactions with other particles suspended in the air. These reactions change a chemical composition, often along with the physical shape of aerosol (Khalizov et al., 2009). As a result, dust particles often consist of agglomeration of different materials and tend to have more complicated shapes. These particles can contain sharp edges, points, chains, or internal voids.
In a wet environment, aerosols interact with ambient water vapor. This process affects their size, shape, chemical composition, and consequently their optical properties. The shape of aerosols depends on the relative humidity. As more water is coated on the surface of the particle, the overall shape becomes more spherical, changing the scattering properties. Water is absorbed by the volume of the particle. In effect, the particle changes its shape, size, and optical properties. In a humid environment, where most of the particles have a regular shape i.e. cubic or spherical, the light scattering will be more effective.
Next to the shape, also the size of atmospheric aerosols is important in light scattering. For arid conditions, the main role in the size of aerosols is the wind, which keeps them suspended for a long time (Hinds, 1999).
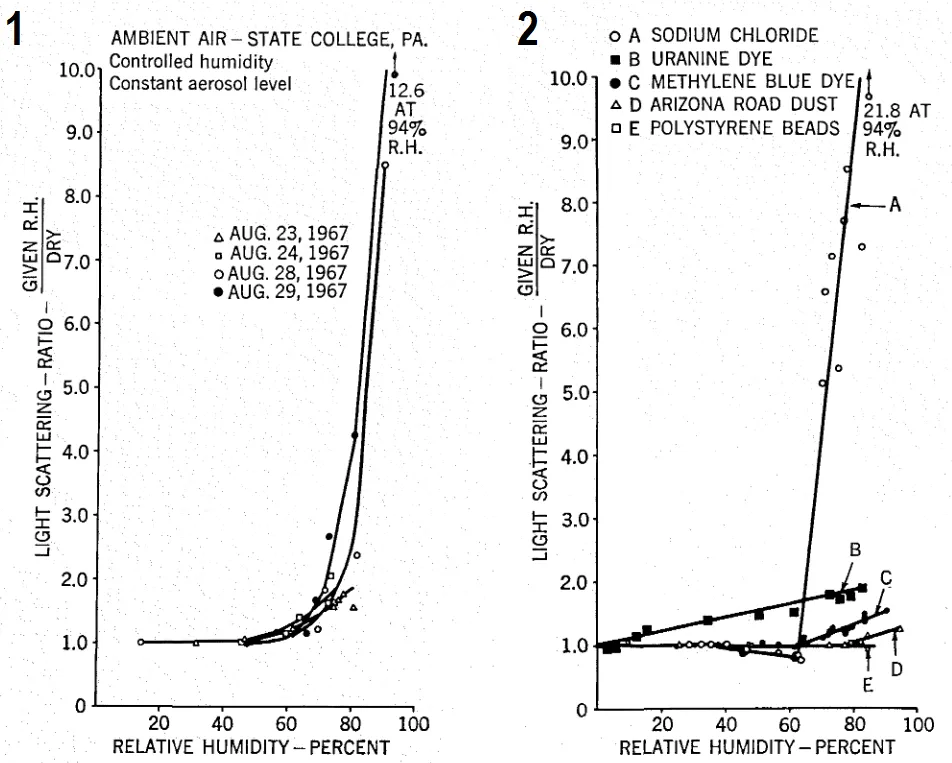
The final, the pivot factor, determining the degree of light scattering and changes in the visual range is relative humidity. We can treat relative humidity somewhat like a “distance” from the dew point, which is a normal fog, and the observer is able to see nothing. Relative humidity tells us about the presence of smallish water droplets in the air, which are next absorbed by aerosol particles or cause their coagulation or condensation. This is a strong relationship between relative humidity and light scattering. Depending on the aerosol hygroscopic fraction the increase of light scattering may start from 50% of relative humidity, whereas at about 70% rapid light scattering changes are observed (Pic. 6).
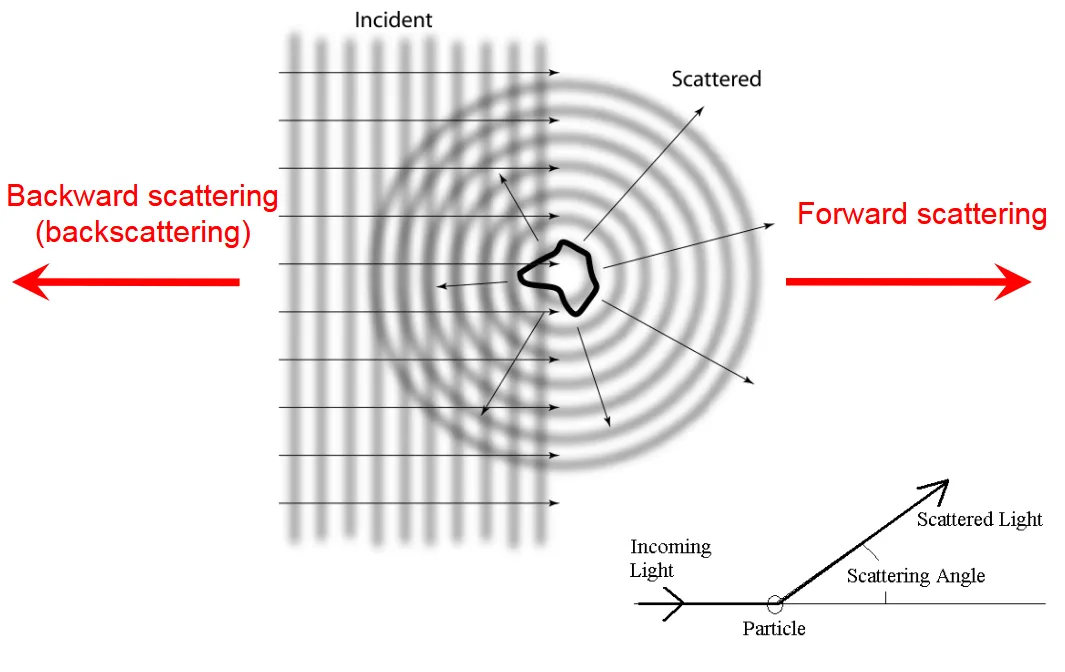
Basically, there are 2 types of light scattering depending on the illumination source location. This is forward and backward scattering (Pic. 7).
Forward scattering involves a change of radiation less than 90 degrees. In our case, it will refer to the section of the sky being on the same side, where the primary illumination source – the Sun is.
Backward scattering (backscatter) will involve changes of radiation higher than 90 degrees, thus occurring on the antisolar section of the sky (Pic. 8).
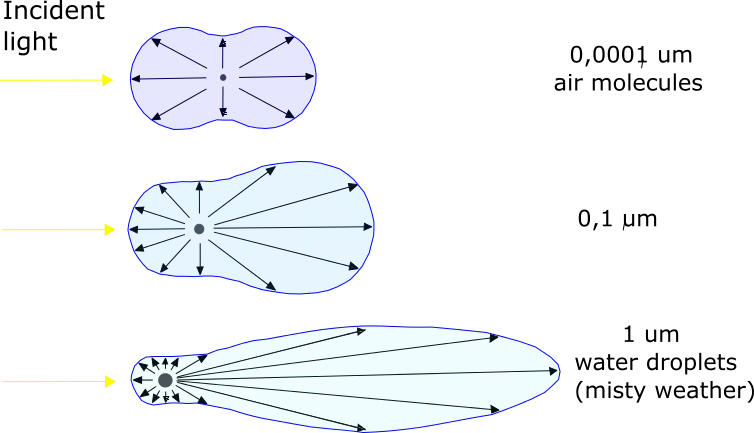
The effect of light scattering depends on the size of the particles (Pic. 8). The weakest light scattering occurs for air molecules and the smallest aerosols, which is typical for near-Rayleigh conditions. The most effective scattering occurs for water droplets or extremely dense haze particles suspended in the atmosphere when non-selective scattering plays the main role.
We used to treat the Earth’s atmosphere as a place of a multitude of simple particles, where each particle is exposed to and also scatters, the light that has already been scattered by other particles (Liou, 2002). This is a multiple scattering, which is accompanied by absorption. A large absorption occurs for mineral, dustlike, and water-soluble particles and particularly for soot (Liou, 2002).
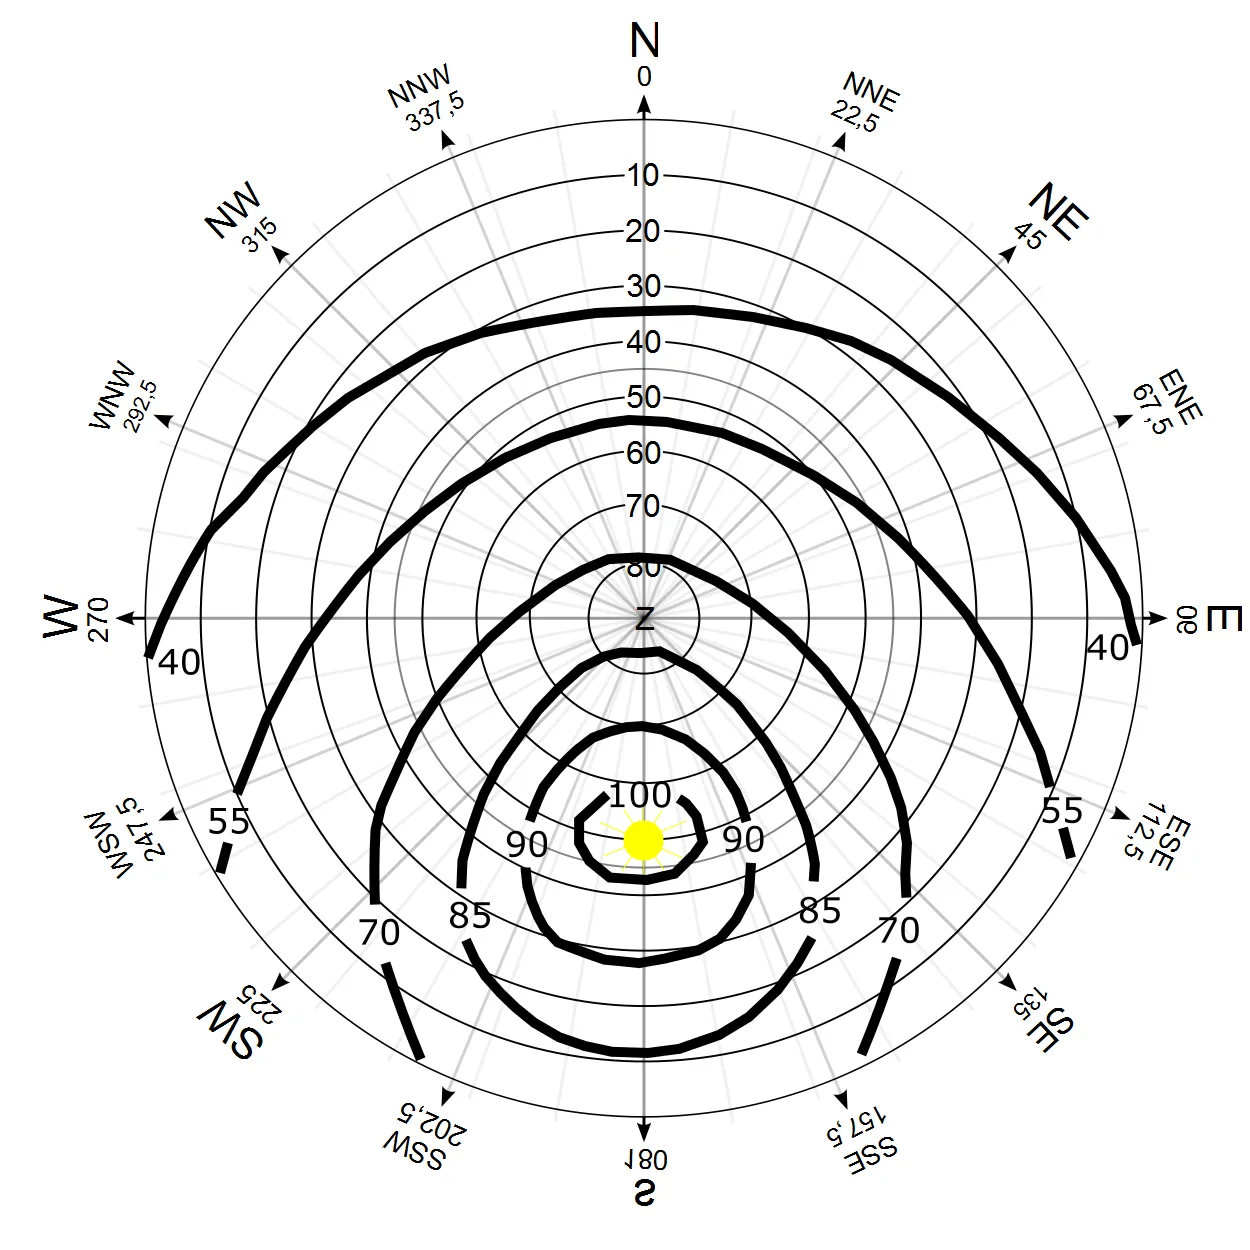
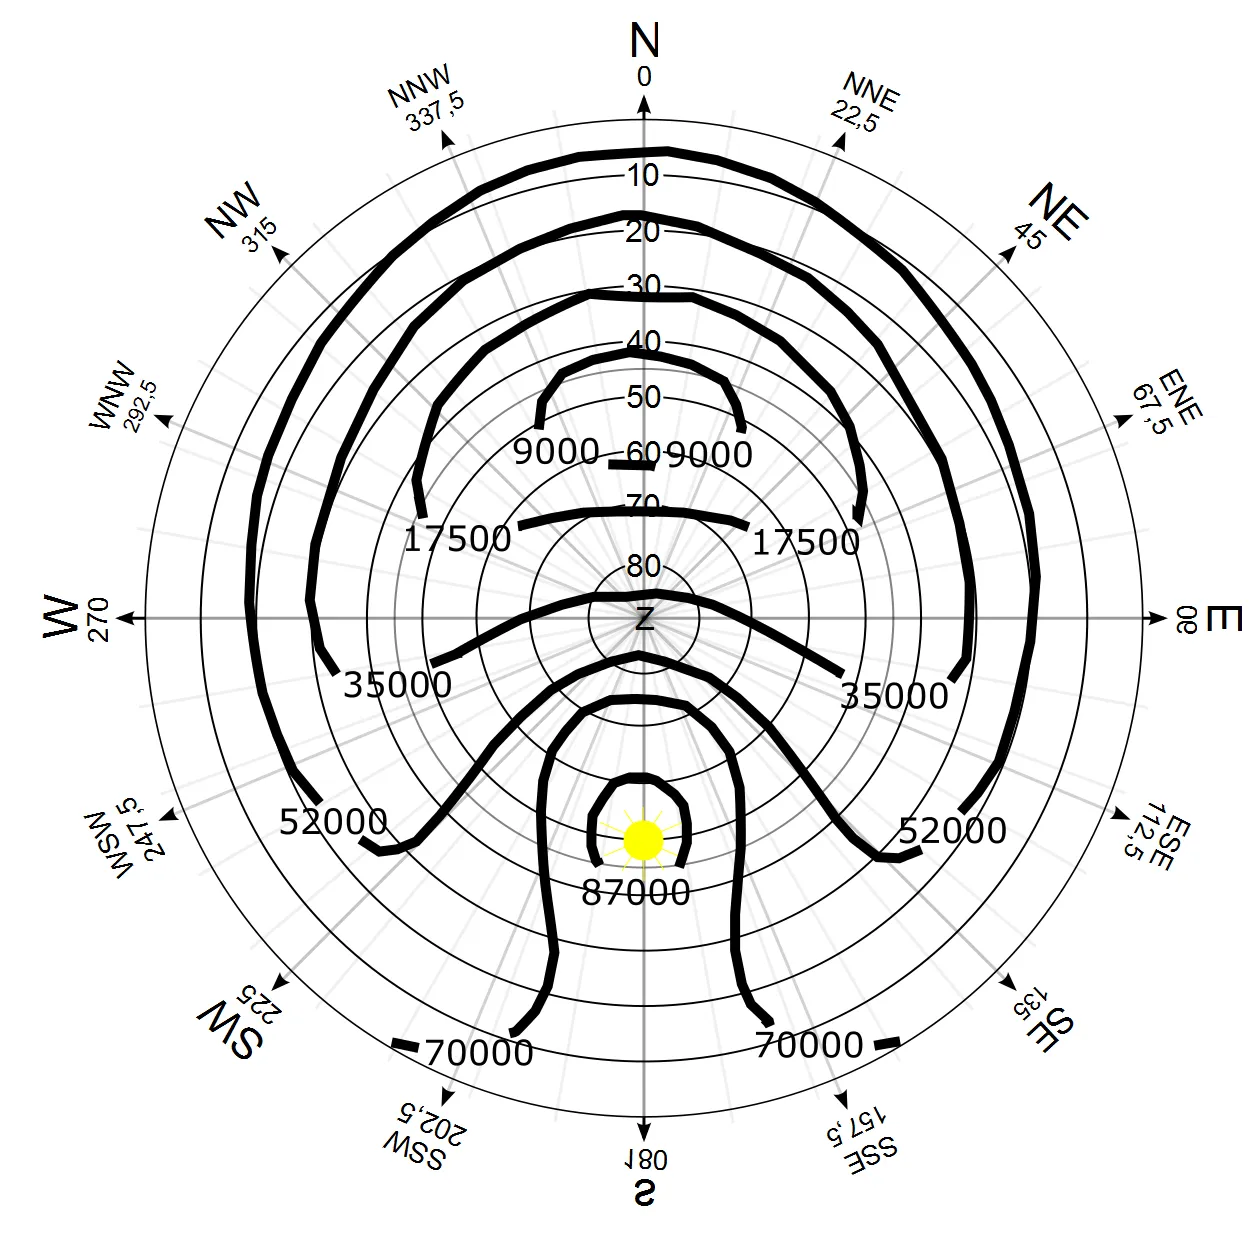
We have to take into account also the effects of the angle between the source of illumination and part of the sky observed. This is easy to spot when the cloud layer covers the sky and some clear gaps appear. Then rays of sunlight (crepuscular rays) can be seen from the point of the sky where the Sun is located. What happens under hazy conditions. When a big aerosol concentration takes place under a clear sky, the observer is able to spot a very bright area when looking close to the Sun. The sky appears to be darker towards the symmetric point on the sky or antisolar point (when an observer is above the layered haze) (Pic. 9). Knowing, that apparent illuminance of the Sun varies from around 10000 Lx at the 10 deg altitude to 129000 Lx at zenith we can simply calculate the illuminance level of the certain regions of the sky (Pic. 10).
Even during the day free of haze in near Rayleigh scattering conditions the light dispersing throughout the blue sphere illuminated by the Sun can be described as below:
- The brightest area is near the illumination source (Sun or Moon),
- The darkest area is located on the opposite side of the sky. Its presence above the horizon depends on the location of the Sun. For example, when the Sun shines in zenith, then the darkest area of the sky will encircle the sphere at around 40-50 degrees altitude. In case as per the picture below, the darkest region of the sky is located more or less on the opposite part of the sky at 50 deg altitude.
- Light areas of the sky are near the horizon due to the thickness of the atmosphere, whilst the brightest part of the near-horizon sky is to be observed in the Sun’s direction.
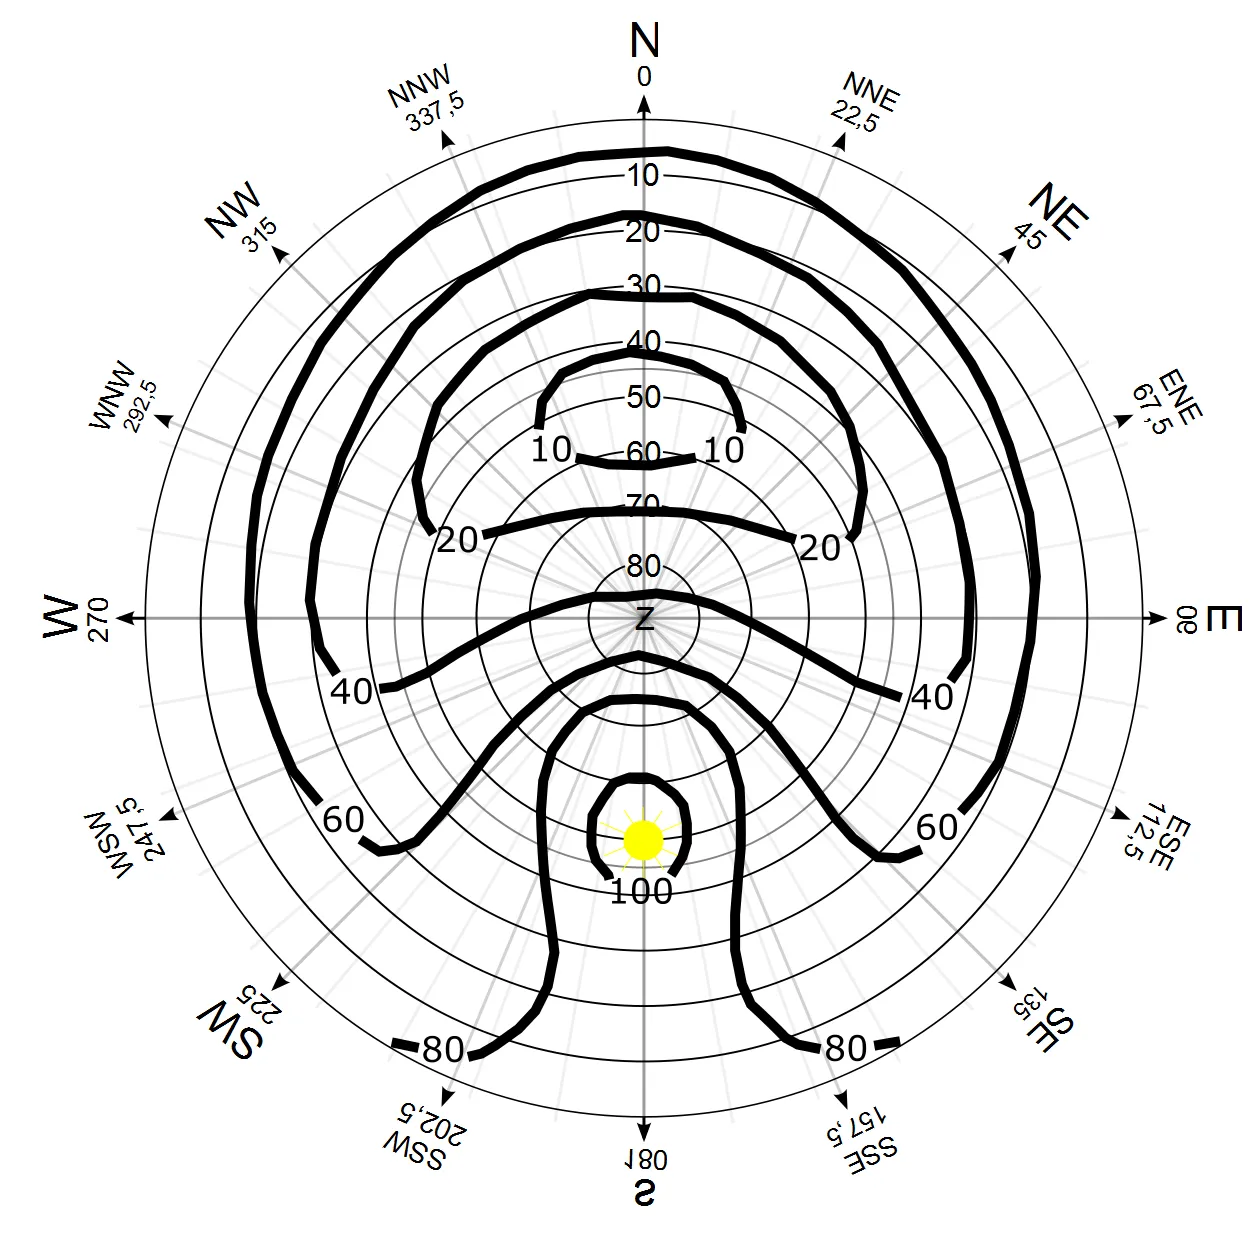
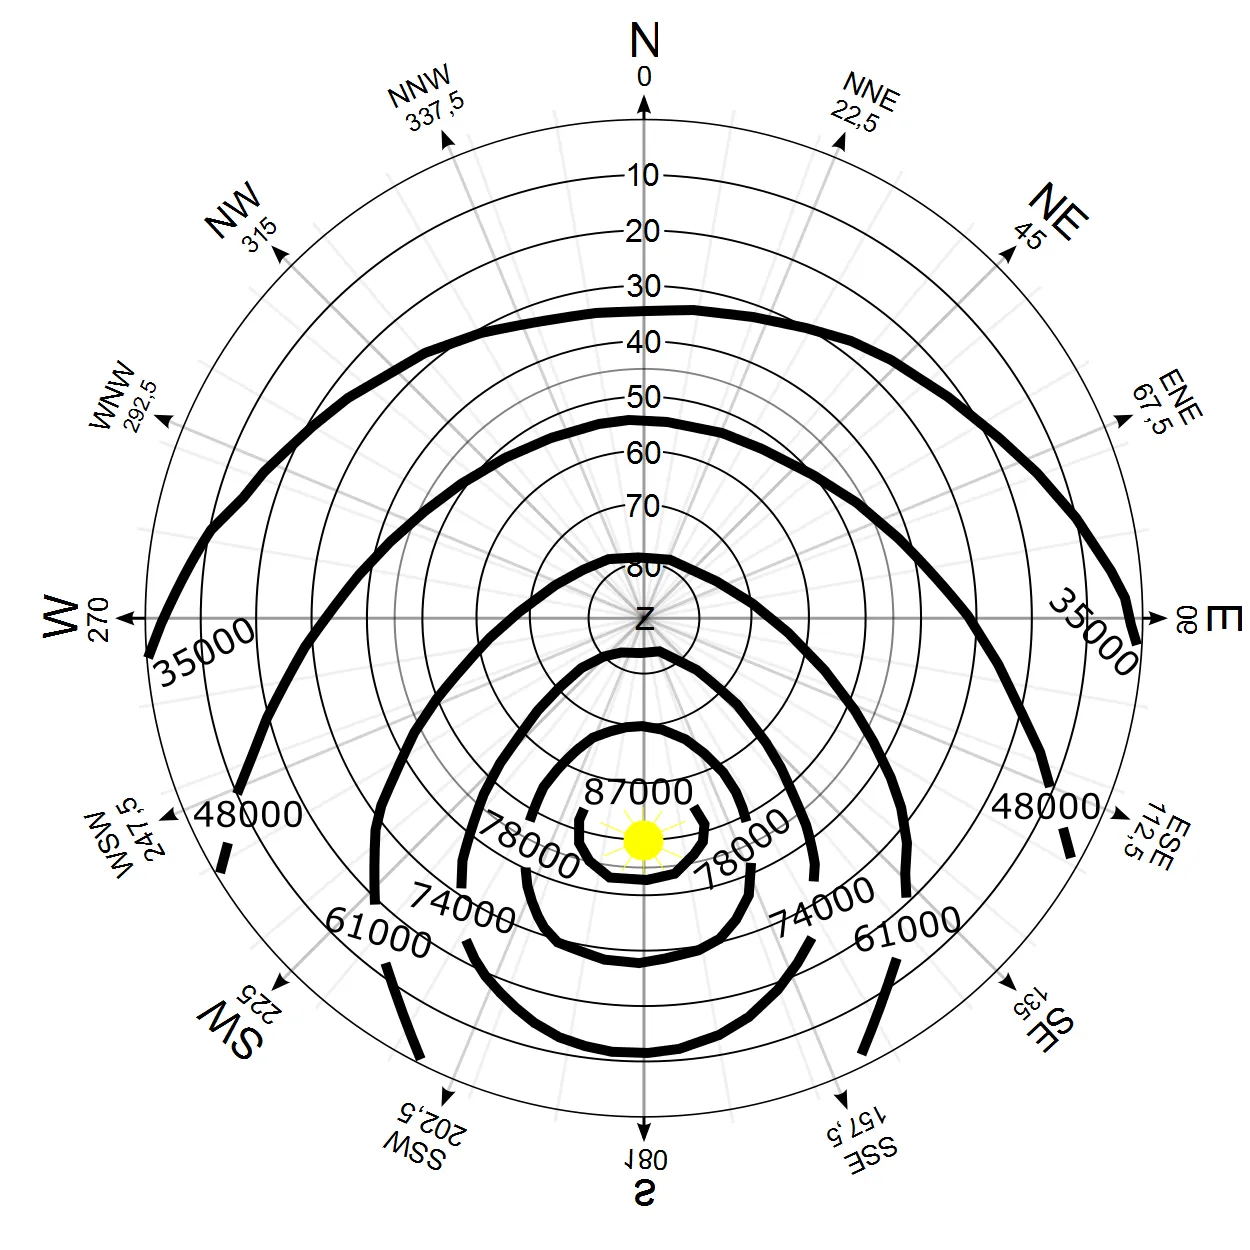
Under a free of haze conditions, the sky brightness (and diffuse sky radiation) is much more varied. The brightest area is located obviously near the Sun and corresponds to around 100% of solar illuminance, however, it is not widely developed likewise in misty conditions. Even near the edge of the Sun, the sky is blue, but its color is less pronounced due to its close vicinity to the Sun and the forward scattering of air molecules. On the contrary to the solar point, the antisolar direction is much less bright; the range of illuminance level corresponds between less than 10% to about 20% of the illuminance of the incident light. Considering it for the solar altitude of 50 deg (Pic. 11, 12) the incident light level is going to reach 87000 lx, whereas the sky region in the antisolar direction should reach the illumination level of about 8 – 18000 lx.
During the free-of-haze conditions, the main role plays air molecules, which scatter light about equally in the forward and backward direction and scatter more blue light than red, hence the sky is blue (Malm, 2016). Due to haze sky appears to be brighter than during the near Rayleigh scattering conditions.
2. RELATION WITH PLANETARY BOUNDARY LAYER
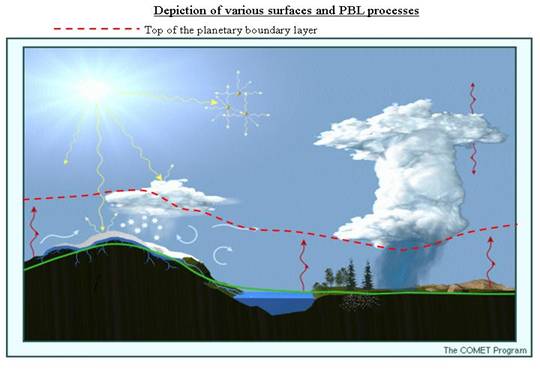
The planetary boundary layer also known as the atmospheric boundary layer is the lowest part of the atmosphere. Its behavior is strongly influenced by Earth’s surface on the temperature, moisture, and wind through the turbulent transfer of air mass. As a result of surface friction winds in the planetary boundary layer are weaker than above and tend to blow toward areas of low pressure. The planetary boundary layer reacts to temperature changes quickly so its thickness varies within the day. Usually, the planetary boundary layer reaches from a few several meters up to 5 kilometers (above the desert). Above this layer is the “free atmosphere” where the wind is parallel to isobars unlike inside this layer which is affected by drag over the surface.
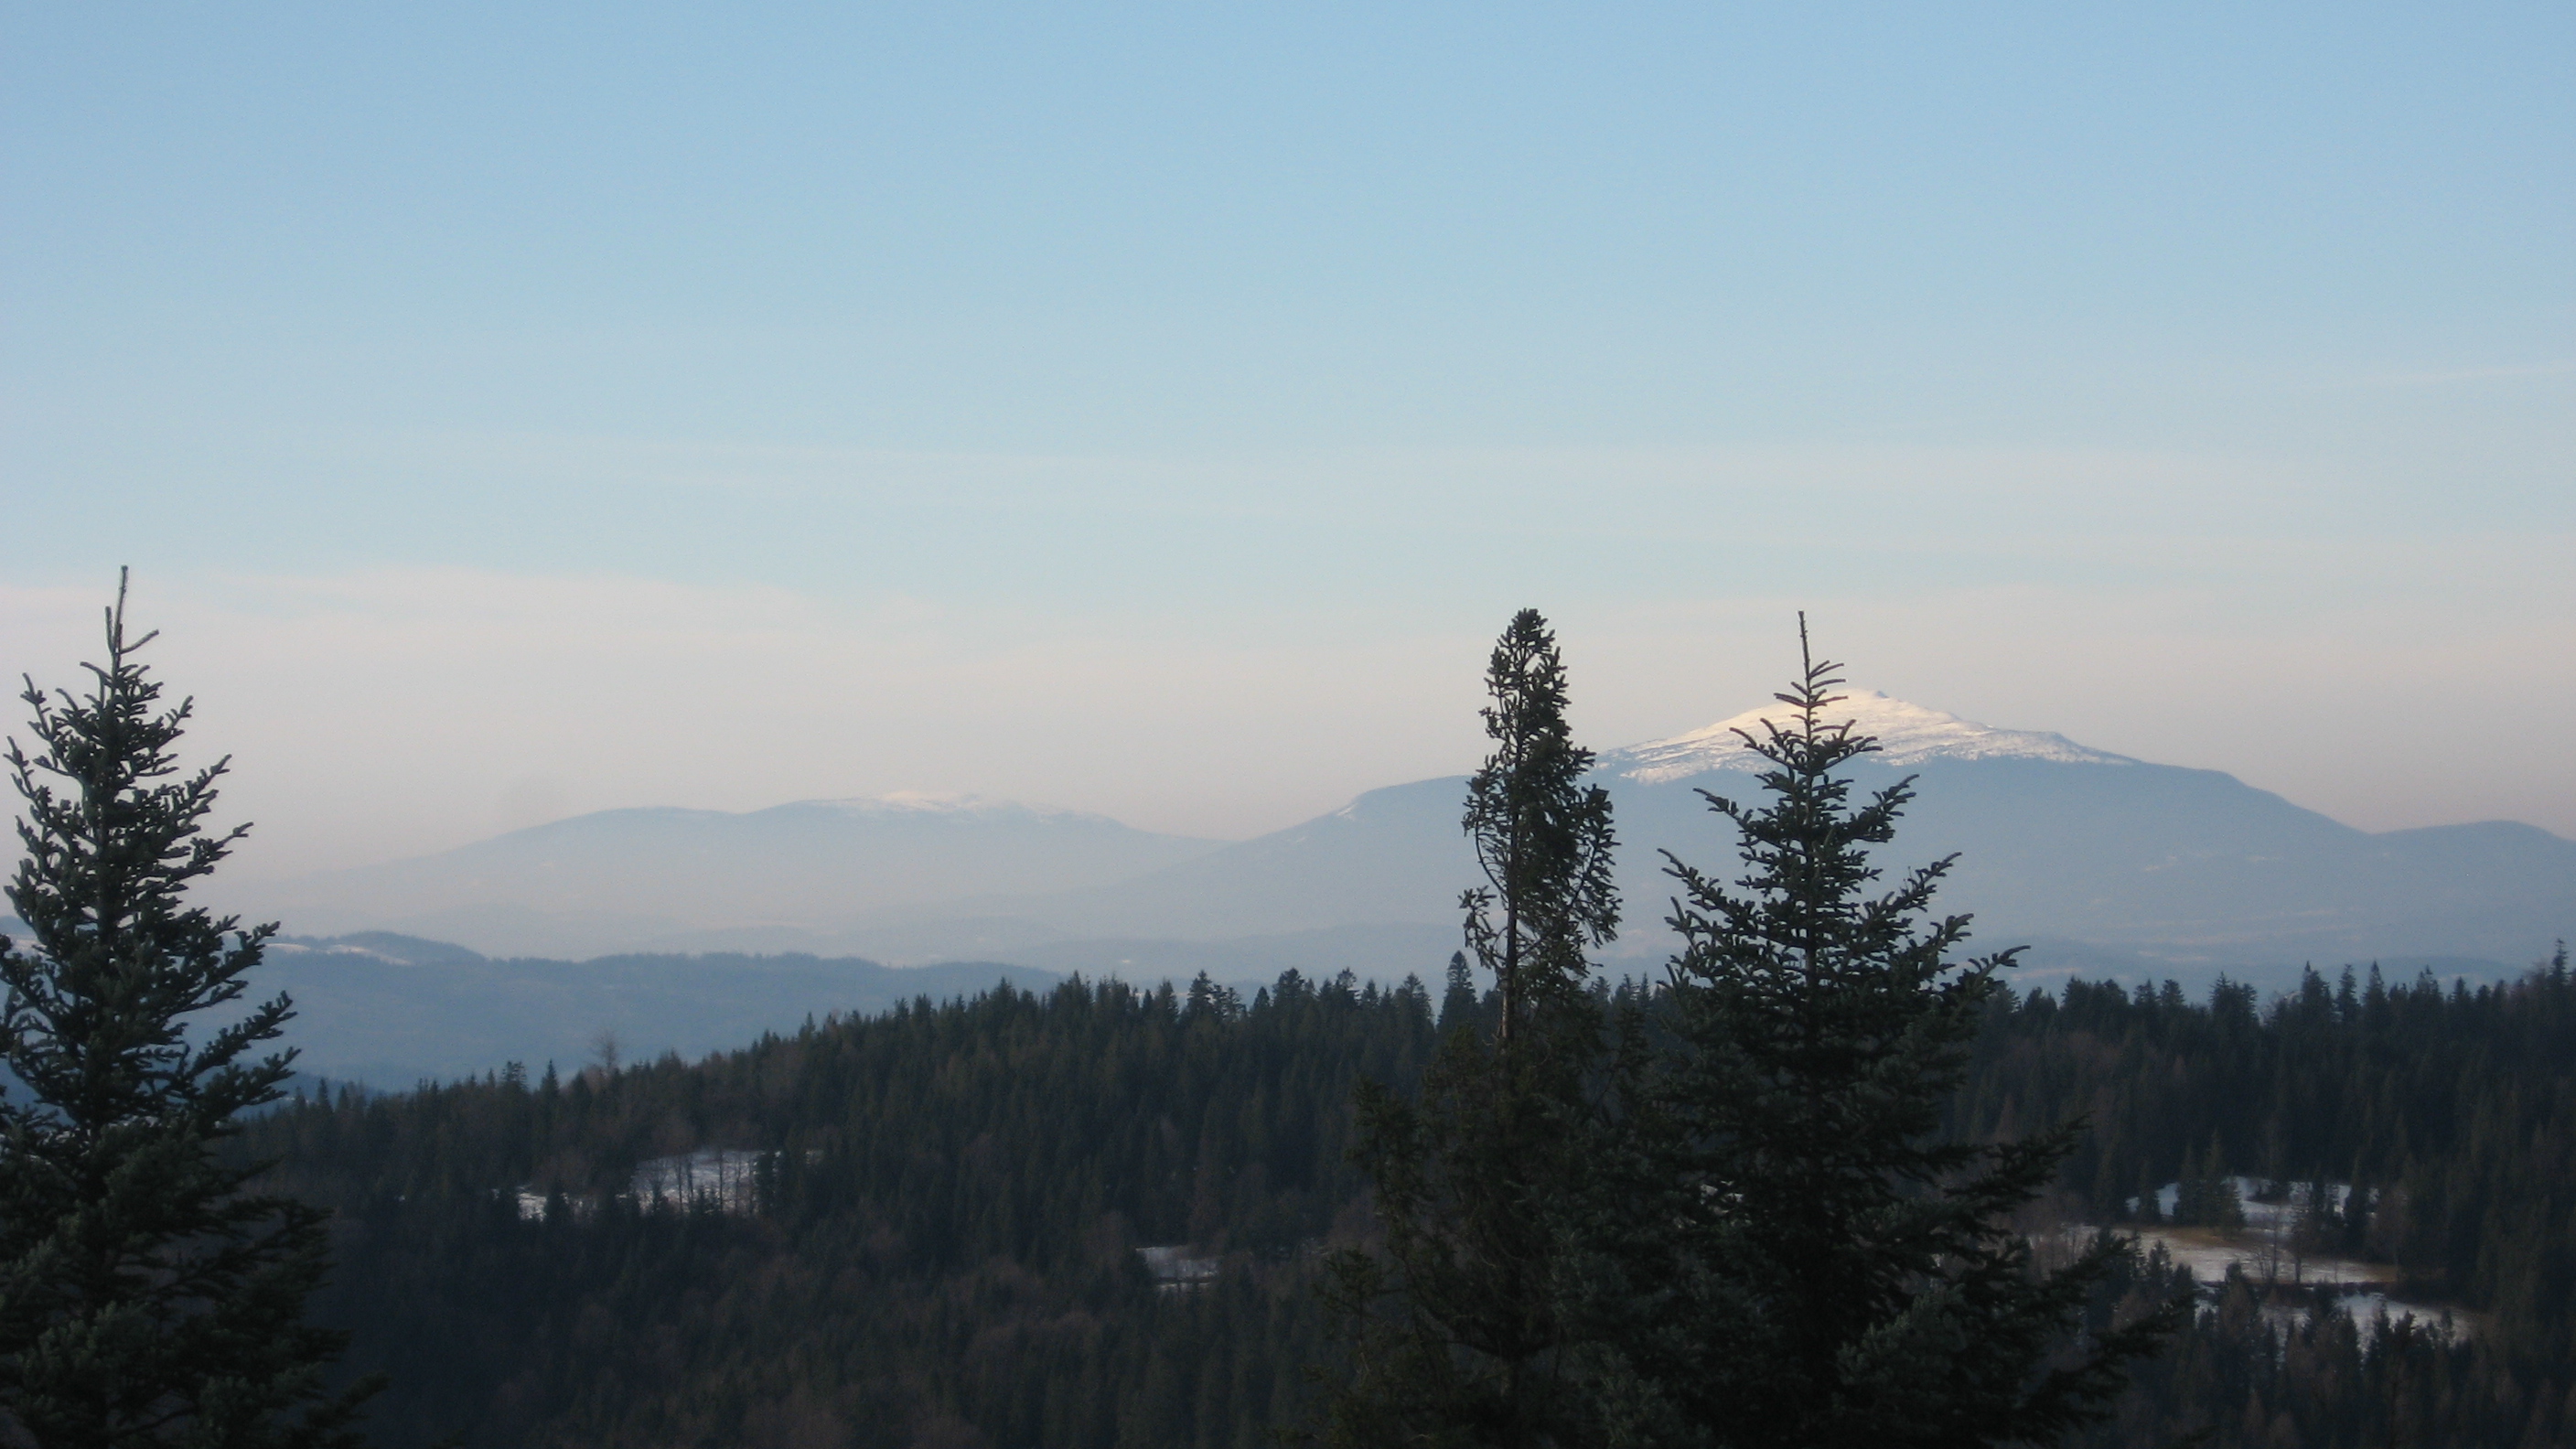
The planetary boundary layer behavior differs between the flat surface and mountainous area, which is more complicated (Pic. 16, 22). There, it usually adjusts to the local latitude. Land roughness influences the wind system. A big role plays also the effect of land cover. Whereas in the valleys is summer on the top can be still wintry weather with snow cover. These factors make the planetary boundary layer more unpredictable. Moreover planetary boundary layer changes throughout the day (Pic. 17) due to changes in irradiation.
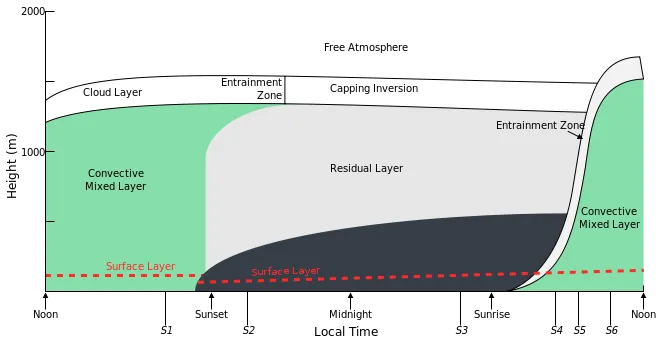
During the daytime hours, the planetary boundary layer comprises the surface layer, which is the lowest part. It features a super adiabatic lapse rate and moisture decrease with height. In windy conditions, the surface layer is characterized by a strong wind shear caused by friction. Above a surface layer, the mixed layer is located, where next to a horizontal air mass movement the vertical, turbulent updrafts play the main role. The air is risen up very quickly (with up to 40km/h velocity). The convective mixed layer has a nearly constant distribution of the potential temperature, wind speed, humidity, and haze concentration, because of the strong buoyancy generated by convective turbulent mixing. Once the supersaturation of the air is sufficient, then clouds start to form. It happens at the upper part of the planetary boundary layer, which forms the cloud cover or entrainment zone during the day. The condensation of moist air, containing aerosol releases energy, creates buoyancy and clouds rise until they reach their level of neutral buoyancy.
Rising air particles are replaced by drier air from the free atmosphere, that penetrates down the planetary boundary layer. Hence during the day, when some cumulus clouds start to appear in the sky, the visual range appears to be better, than in the morning. The air, that penetrates down from the free atmosphere, doesn’t contain as many aerosols as the rising air does.
Between the upper edge of the cloud layer, reliant on the highest thermal plume, and the deepest part of the sinking free air is called the entrainment zone. This is the layer of intermittent turbulence and overshooting thermals at the top of the convective boundary layer. The thickness of the entrainment zone depends on the vibrancy of the turbulent movements. When turbulence and thermals are more vigorous, then the entrainment zone is thicker, unlike stronger temperature inversion caps, which are thinner. In this case, the cloud base will be a capping inversion layer during the day. When the Sun is going to set, then turbulence decays. As a result, the mixed layer is turned into a residual layer, which is neutrally stratified. Then turbulence is near the same intensity in all directions. It means, that for instance, emitted smoke plumes tend to disperse at equal rates in vertical and lateral directions, creating a cone-shaped plume (Stull, 1988). Above the residual layer, the capping inversion exists, on which level the cloud deck is produced, likewise in daytime conditions, when turbulence is weak. Sometimes the capping inversion can count about 40% of the whole planetary boundary layer. The capping inversion is an elevated inversion layer, that caps a convective boundary layer. The capping inversion is caused by warmer air being above a region of cold air. Cloud formation from the lower layer is “capped” by the inversion layer. If the capping inversion is too strong, then it prevents a thunderstorm from developing, unless it is forced by strong updrafts. A strong cap can result in foggy conditions. The last issue, that I would like to add here is the general height of the planetary boundary layer. It is assumed, that a standard height is between 1,5 – 2 km above the ground. Practically the height of the planetary boundary layer changes due to weather conditions and may vary between 500 – 2500 m range.
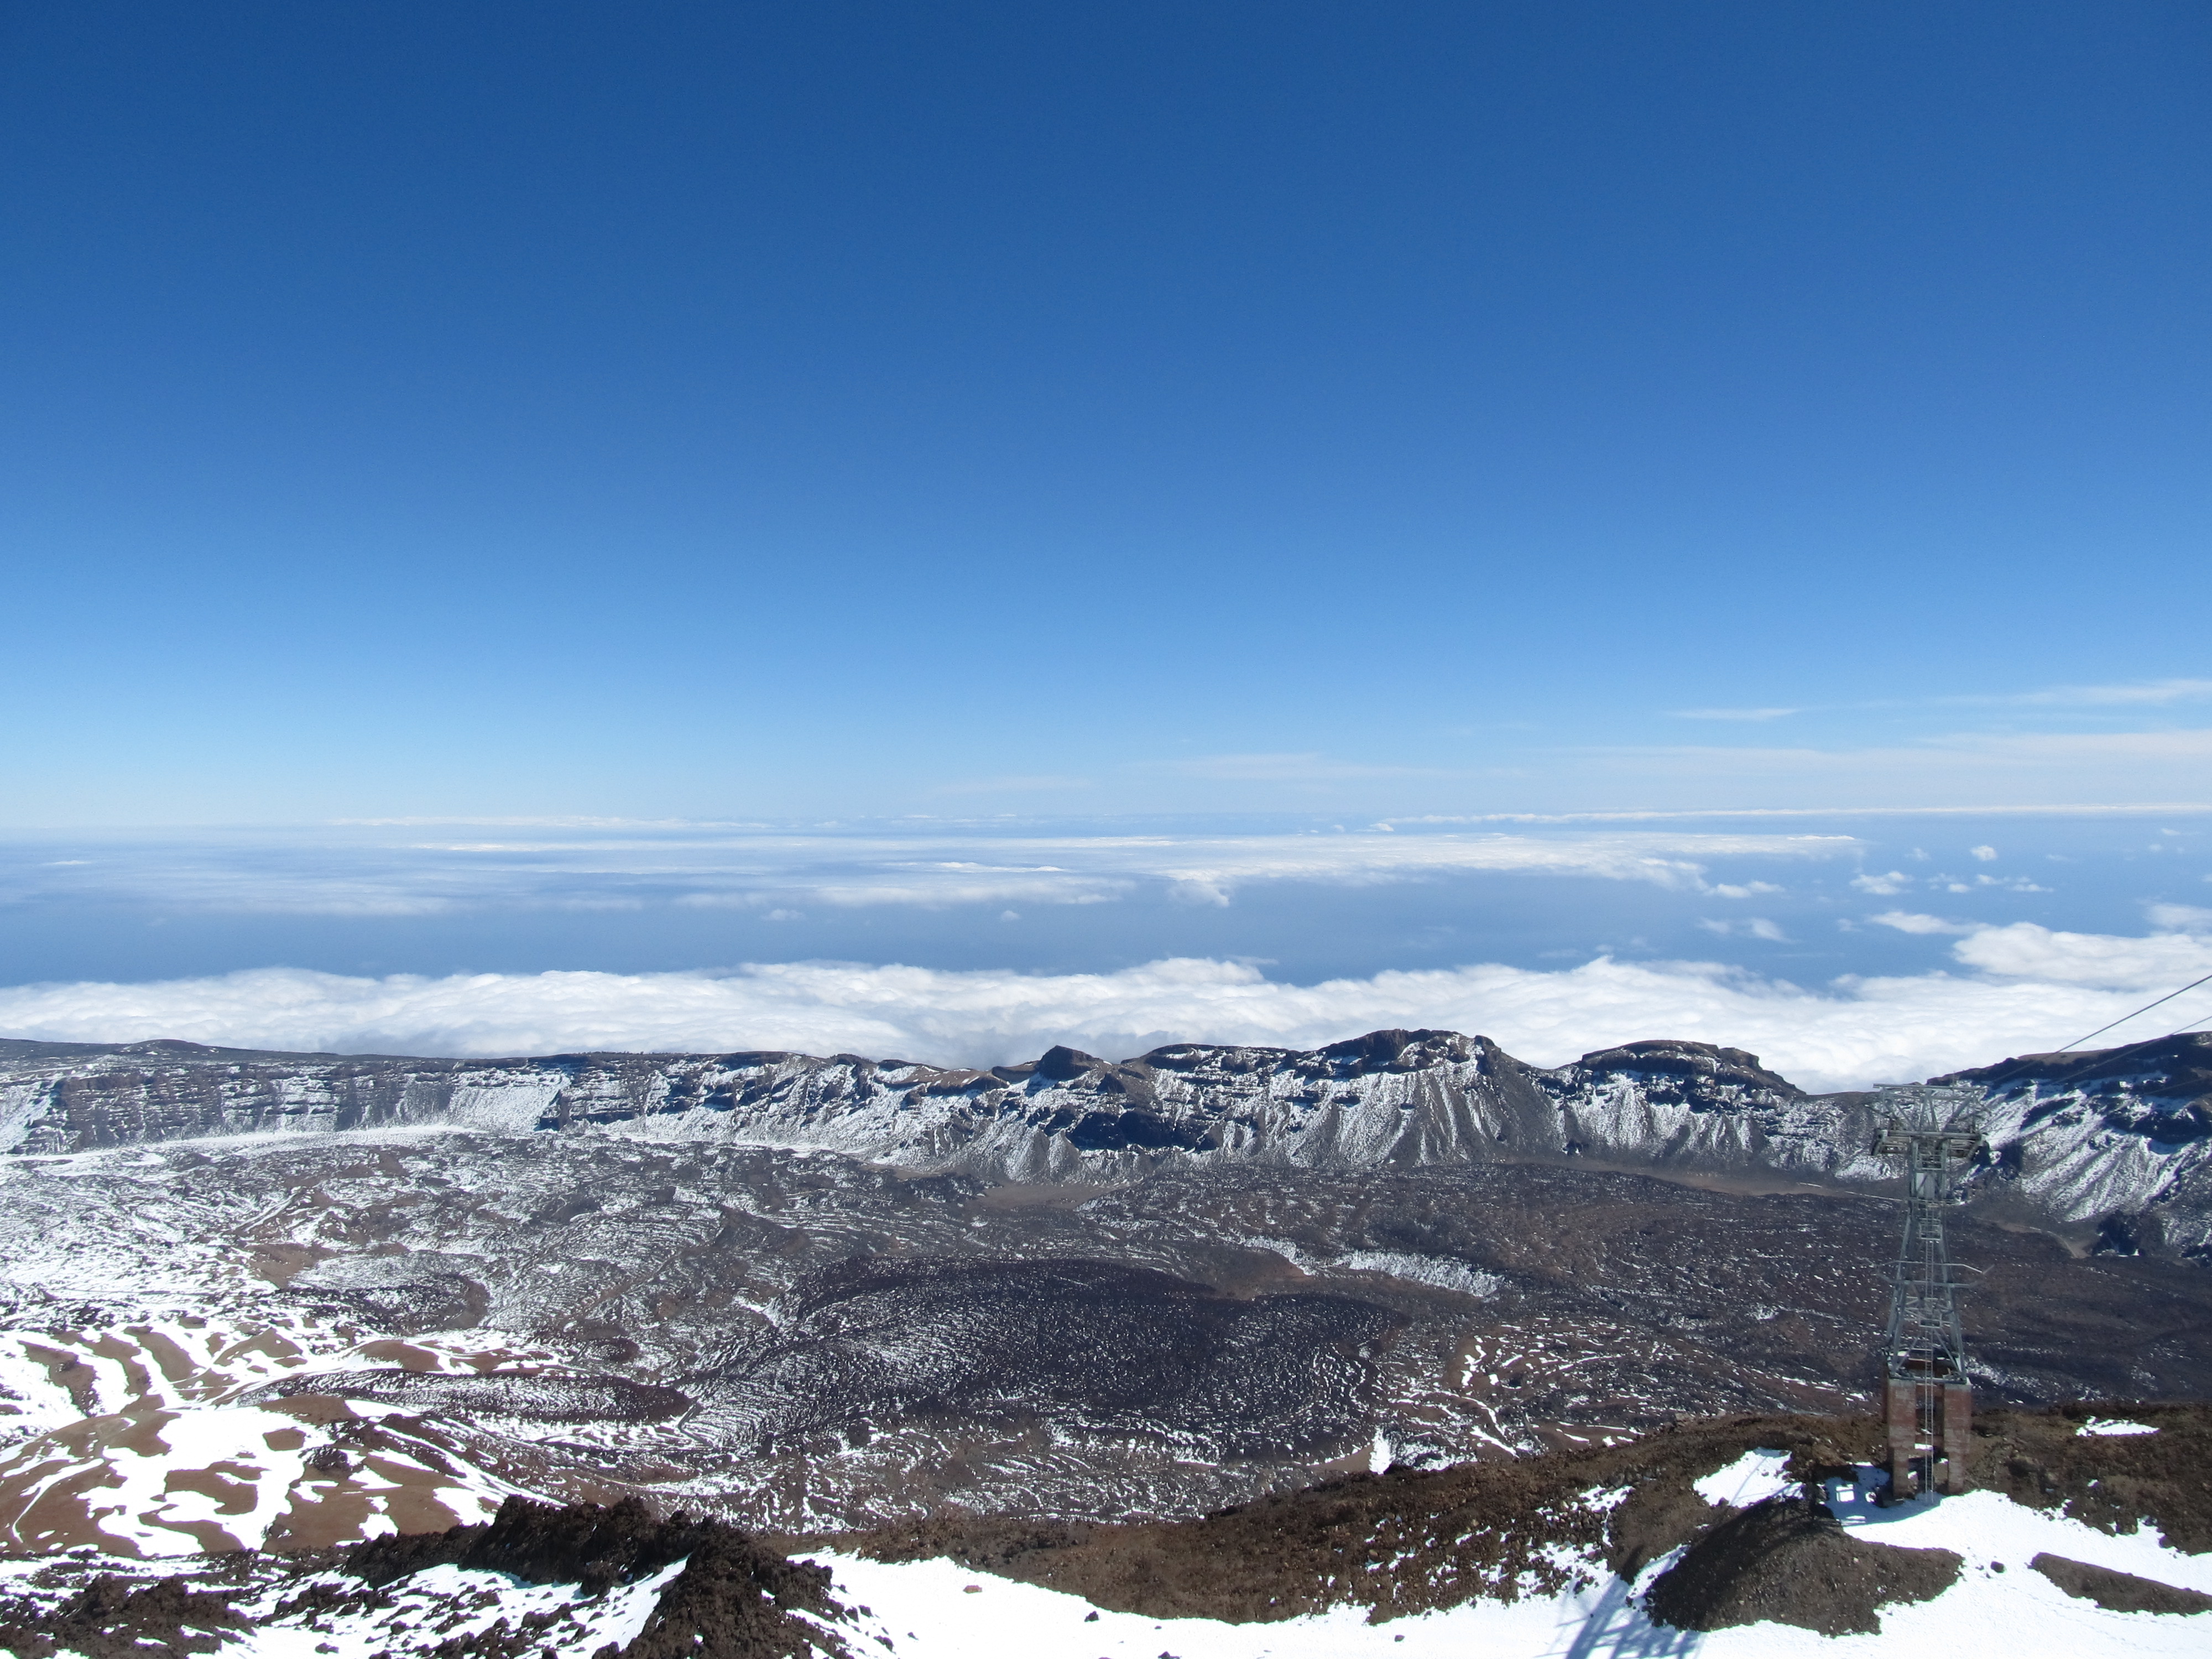
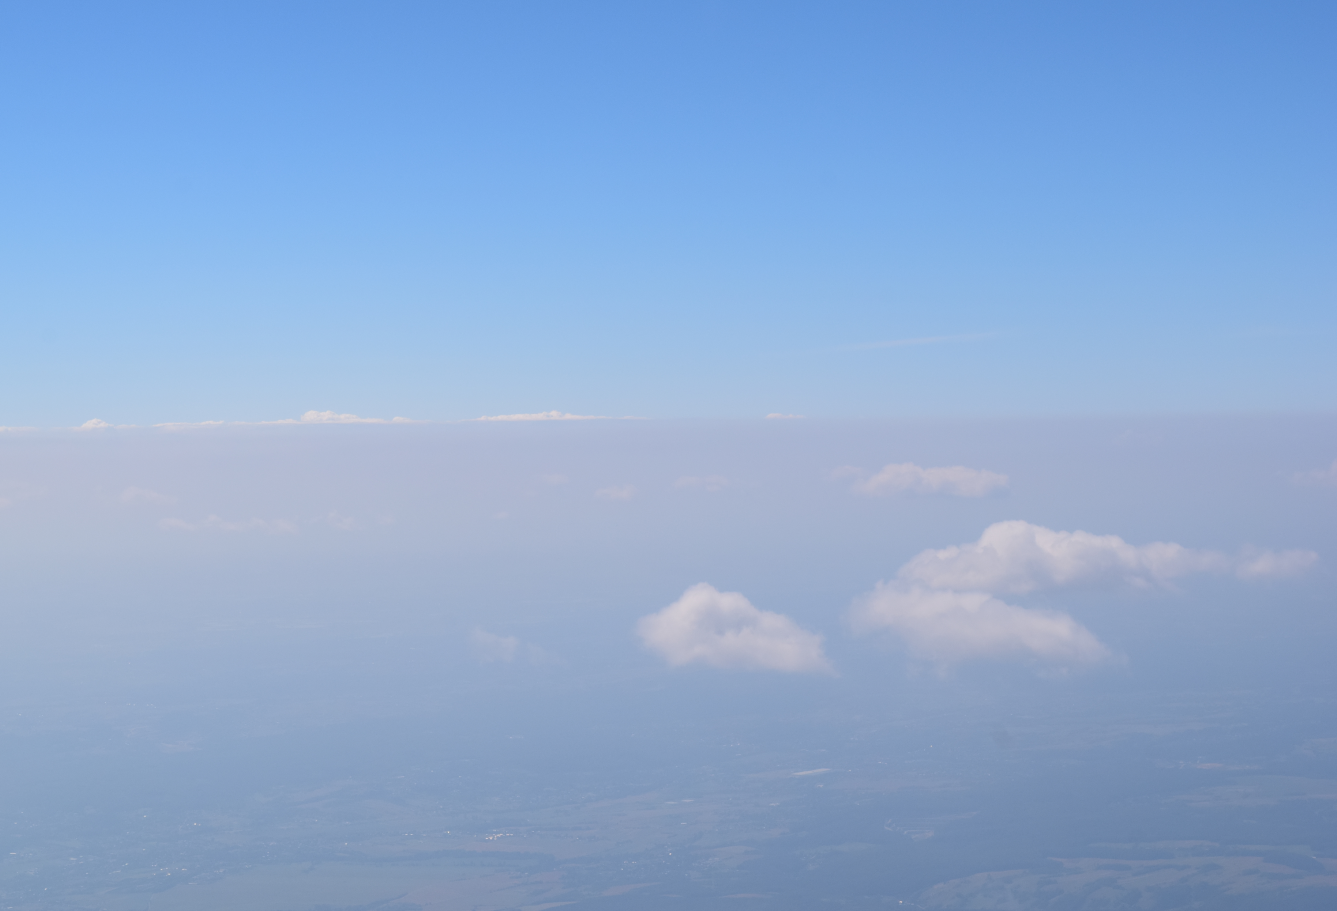
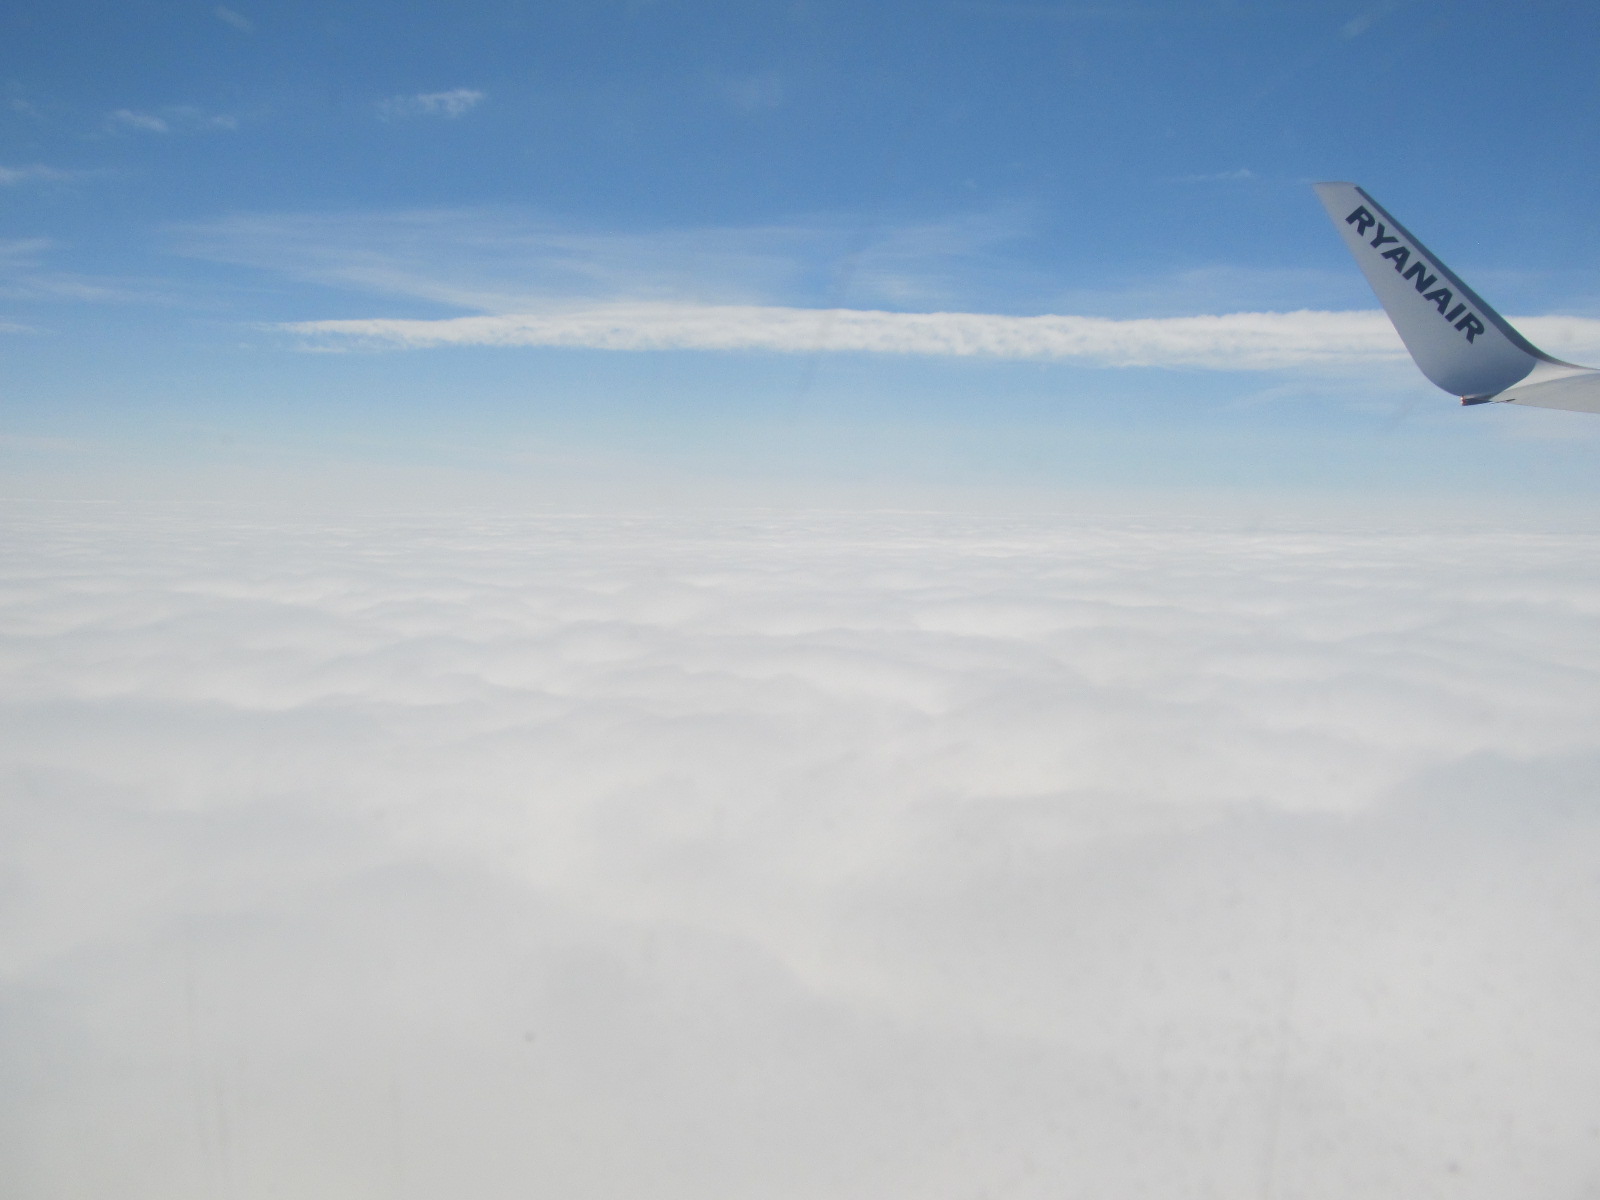
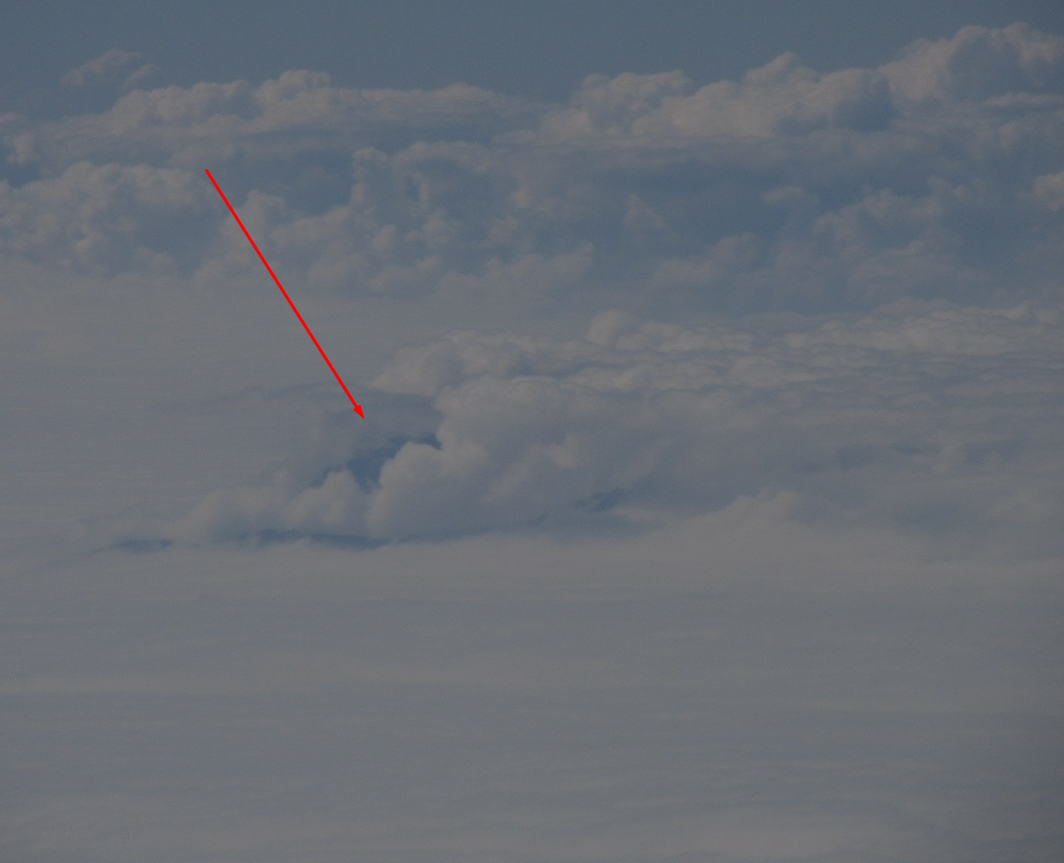
Now let’s consider how it works with haze issues. The planetary boundary layer can be denoted by a thin layer of haze or a cloud deck that can be seen from the plane just after the start and before landing (Pic. 21, 22). This layer or cloud deck can also be seen directly from the surface, especially when a lot of pollutants are trapped inside (Pic. 18) or after sunset when it is not directly illuminated (Pic. 19).
To run down this section I can say, that haze is always bigger within the planetary boundary layer because:
- The air mass movement inside the planetary boundary layer is slower than in the above “free atmosphere” space so the ventilation of the area is also lower,
- The planetary boundary layer gathers the water evaporated into the air from the biosphere, hence the humidity level is higher than in a “free atmosphere”,
- This is the part of the atmosphere, where the temperature inversion layer forms as a stable layer. Due to this a lot of air pollutants and aerosols concentrate there and deteriorate visibility.
- Other meteorological conditions like wind direction. Wind can transport aerosols from different regions featuring another kind of surface, e.g. sand. Other unfavorable weather conditions can be stability stratification
The structure of the planetary boundary layer varies within the season, weather conditions, and time of the day. The depth of this layer is bigger during the night and winter and smaller in the summer and during daytime hours. The biggest haze will occur in the surface layer.
3. RELATION WITH INVERSION
The inversion phenomenon is very important in haze conditions because it traps air pollution, such as smog close to the ground. An inversion can also suppress convection by acting as a “cap”.
An issue with capped inversion has been explained in the section above. In this section, I would like to focus on the inversion layer, which is a subsidence and radiation inversion. There are two common types of temperature inversion, which occur mainly in the surface layer. As we know from the previous section, inversion plays an important role in determining cloud forms, precipitation, and visibility. Both the capping inversion with the subsidence and radiation inversion affect diurnal variation in air temperature. The principal heating of the air is caused by its contact with a land surface that has been heated by the Sun’s radiation. Then this warm air is transferred to the atmosphere by conduction and convection. Once evening approaches (roughly when the Sun is about to set) this proportion changes. The air just above the ground, which was warmer during the day, now becomes colder, because the ground cools off. Heat radiates toward the sky, thus the radiation inversion is produced. The radiation inversion traps moisture and pollution. It results in morning fog or thick smog, depending on where you live.
When the widespread layer of air descends, what happens under a deep high-pressure area, the subsidence inversion develops. The layer is compressed and heated by the resulting increase in atmospheric pressure. If the air mass sinks low enough, the air at higher altitudes becomes warmer, than at lower altitudes; a temperature inversion is produced.
Subsidence inversions are common, especially during the winter. It can also occur on the lee side of a mountain range. This inversion also traps haze and pollutants. Depending on the pressure and weather conditions inside the anticyclone the thickness of the subsidence inversion can vary up to several hundred meters.
4. HAZE IMPACT ON VISIBILITY
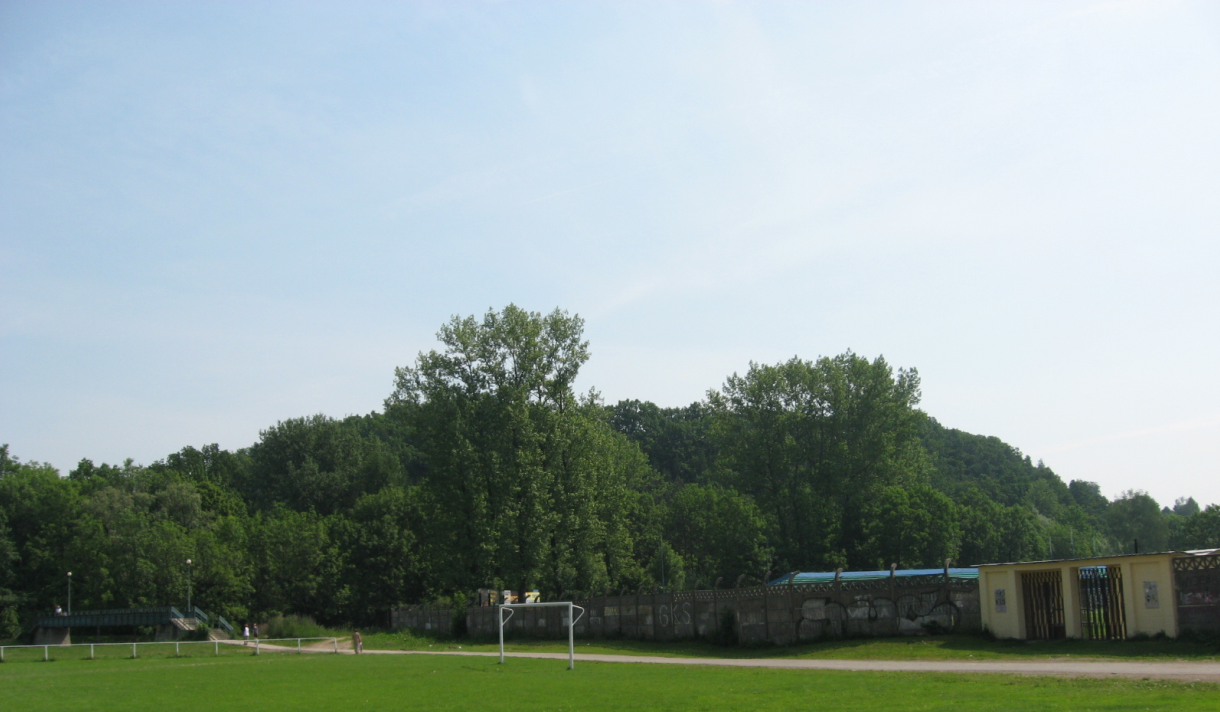
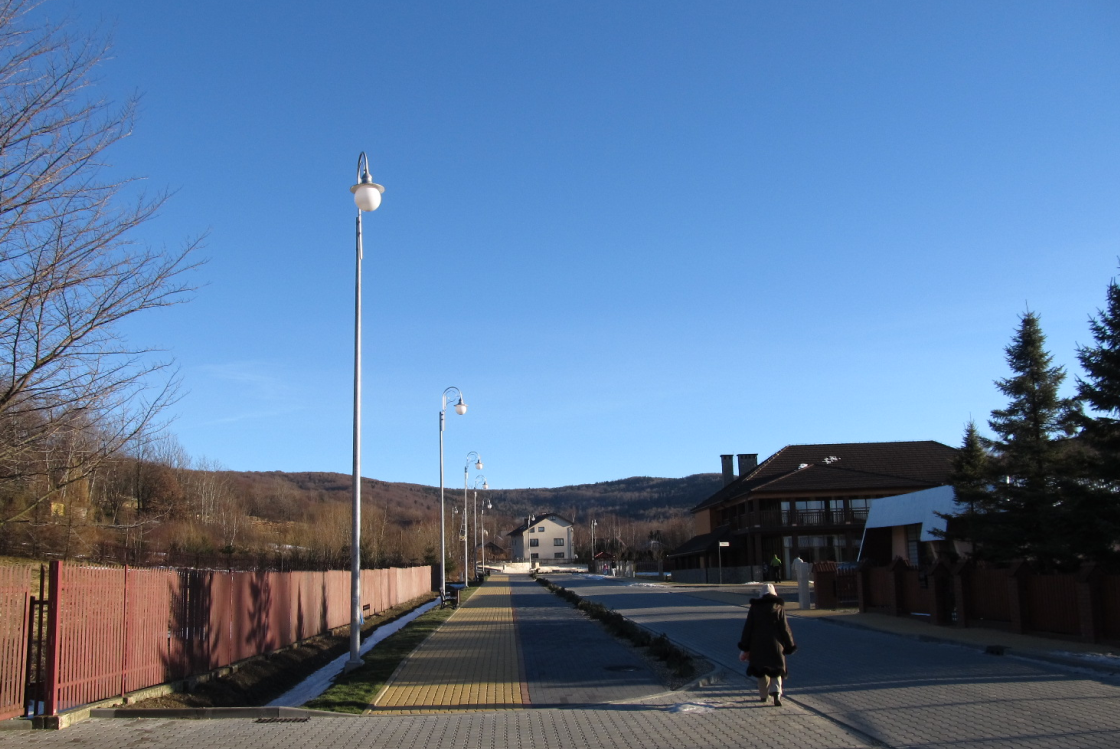
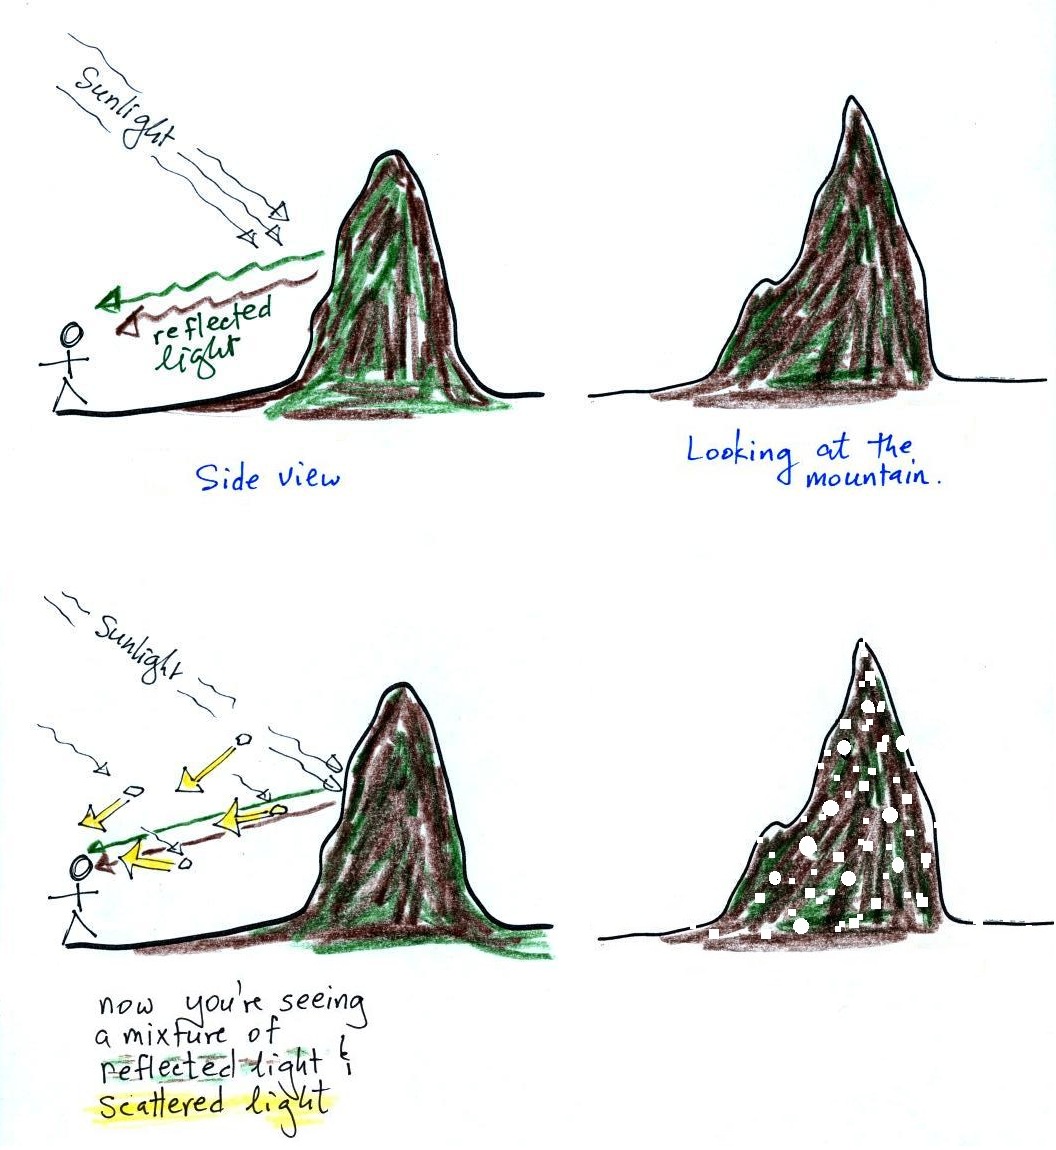
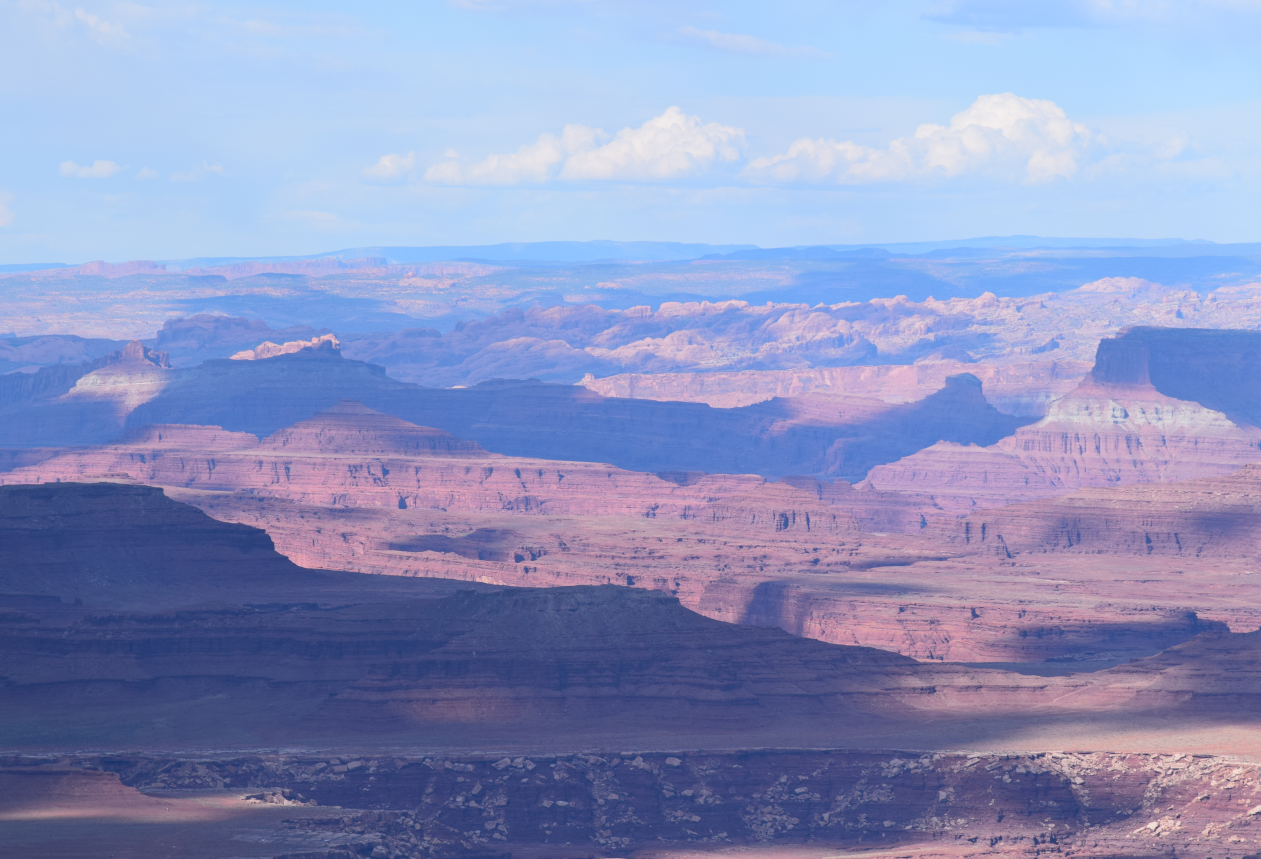
Visibility can be defined as a degree of atmospheric clarity (Malm, 2016). Haze can be treated as a kind of bad weather because it can significantly degrade the visibility of a scene. This phenomenon tends to produce a distinctive gray hue, which affects atmospheric transparency. Optically, this is due to the substantial presence of particles in the atmosphere, that absorb and scatter light (Tan, 2008). Light from the atmosphere and light reflected from an object is absorbed and scattered by these particles, causing the visibility of a scene to be degraded (Pic. 25 – 26).
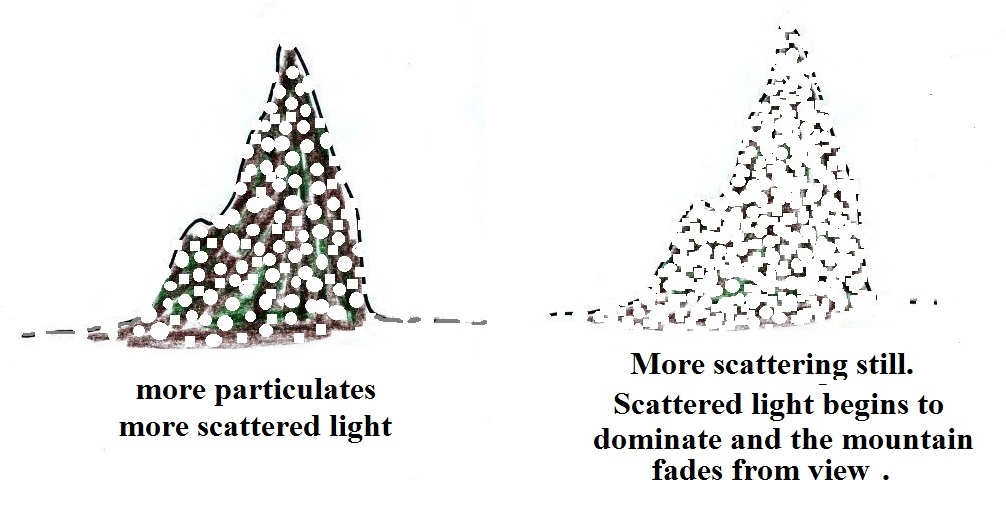
The visibility conditions differ mainly in the types and sizes of the particles involved in their concentration in space (Nayar,Narasimhan, 1999). The manner in which a particle scatters incident light depends on its material properties, shape, and size (Nayar, Narasimhan, 1999). The exact form and intensity of the scattering pattern vary dramatically with particle size (Minnaert, 1954). The extremely high concentration of these small particles can appreciably diminish horizontal visibility. The transparency of the atmosphere increases when the aerosols are removed from the atmosphere. These particles can be removed by two mechanisms: deposition at the Earth’s surface (dry deposition) and incorporation into cloud or rain droplets during the formation of precipitation (wet deposition) (Pandis, Seinfeld, 2016).
The concentration of haze nucleic depends on wind and humidity. More information about this has been shown in the 1st section of this article. Wind disperses and transports the aerosols, whereas the humidity causes a hygroscopic growth of haze particles, especially high near-surface humidity. Another factor for the development of the haze is a dynamic mechanism. The boundary layer is controlled by the descending movement, which suppresses the vertical transportation of the aerosols. Tropospheric aerosols vary widely in concentration and composition over the Earth. This is caused by the non-uniformity of the geographic distribution of particles and the kind of depositions being reliant on the local weather conditions.
As a result, the horizontal visibility in one area can differ from horizontal visibility in another (sometimes even adjacent) region. Haze impact on visibility is weather-dependent. Before the short-term forecast was developed people used to predict the weather by changing the visibility. For instance, before a cold or warm front visibility gets worse unlike after passing the cold front, when it is very good because the descent airflow facilitates to decreasing of aerosol particle concentrations (Marmureanu et al., 2017).
In European conditions, usually polar and arctic air mass brings the best horizontal visibility, unlike tropical masses with a high level of dust or moisture.
In meteorology, visibility is a measure of the distance at which an object or light can be clearly discerned. In extremely clean air the visibility can be more than 320 km (200 miles) where there are large markers such as mountains or high ridges. The visual range is described in the 10-degree scale where 0 means thick fog with visibility lower than 50 m and 9 means extremely good visibility with a distance longer than 50 km.
The Arctic (and Antarctic) air mass is the clearest because it contains the lowest amount of particles coming from the local basement. Hence when there are no products of water vapor condensation this air is almost perfect. The polar continental air mass and arctic maritime air mass is believed to have one of the highest transparency levels due to a lack of anthropogenic factor and dust. Under haze-free atmospheric conditions, the light is scattered on air molecules only. In this case, diffuse sky radiation is restricted only to near-Rayleigh light scattering conditions, where short wavelengths are scattered more than longer ones during the day. It doesn’t mean, that under haze-free weather conditions, our remote horizon will be clearly visible. Always, even on the clearest day, the remote horizon will have a blue appearance. There are basically two reasons for this:
– air-tiny hydrocarbon particles released by vegetation and next chemically react with ozone molecules, scattering a blue light selectively,
– air molecules, which scatter only short wavelengths according to Rayleigh scattering.
Generally, maritime air masses provide better visibility conditions than continental ones, because they are clear. However, these masses provide favorable moisture conditions for the occurrence of a haze event. The worst visibility is observed during the tropical continental air mass advection, where a lot of dust is raised by the wind from the ground. More details about the visual range changes will be provided in forthcoming articles.
5. WEATHER FORECAST
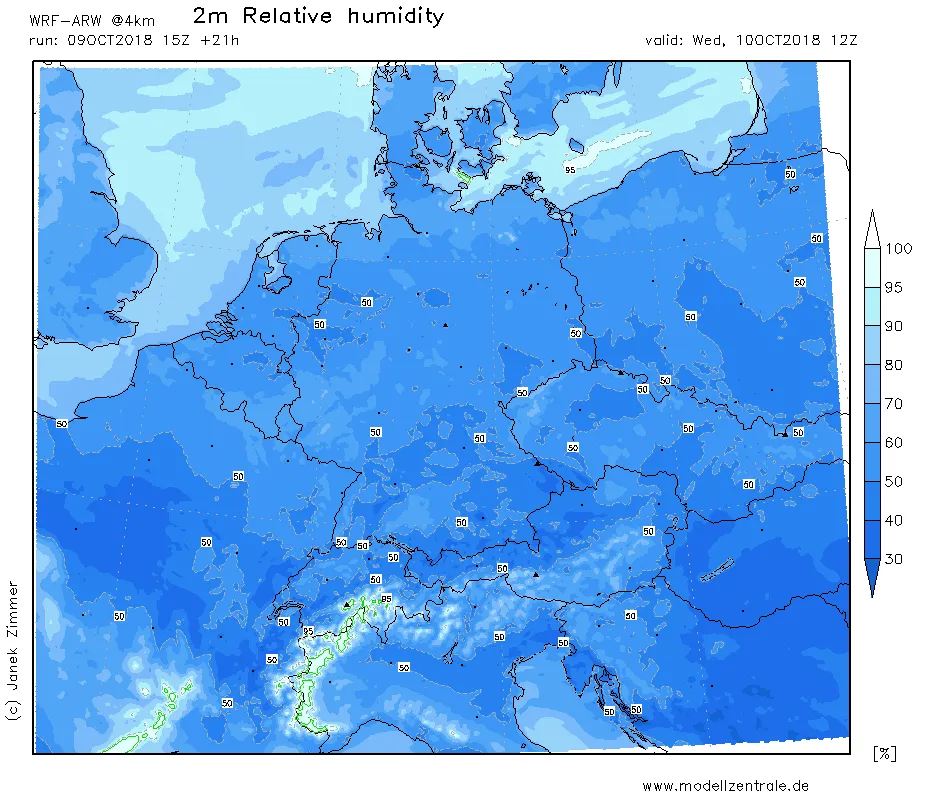
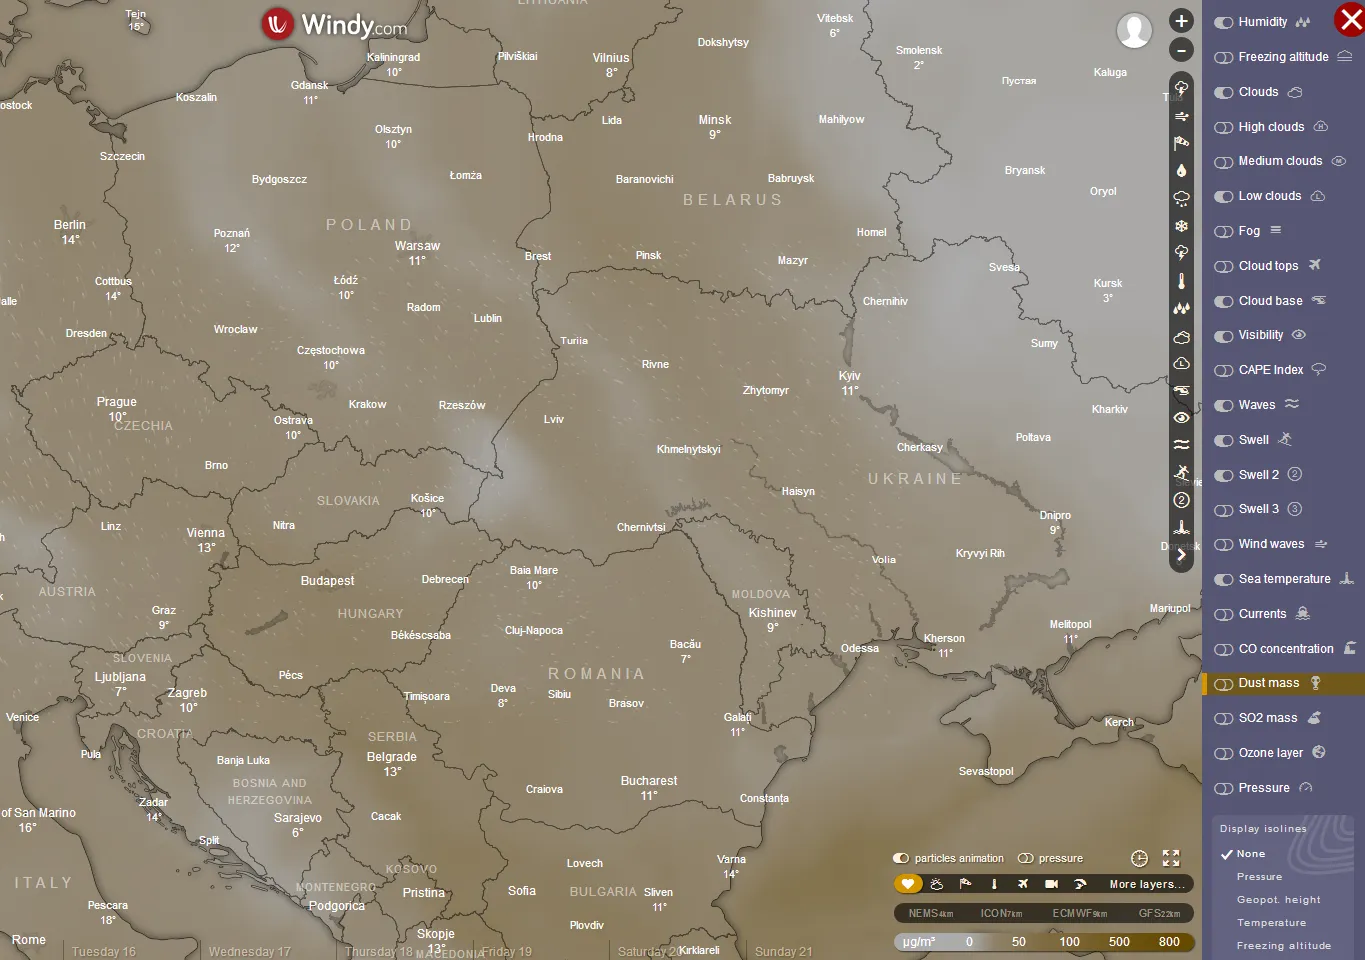
Most weather forecast services do not focus on haze prediction itself. It remains a second-order weather element. The best way is to check the relative humidity or visibility forecast. It should bring a piece of relevant information about the haze density. In terms of the visibility forecast helpful can be a dew point forecast. On the other hand, the air pollution forecast is widely accessible, which has been raised in the previous article.
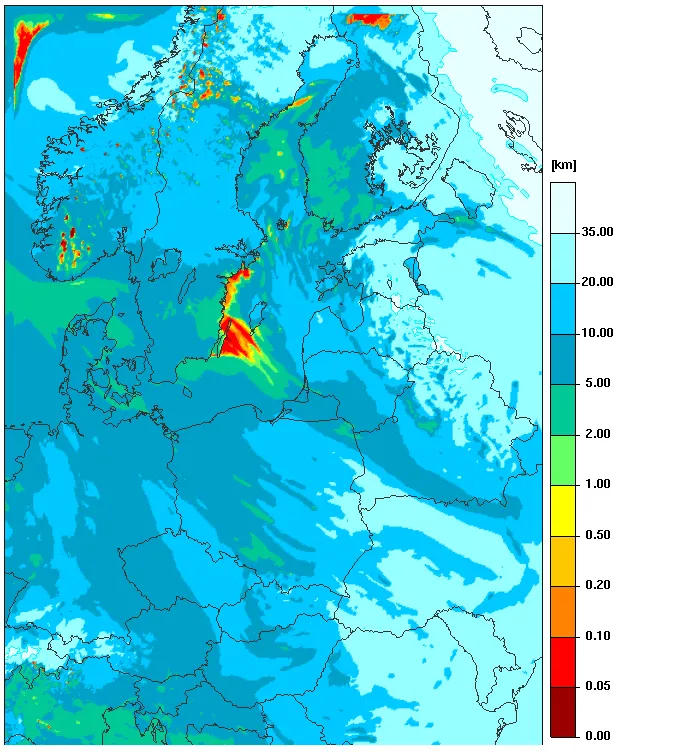
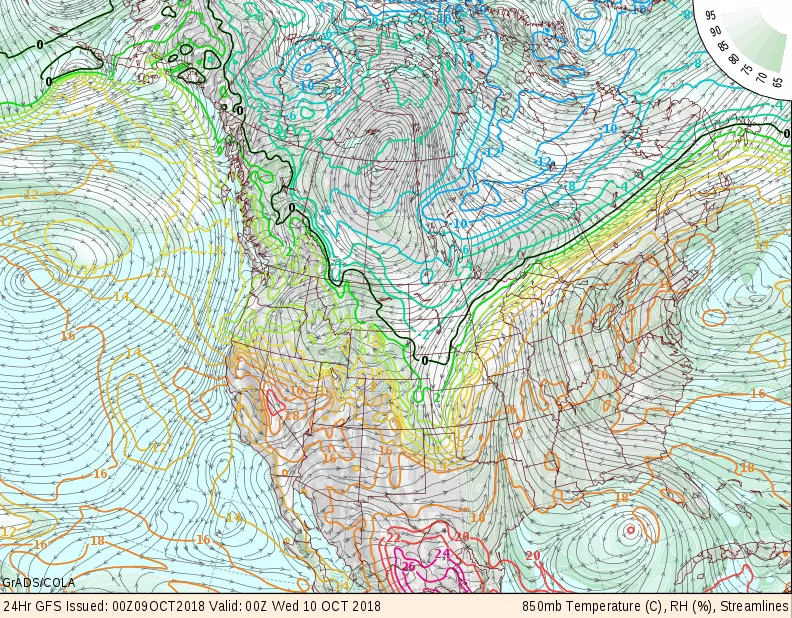
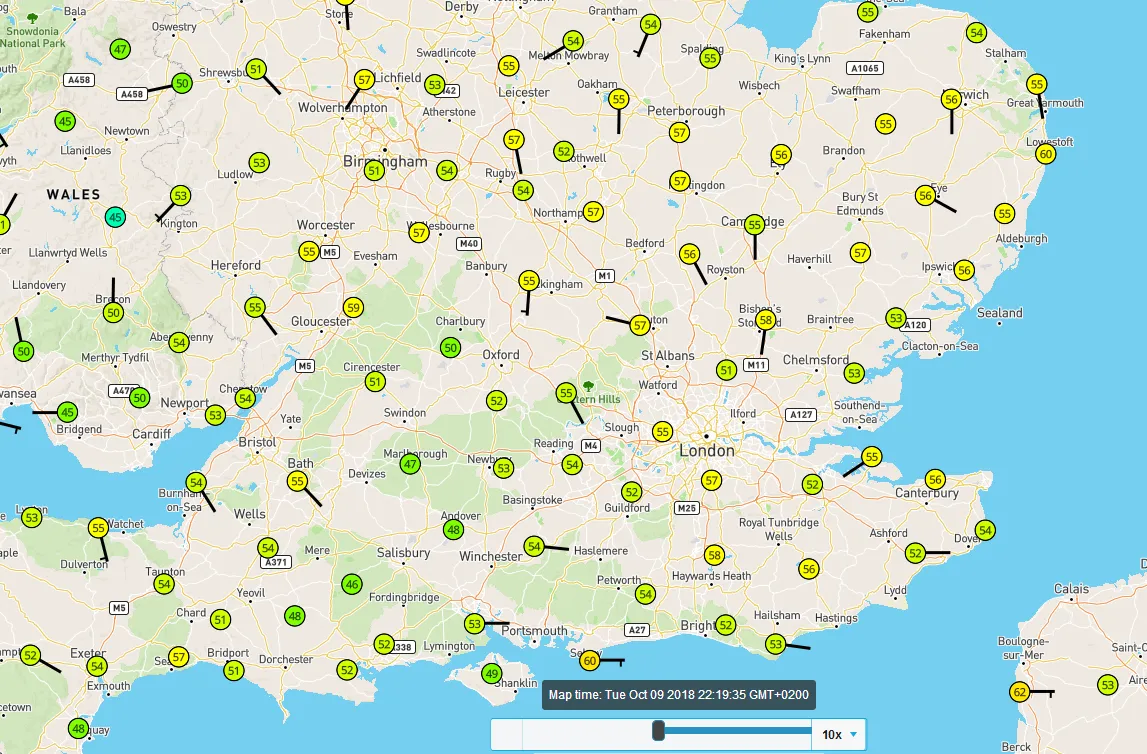
The aforementioned numerical weather patterns show only a general situation in a few countries at once, which can be helpful for planning long-distance observations. There is another way to check the visual range forecast. An example can be seen in the picture below, but I will explain it in the forthcoming article about visibility.
6. CONCLUSIONS
Haze is an important weather factor, that can affect many issues from atmospheric light scattering to impact human health (air pollution). For long-distance photography purposes haze results in the visual effect of a loss of contrast in the subject, due to the effect of light scattering through the haze particles. For these reasons, sunrise and sunset colors appear subdued on hazy days and stars may be obscured at night. In some cases, attenuation by haze is so great that, toward sunset, the sun disappears altogether before reaching the horizon. Big haze concentration deteriorates human health causing the eyes, nose, and lungs afflictions. Air pollution is also a hazard for expecting mothers. Big haze concentration modifies a light scattering in the lower part of the atmosphere making the sky brighter than it really is. The biggest haze concentration is related to the planetary boundary layer (unified haze) within the inversion layer may exist (layered haze). This text provides general knowledge only. There are a lot of things to develop in the next articles.
Mariusz Krukar
References:
1. Ackerman S.A., Knox J. A., 2007, Meteorology: understanding the atmosphere, Thompson higher education, Belmont, CA.
3. Bohren C.F., Huffman D. R., 1983, Absorption and scattering of light by small particles, John Wiley & Sons, Weinheim
4. Hackel H., 2009, Pogoda i klimat, Multico, Warszawa
5. Hinds W. C., 1999, Aerosol technology: properties, behaviour and measurement of airborne particles, John Wiley, New York
6. Horvath H., 1993, Atmospheric light absorption – A review, (in:) Atmospheric environment. Part A. General topics, vol. 27, i.3 p. 293-317
7. Khalizov A.F., et. all, 2009, Enhanced light scattering by carbon soot aerosol internally mixed with sulfuric acid (in:) Journal Physic Chemistry, vol. 111, p. 1066 – 1074
8. Kokhanovsky A.A., 2008, Light absorption and scattering by particles in the atmosphere, Praxis Publishing, Chichester
9. Liou K., N., 2002, An introduction to atmospheric radiation, 2nd edition, Academic, San Diego.
10. Lundgren D.A., Cooper D.W., 1969, Effect of humidity on light-scattering methods of measuring particle concentration, (in:) Journal of the Air Pollution Control Association, p.243-247
11. Malm W., 2016, Visibility: The seeing of near and distant landscape features, Elsevier Science
12. Marmureanu L, et al., 2017, Planetary boundary layer height influence on ground base aerosol concentrations, (in:) The European Aerosol COnference, Zurich 2017
13. Meland B.S., 2011, An investigation into particle shape effects on the light scattering properties of mineral dust aerosol, University of Iowa
14. Minnaert M., 1954, The nature of light and color in the open air, Dover, New York
15. Nayar K. S., Narasimhan G., S., 1999, Computer vision in bad weather (in:) Technical Report, Department of Computer Science, Columbia University, New York
16. Reid E.A., et. all., 2003, Characterization of African dust transported to Puerto Rico by individual particle and size segregated bulk analysis (in:) Journal Geophysics Researches
17. Stull R. B., 1988, An introduction to boundary layer meteorology, Kluwer Academic Publishers, Dordrecht
18. Tan R.T., 2008, Visibility in bad weather from a single image, Imperial College London
Links:
1. Scattering of light – graphs
2. Britannica.com: Planetary-boundary-layer
3. USA: The hazy days conditions. Comparison between non-haze and haze conditions
4. Metoffice.gov.uk: Types of humidity
5. Planetary boundary layer
6. Atmosphere boundary layer structure
7. Britannica: Temperature inversion
8. Radiation_inversions.htm
9. http://www.atmo.arizona.edu/students/courselinks/fall16/atmo170a1s3/1S1P_stuff/scattering_of_light/scattering_of_light.html
Wiki:
- Capping_inversion
- Convective_Boundary_Layer
- Distribution_of_particles
- Equilibrium_level
- Forward_scatter
- Inversion_(meteorology)
- Inversion_temperature
- Lapse_rate
- Particulates
- Planetary_boundary_layer
- Potential_temperature
- Surface_layer
Youtube: