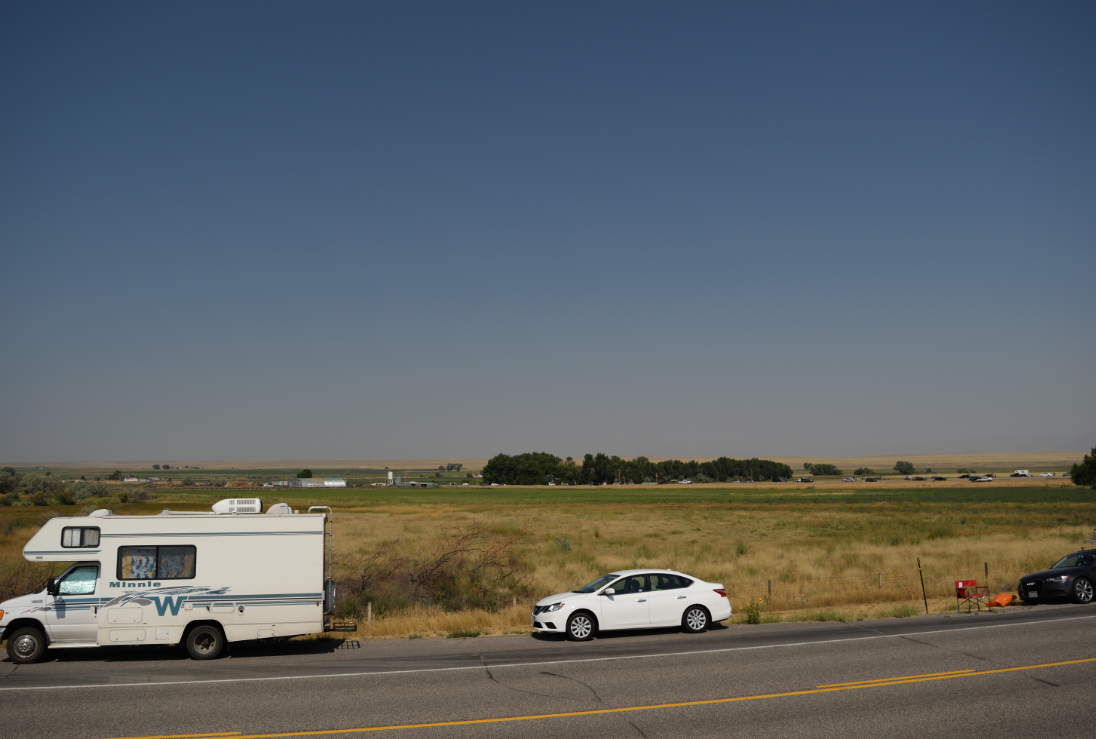
The illuminance level and sky brightness are very important elements of solar eclipse phenomena because both are clearly noticeable by the observer along with his eye adaptation. When the eclipse phase is deep and turning into totality, the light level changes drastically, much quicker than on any other occasion. It makes the solar eclipse one of the most notable phenomena exhibited in the sky.
This article presents some studies about illuminance and sky brightness changes during a solar eclipse. These studies come from various solar eclipses and have been combined with my private measurements taken during the 2017 solar eclipse in Wyoming. I am going to give an answer to how exactly the illumination circumstances change throughout the solar eclipse and what determines them.
- BASIC UNIT OF ILLUMINANCE
The illuminance level during the solar eclipse can be measured with Lux units (Lx). Read more about it in my previous article, where I have shown a basic relationship between the units of light and some ways to measure the light level. Measuring the light level in Lx we can compare our result with the light from the outdoor and indoor recommended light levels given. Moreover, the light level changes during the eclipse allow us to compare them with moments of particular solar distance against the horizon, which determines various levels of illuminance on a daily basis.
2. LIGHT LEVEL MEASUREMENT TOOLS
Light level during the eclipse can be measured with a Lux Meter. This typical equipment allows us to record the illuminance changes in Lux units. Some observers like Wolfgang Strickling in his solar eclipse measurements use the TSL230 programmable light-to-frequency converter. This instrument converts light intensity to a frequency both day and night. The accuracy of this instrument can balance +- 20%. Aside from the professional instruments, the light level can be measured in an amateur way by using mobile apps. This option is good only for orientation with light level changes and weather factors making them. Usually, the deviation of mobile phone measurements makes too big a discrepancy between a real light level value and the value given. I described more about light level measurement tools in this article.
I am an astronomer amateur and my measurements were also amateur despite I was trying to make my eclipse observation as professional as possible. Nevertheless, without decent instruments, I cannot assure, you that my results are reliable enough. On the other side, I did everything to record how the light level behaves during the eclipse and I am pretty sure, that all factors during my amateur measurements have been covered correctly.
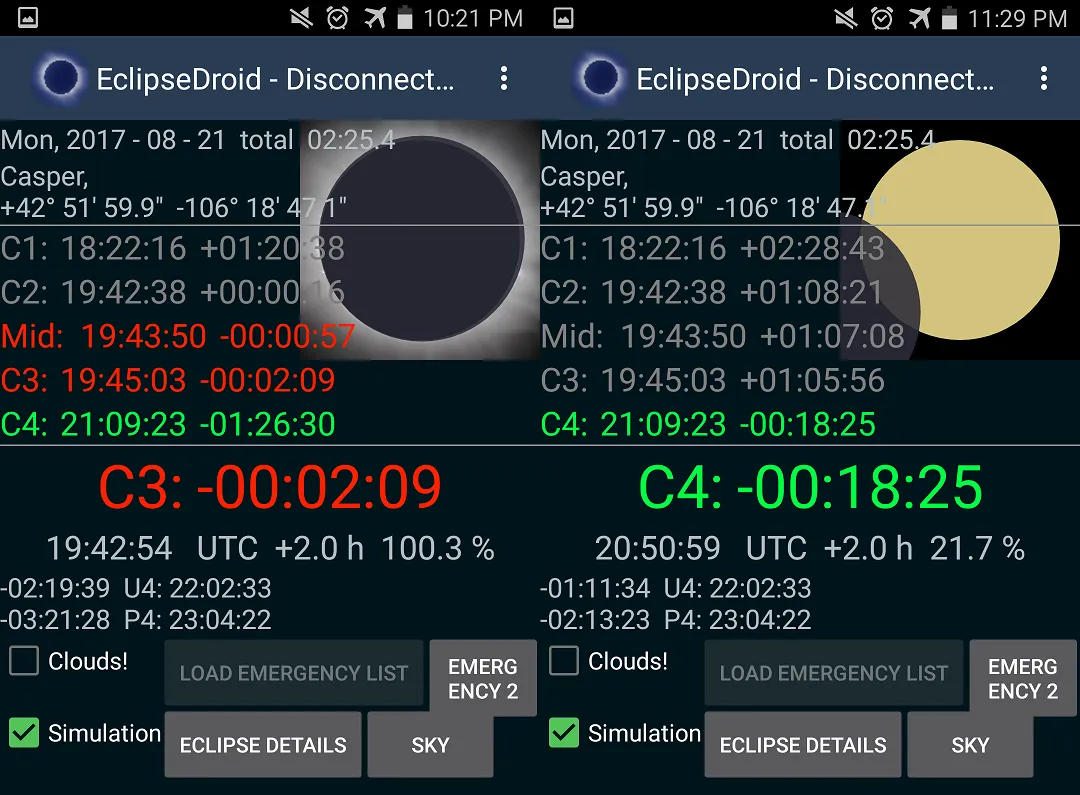
For the purpose of light level measurements, I used the Eclipse Droid – Wolfgang’s Strickling Android app (Pic. 1, 2), which perfectly fit these purposes. The interface of this astronomic app is very friendly. It computes your local circumstances for solar eclipses in a wide time range throughout XXI st century. The app itself is multifunctional. The details of the Eclipse Droid can be found here. For my purposes, I used the eclipse real-time simulation and the Lux Meter built-in, which in conjunction with MS Word for Android could record a detailed log regardless of the time frame. Eventually, I got several hundreds of pages of the light level log from the Great American Eclipse.

3. THE MEASUREMENT METHODS AND FOREGOING LIGHT LEVEL MEASUREMENTS
The illuminance level during the solar eclipse is one of the elements comprising on whole atmosphere response phenomena during the solar eclipse. There are at least a few studies, where the light level measurements were conducted. In terms of the illuminance level during the eclipse also solar radiation is a typical element to study. I will focus on methods of illumination level during the solar eclipse, which I made as an amateur during the Great American Eclipse.
Before I do this I would like to bring some information about another light level measurement taken during the solar eclipse.
The study about the light level changes during the eclipse must be associated with important assumptions, where the Sun and Moon are perfect spheres and the effects of sunspots and prominences are neglected (Lee, 2012).
Some authors took into account the influence of aerosol in the atmosphere, where a standard aerosol model was assumed (Shettle, 1989)(Emde, Mayer, 2007).
A model for solar illuminance can be considered in the following cases (Lee, 2012):
– Partial solar eclipse with solar center uncovered, where the limb darkening impact is the lowest. The right edge of the Sun is obscured but the brightest center is still present. The light level doesn’t drop rapidly.
– Partial solar eclipse with solar center covered where the limb darkening plays a leading role in illuminance level changes. Its contribution increases evenly with obscuration.
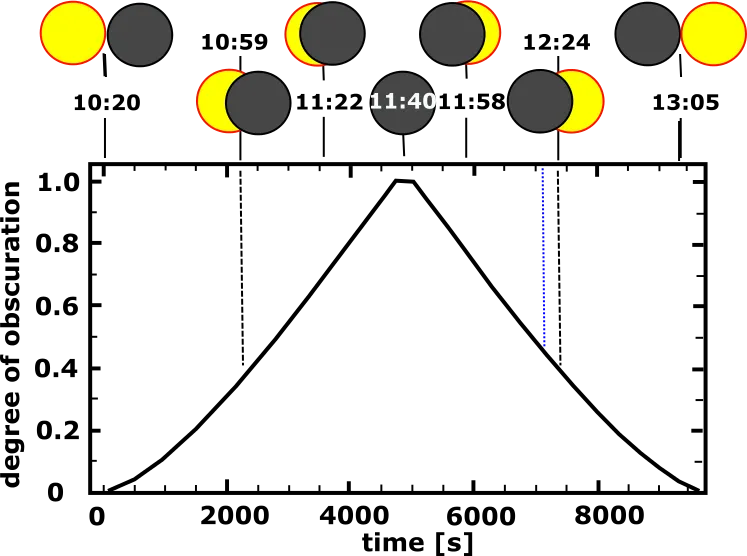
Basically, the solar eclipse measurements can be divided into three time intervals; during the first one, the Moon starts to cover the Sun; during the second one the Sun is completely hidden behind the Moon, and finally, during the third one, the Moon gradually uncovers the Sun (Lee, 2012).
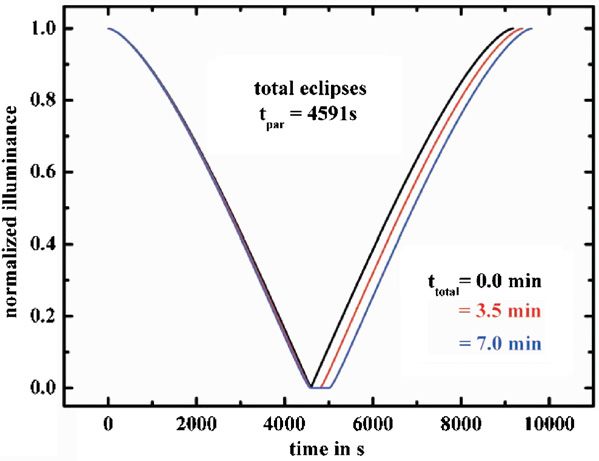
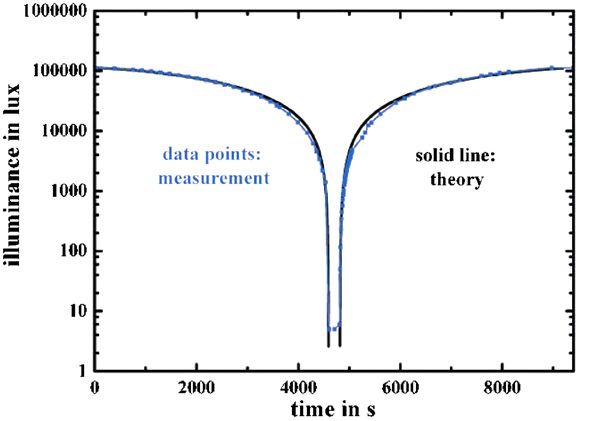
All publications and amateur light level change measurements during the solar eclipse have been focused on solar direction only. Analyzing these measurements depicted on charts we can see the more or less symmetrical shape of illumination changes (Pic.3). This gully-looking shape refers to the whole eclipse phenomena and is presented on a logarithmic scale. It refers to all light level measurements carried out around mid-daytime hours, another can look slightly different due to the solar position above the horizon throughout the eclipse window. These observation models can slightly differ from each other because in some of them, the limb darkening has been omitted and the Sun’s disk was assumed to have homogeneous luminosity (Mollman, Vollmer, 2006)(Pic. 6). In other cases, the Sun was hidden by clouds making a different observation chart in the result.
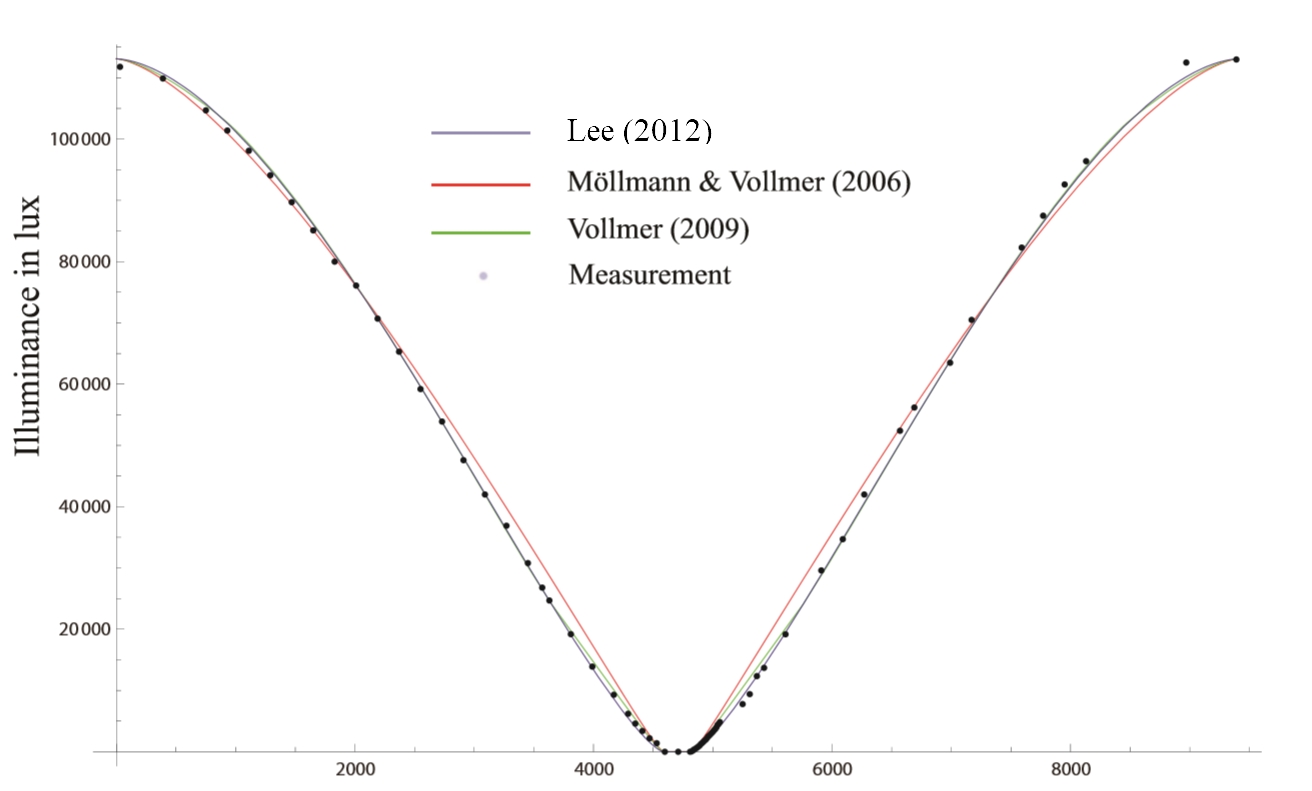
The illuminance level of direct sunlight varies strongly, depending on the optical properties of air mass and possible cloudiness. Therefore the theoretical line of illumination changes usually differs from real measurements taken on-site (Pic. 5). Sometimes the illuminance given by direct sunlight can reach about 70000 Lx only (which is a typical lower limit for zenithal Sun), whereas outside of the atmosphere it can be even 140000 Lx (Mollmann, Vollmer, 2006).
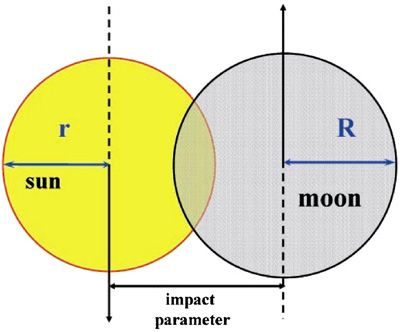
In general, the illuminance level is proportional to the unobscured area of the disk of the Sun (Pic. 6) (Mollmann, Vollmer, 2006). However, it happens theoretically only, because as we know from above, an important factor is limb darkening, which modifies this assumption slightly.
The issues above have been raised in terms of the direct sunlight illumination measurements towards the Sun only.
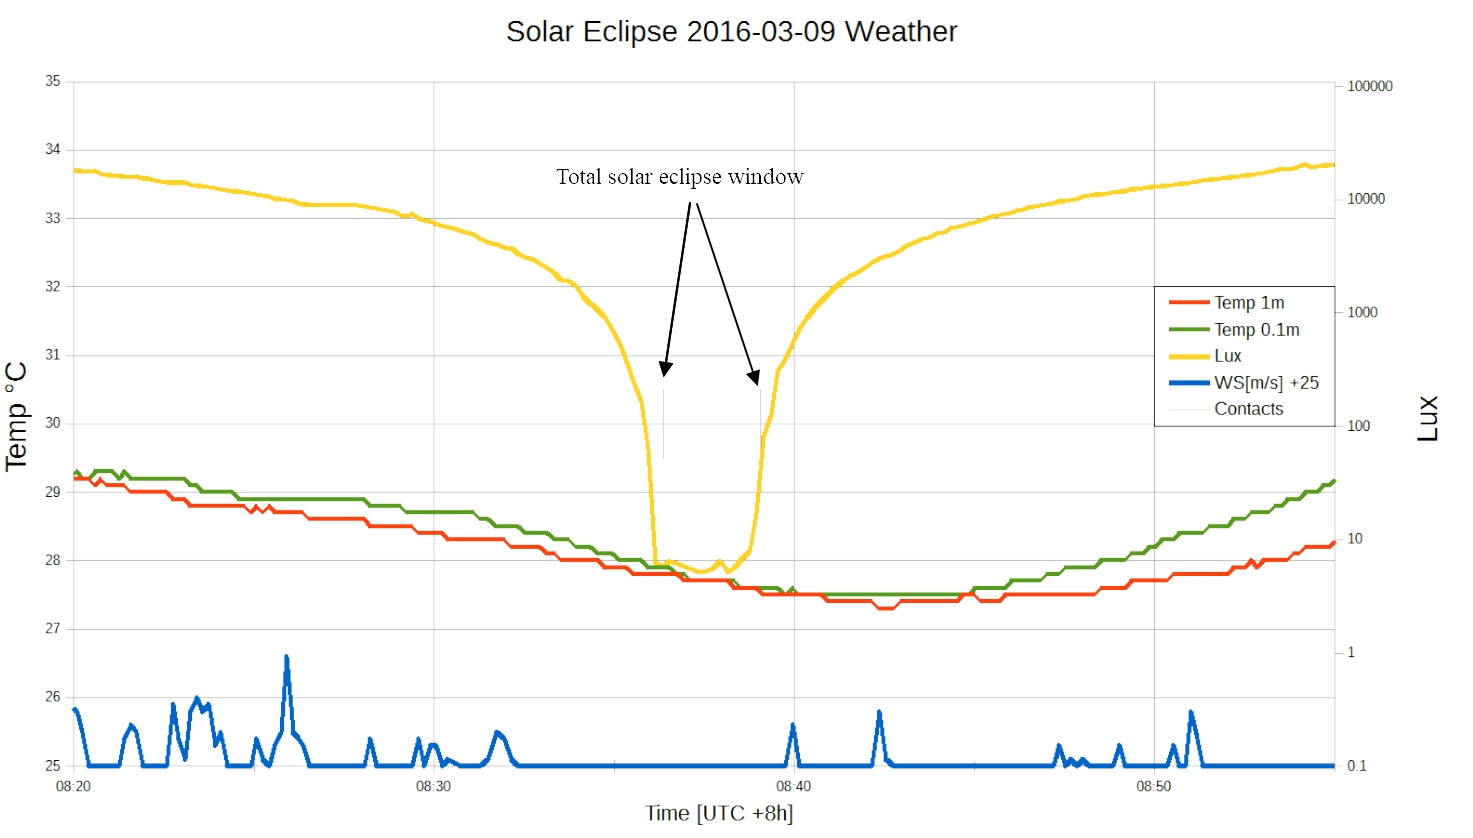
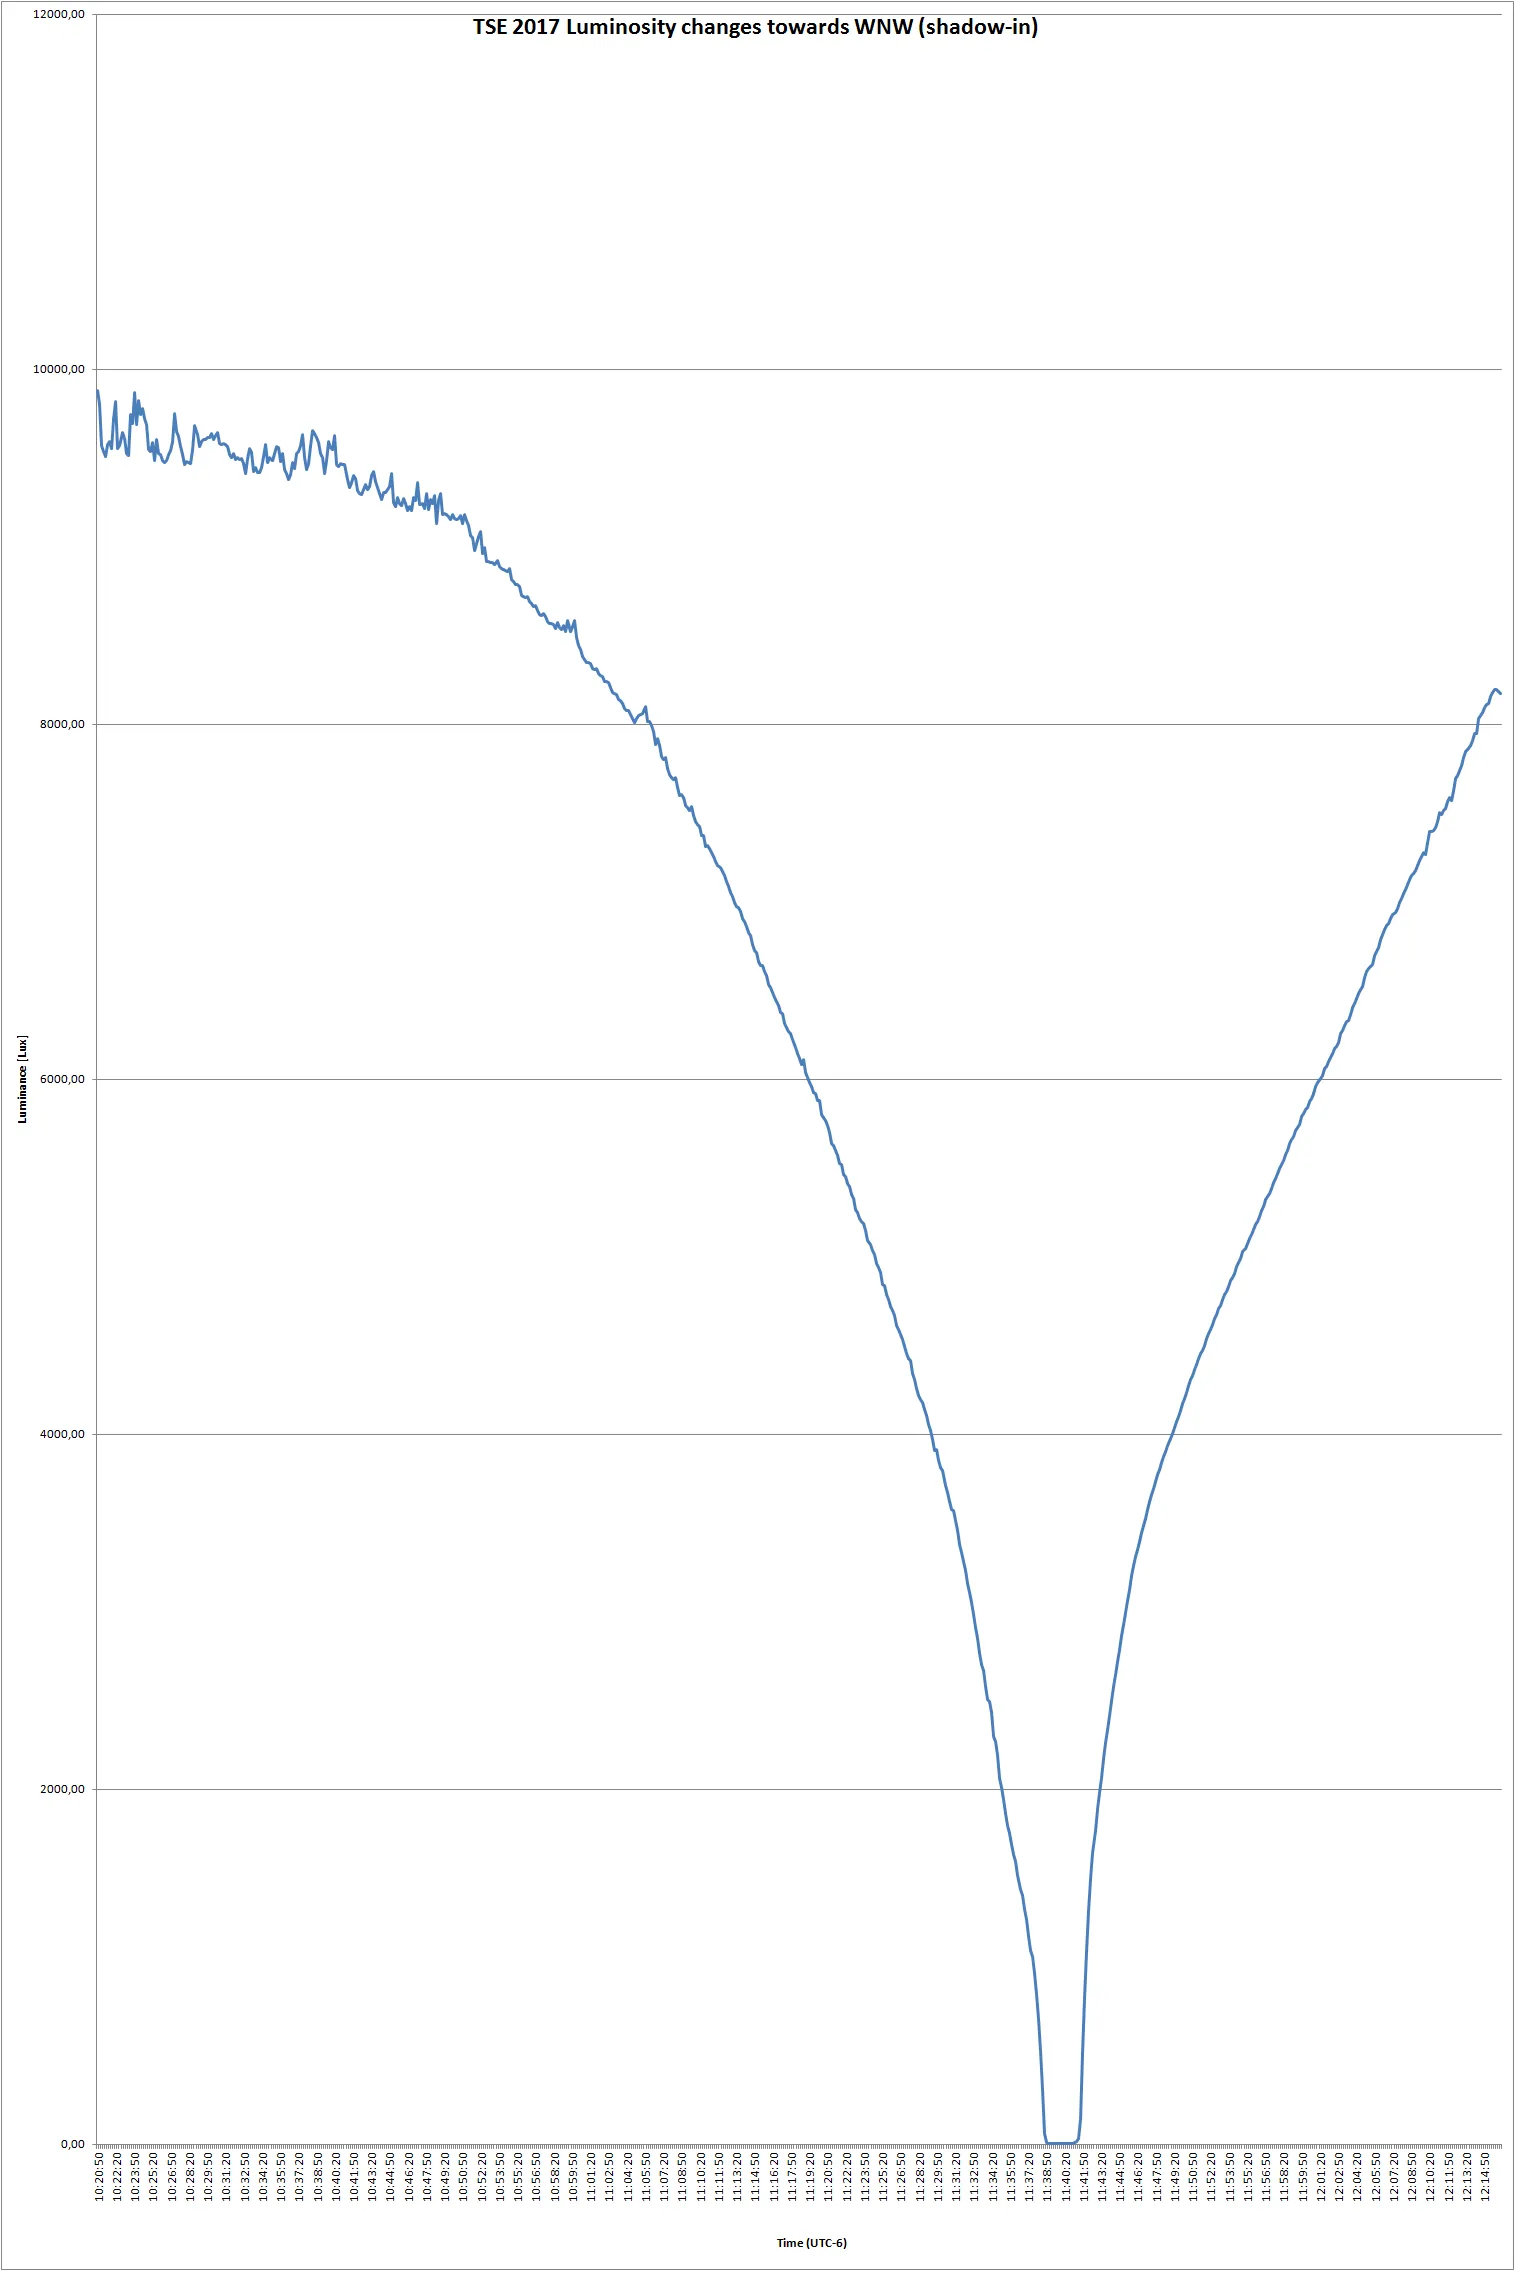
There are no illuminance measurements taken in another direction than solar. Only in Wolfgang Strickling’s light measurement chart from Indonesia, I can guess that he set his instrument towards the shadow-in direction (Pic. 7).
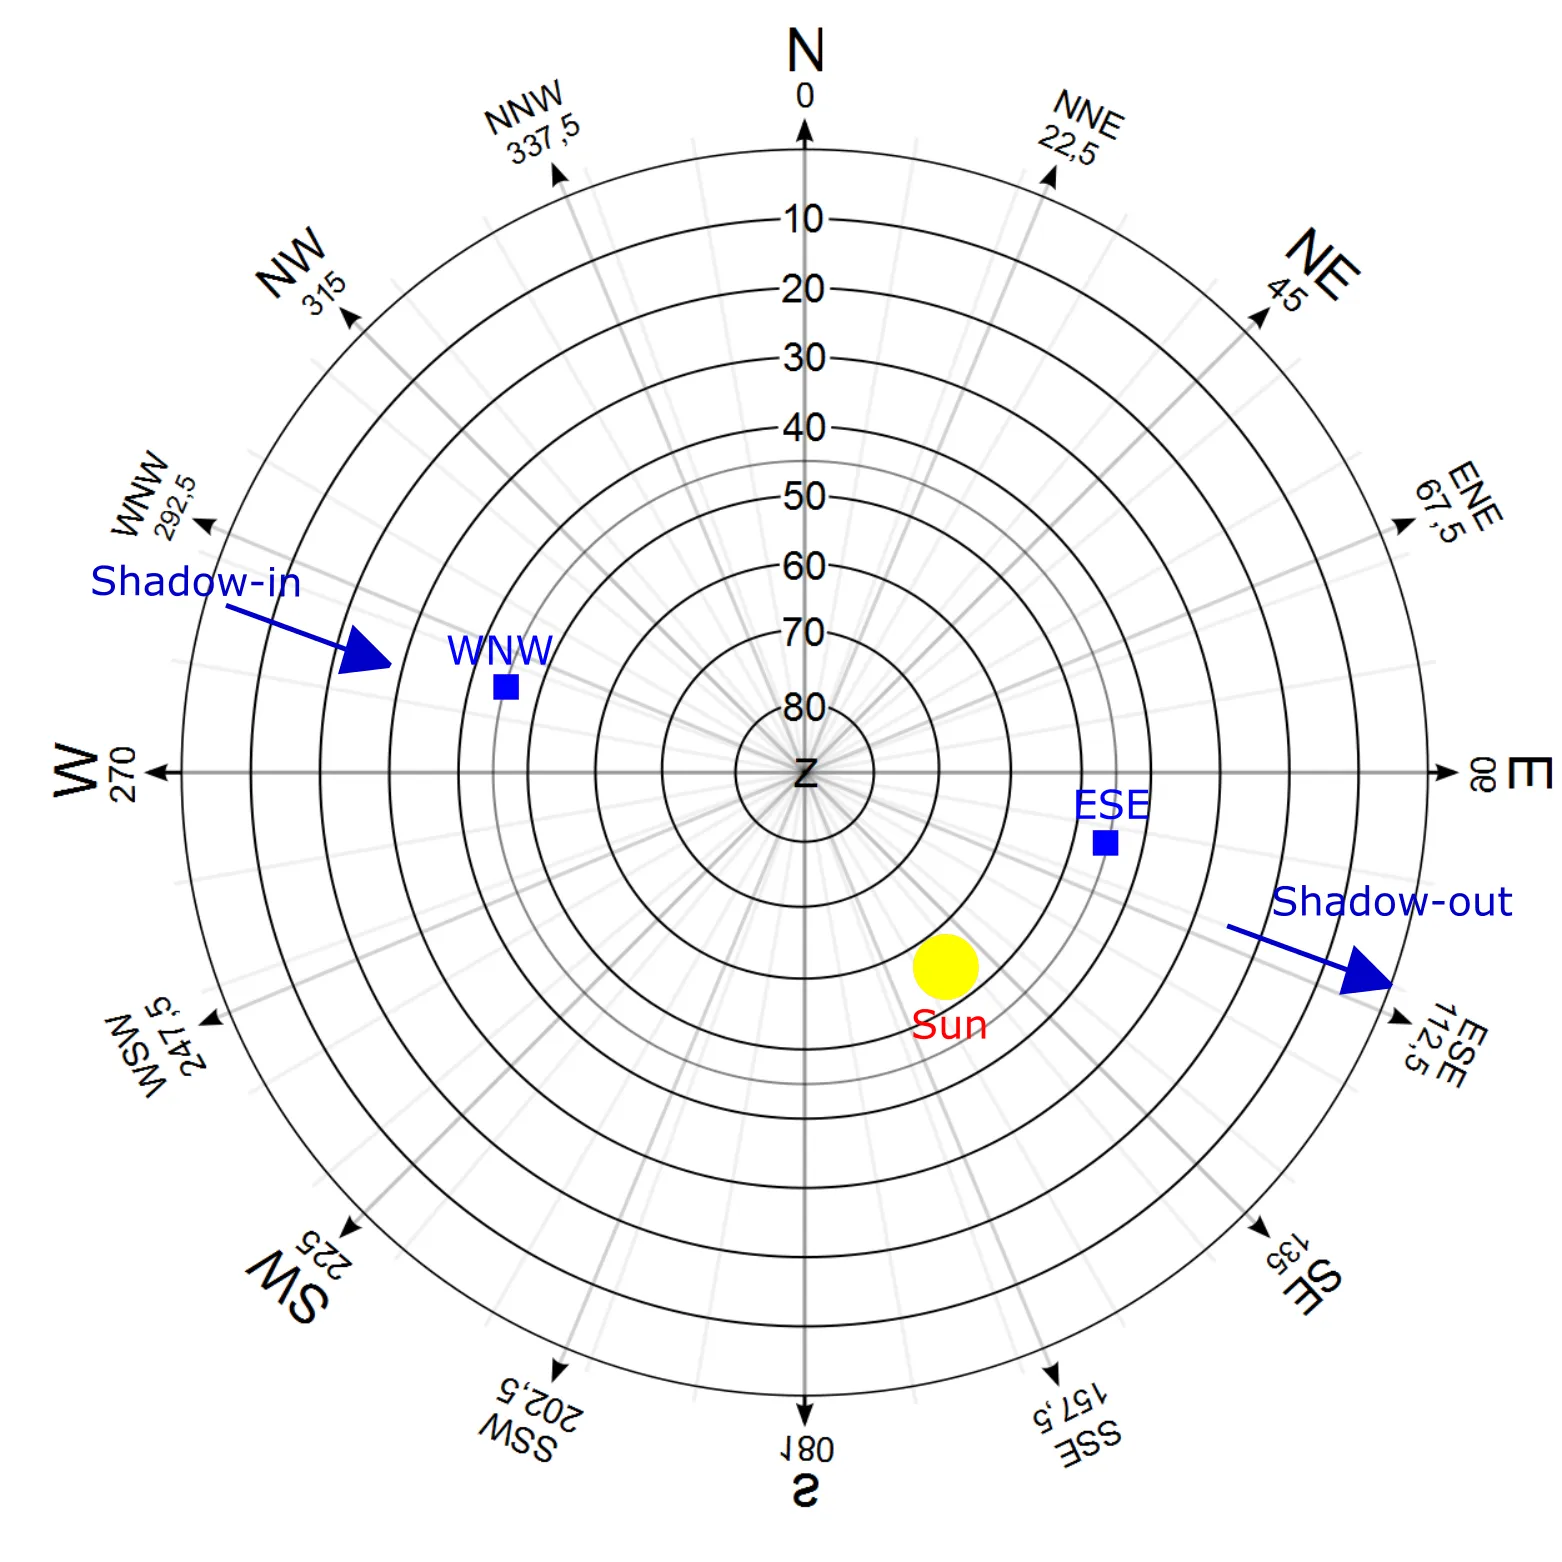
Making an observation of illuminance levels outside of the solar direction was my basic goal during the 2017 Great American Eclipse. I set my smartphones in 2 directions bearing them at around 45 deg angle (Pic. 8).
– WNW, from where the umbra was approaching (shadow-in). It was a view nearly onto an antisolar point with initially one of the darkest sections of the sky.
– ESE, opposite direction, where umbra receded (shadow-out). This direction was less than 90 degrees angular distance to the Sun with one of the brightest sections of the sky.
My measurements were carried out from 1st contact to around 50% obscuration during 2nd partial phase (Pic. 9).
4. ILLUMINANCE MEASUREMENTS DURING THE SOLAR ECLIPSE
As I mentioned above I recorded the light level changes in 2 non-solar directions: shadow-in and shadow-out (Pic. 8). These directions are very important when both total or deep partial solar eclipse occur. Then we can observe the darkening sky in the shadow-in or shadow-out direction (or path of totality direction when a partial eclipse only occurs).
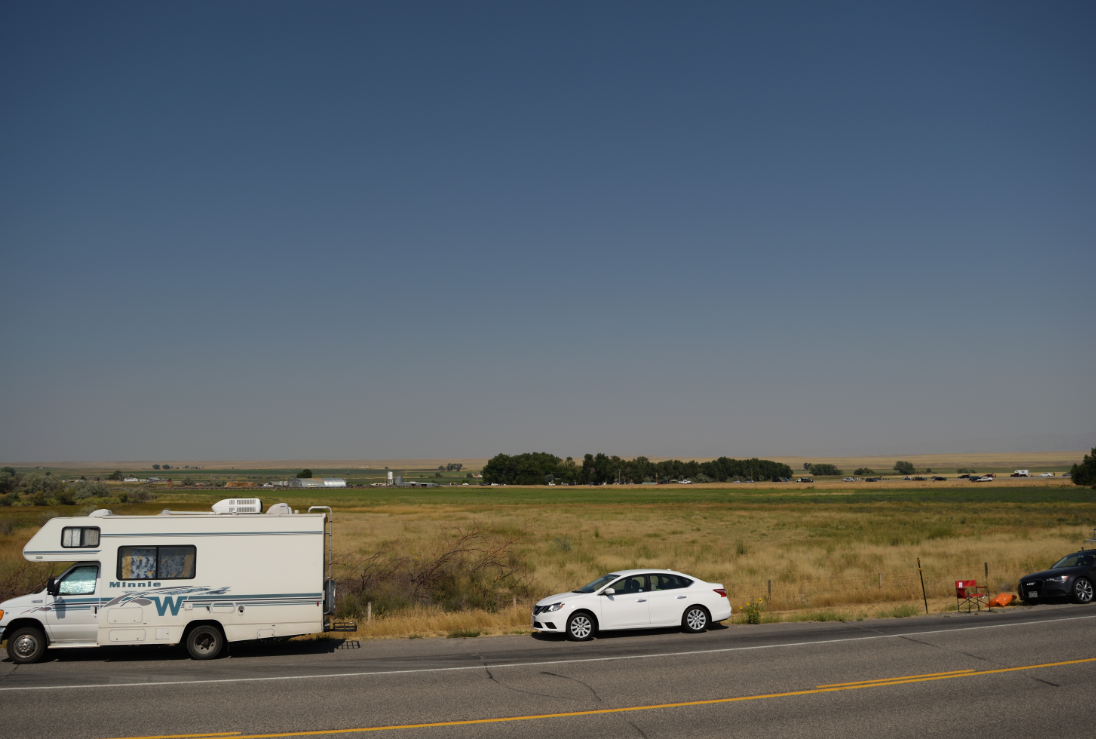
Shadow in direction – the WNW section of the sky was initially one of the darkest parts of the sky due to the long angular distance to the Sun (read more here). Despite a high haze level on the eclipse day, the north-western sky was navy blue with around 9500 Lx initial value given. There were patchy cirrostratus clouds in this section of the sky lifting up the illuminance level locally (Pic. 10).
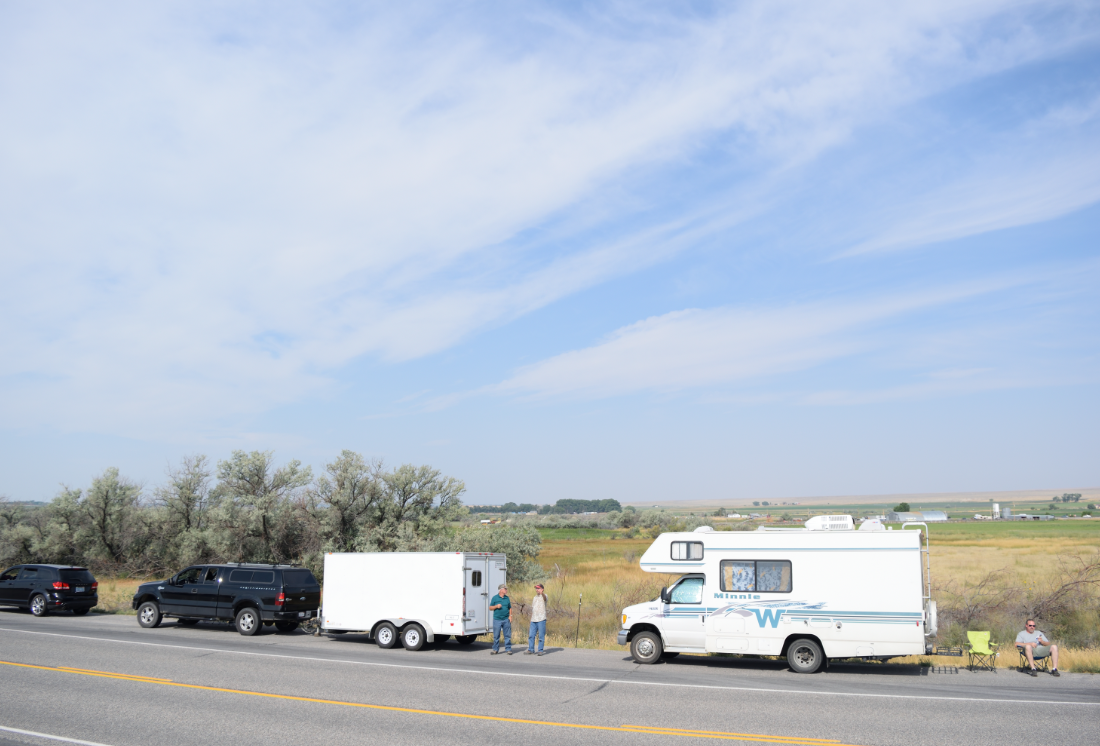
This is normal, when a non-cohesive light scattering plays a role in the atmosphere, as detailed in this article. Anyway, these clouds interfered with around 1/3 of the partial phase, which shows a jagged line on the chart (Pic. 11,12).

As the Moon started to cover more and more of the solar disk these clouds moved southwards giving a completely clear blue sky (at least within the measurement frame) around 45 min after 1st contact (Pic. 14).
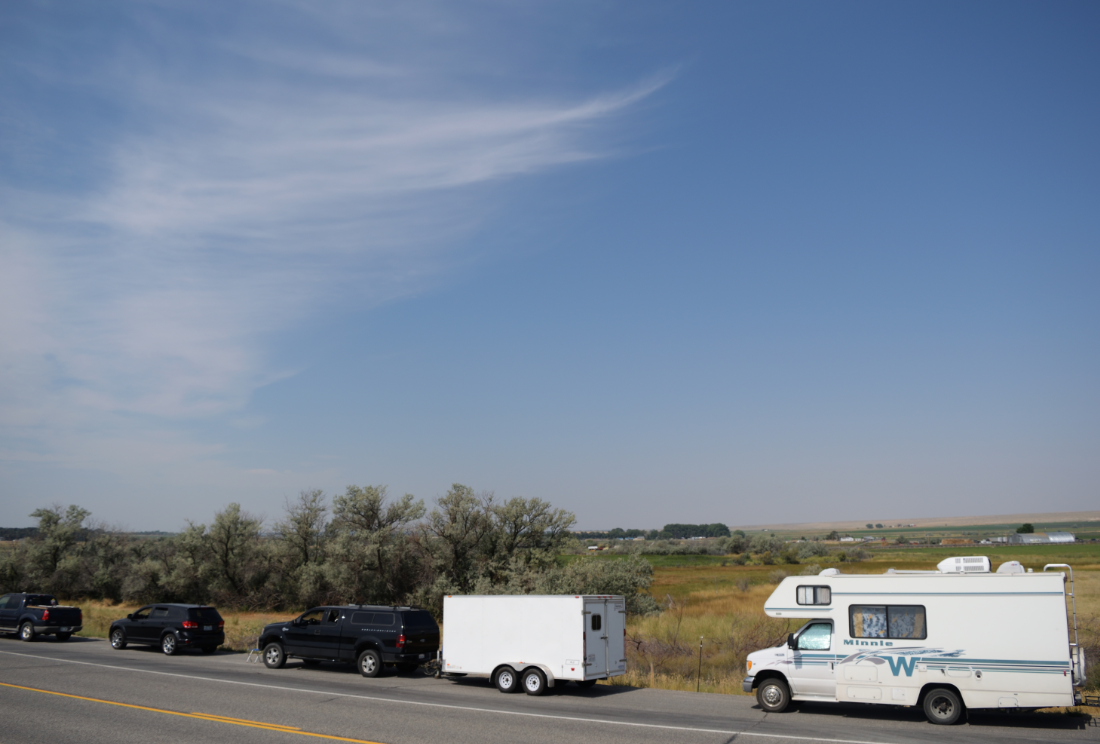
The sky remained clear over the rest of the observation. See the described observation sections below:
- 10:20 – 10:50 – Cirrostratus clouds were prevailing on the observation frame giving a not stable value of sky illumination ranging between 9200 and 9900 Lx with a faint drop impossible to notice by the human eye.
- 10:50 – 11:10 – Cirrostratus clouds were more patchy. The light level started to drop quicker especially around 11:05 when Moon covered the center of the solar disk. The chunks of clouds have been recorded as separate peaks in the chart (Pic 11, 14).
- 11:10 – 11:20 – After halfway through the partial eclipse clouds moved more southward and disappeared. The illuminance level was dropping quicker and quicker, however still without a remarkable sign of the umbra approaching. The sky started to be a little bit darker than at the commencement of the observation, though the illuminance distribution across the sky was very similar to non-eclipse conditions.
- 11:20 – 11:31 – Under the clear sky conditions, the light level dropped from around 50% to 35%. Darkening started to be discernable in the west. The site started slightly darkening as well. For obscuration, 86% shadow cone should be visible at the horizon. However, these mathematical assumptions don’t cover reality, where atmospheric molecules and aerosols occur. On the eclipse day, nothing discernable was visible at that moment probably because of the high haze.
- 11:31 – 11:35 – When the Sun was obscured at 88% sky started darkening faster and faster. This period of time was one of the biggest light level drops with around 15% initial value. This situation arises out of faster sky darkening in shadow-in direction due to the umbra approaching (Pic. 15).
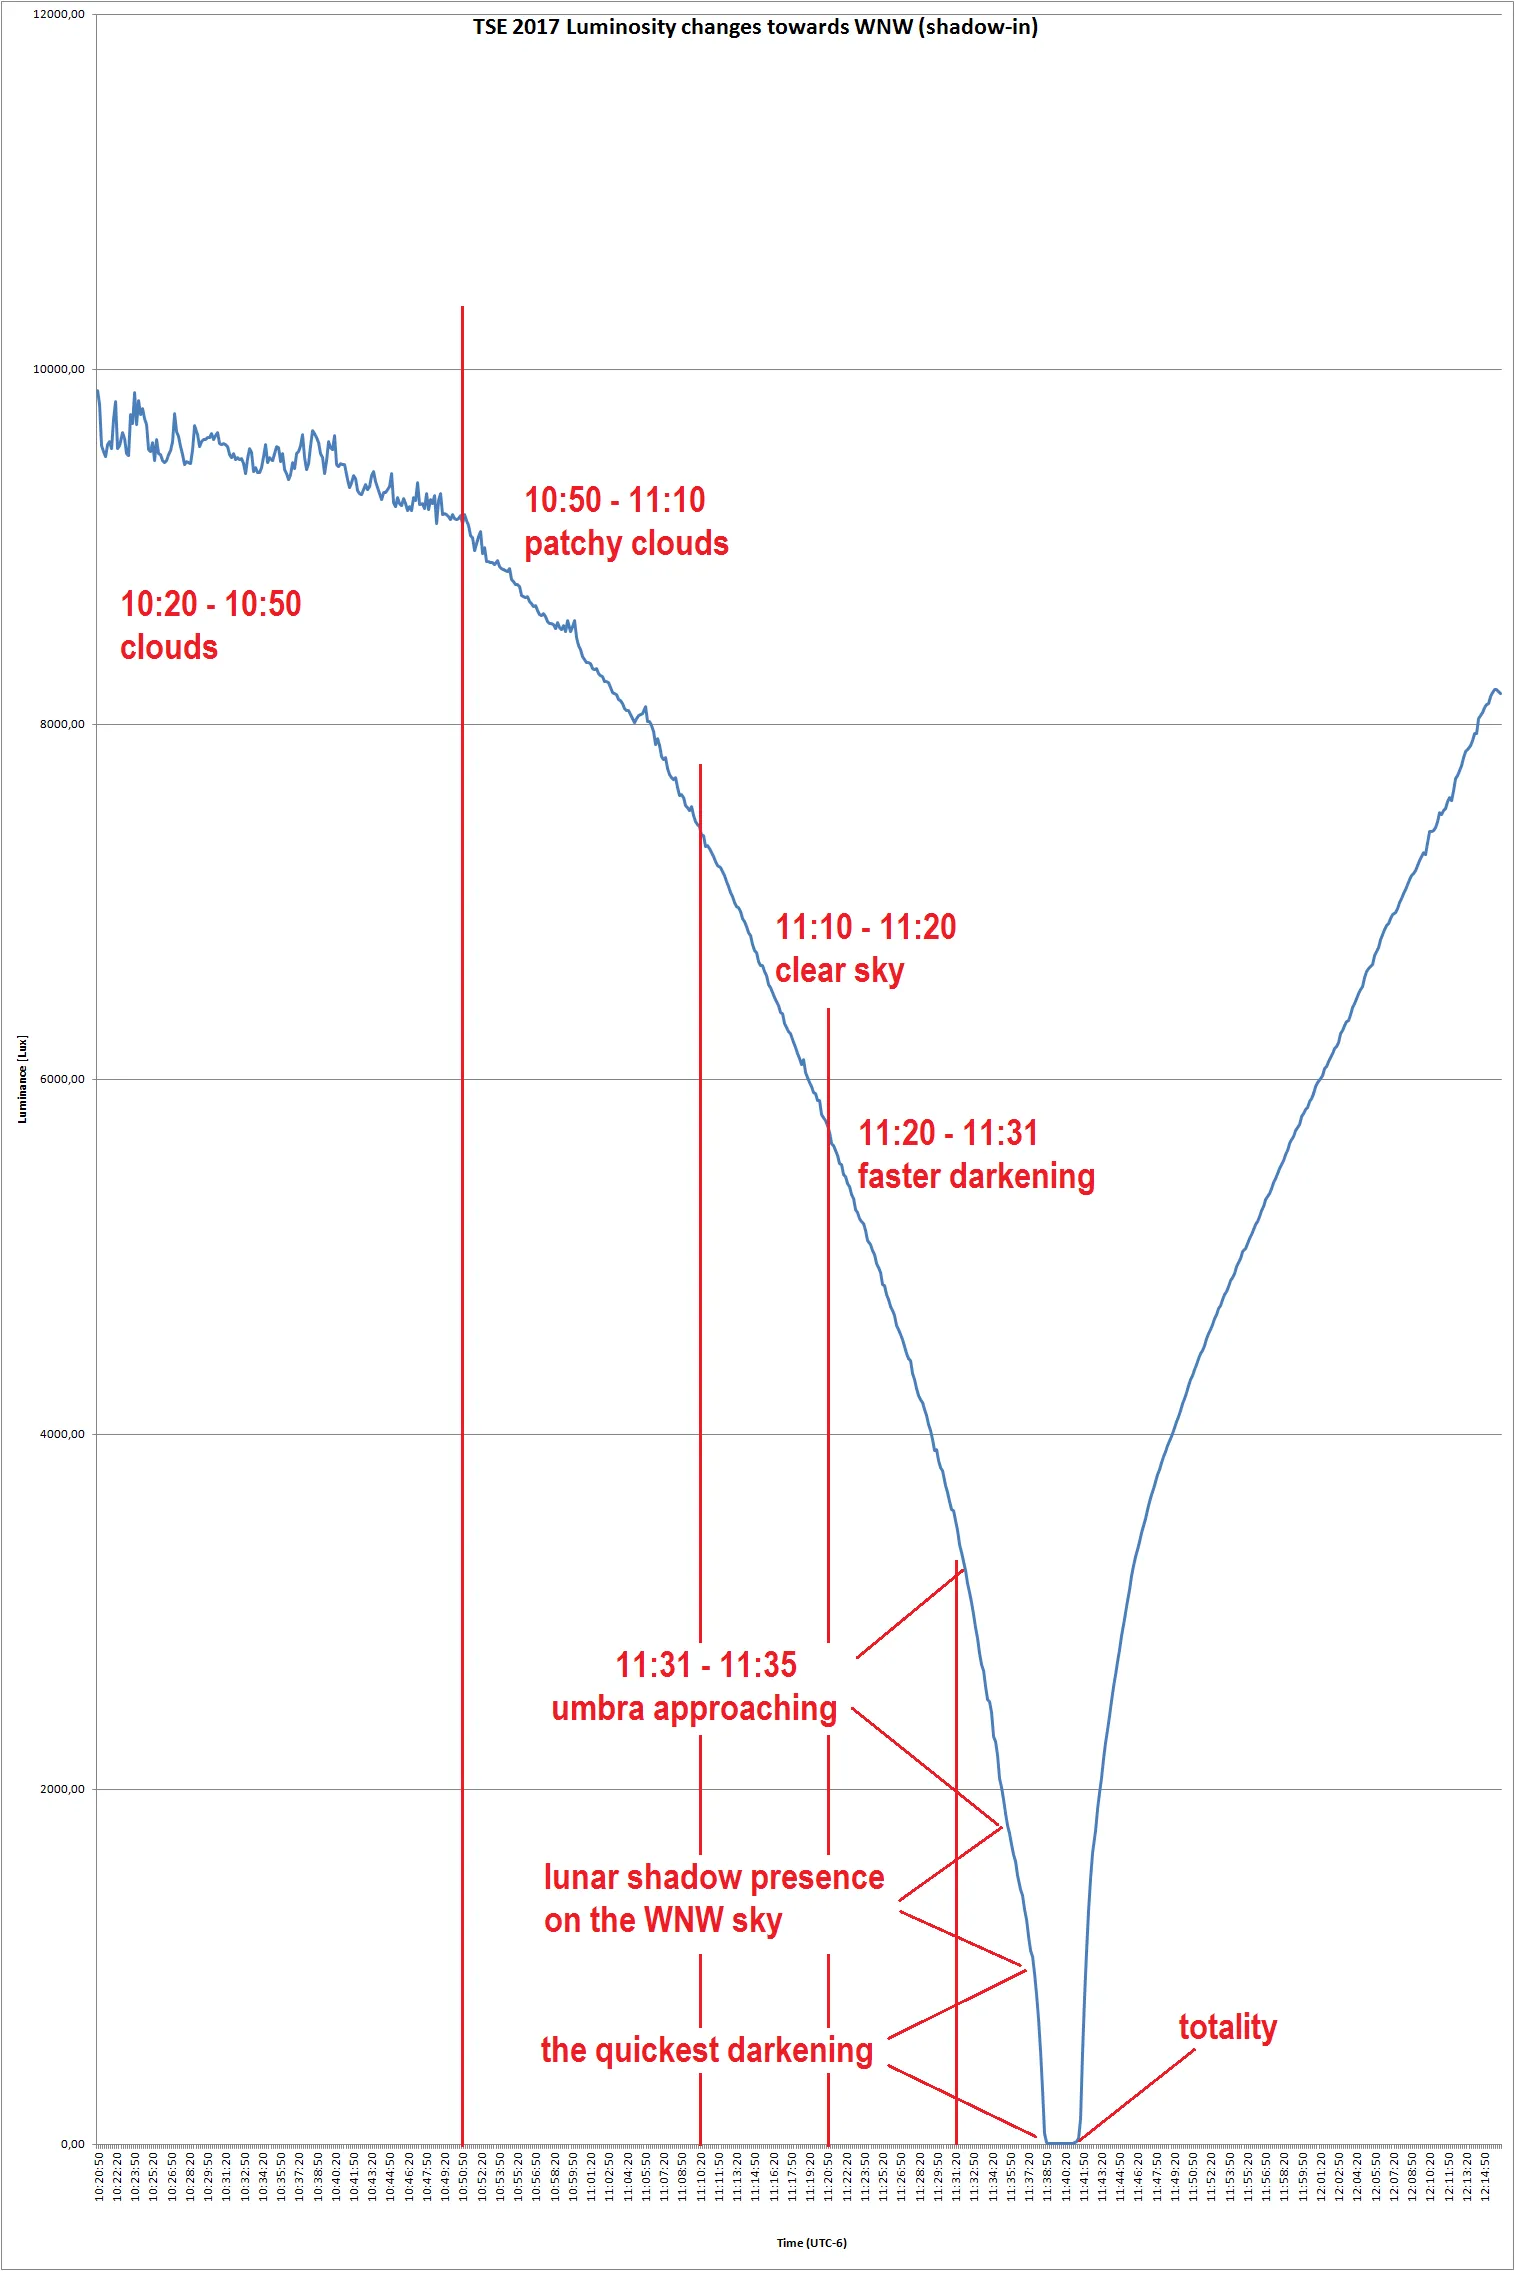
Pic. 15 Light level changes recorded on the WNW (shadow-in) section of the sky with a rough explanation of significant periods. Click to enlarge. - 11:35 – 11:37 – North-west sky darkening appeared to be slower. It can be explained by the lunar shadow presence, which started to be visible in the sky. The solar obscuration at that moment was from 94,5% to 97,5%. The light level was dropping slightly slower, but still much faster than halfway through the partial phase. It can be compared with the 10 minutes earlier period, where Solar disk was obscured in around 85%.
- 11:37 – 11:38 – This is undeniably the period of the fastest light level dropping with quick changes of sky color also.
- Before 2nd contact – The shadow-in sky reached the lowest level of luminosity around 20 sec before 2nd contact. Only within 1 minute from 11:37:50 to 11:38:50, the illuminance level dropped for around 950 Lx, while the biggest decrease was recorded between 11:38:30 and 11:38:40 for nearly 240 Lx value. The period of the last 20 seconds before 2nd contact featured a smallish light level drop from 9 Lx to nearly 5 Lx. The opposite side of the umbra became clearly visible since the biggest light level dropped (around 30 sec before totality). When solar obscuration reached a key 99% the shadow-in section of the sky illumination was around 550 Lx.
- Totality – The lowest value for the shadow-in section of the sky was at 20-30 sec after 2nd contact. Thereafter, when the umbra proceeded upper in the sky the glow began to be brighter. Around mid-eclipse, the northwest part of the sky was dark equally to 2nd contact with a 4 Lux value. The min. illumination value measured by Samsung Galaxy S5 was 3.56 Lux. A faster illumination growth has been reported around 40 sec before 3rd contact. The northwestern sky light level grew rapidly in the last 10-15 seconds before 3rd contact when the umbra definitely left this section of the sky (Pic. 16 – 18).
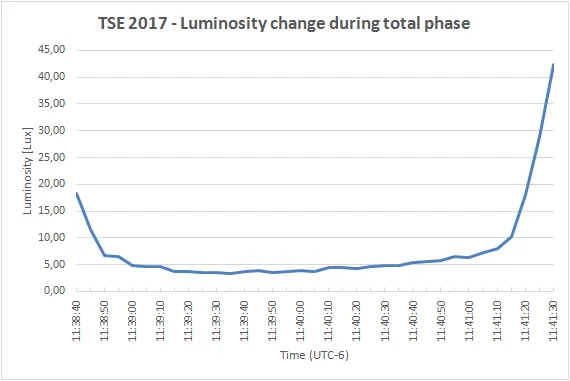
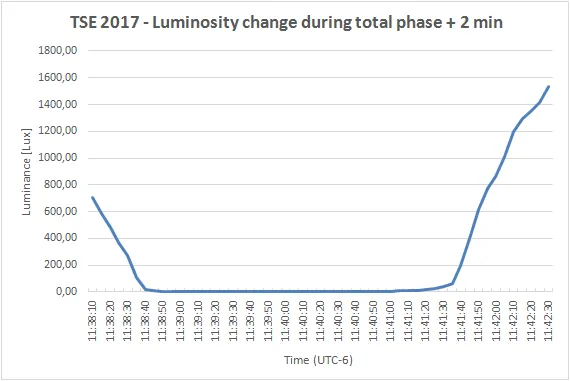
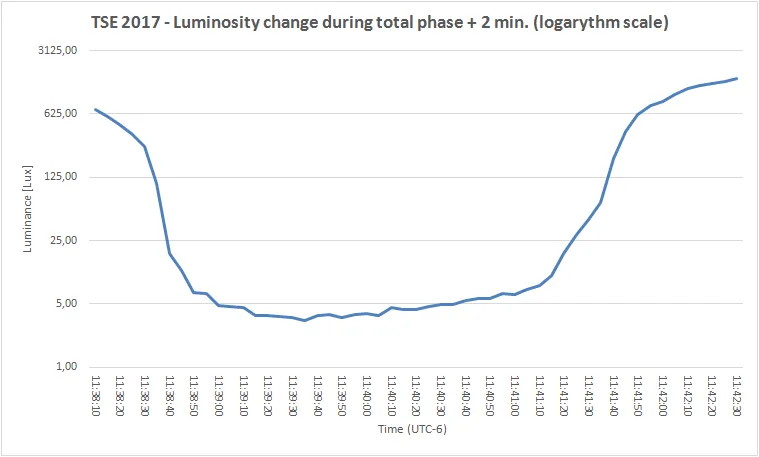
Pic. 16 – 18 Light level changes towards WNW (shadow-in) direction around totality, where: 16 – totality window; 17 – totality window + 2 min; 18 – totality window + 2 min logarithmic scale. - After 3rd contact – The illumination changes look straightforward and are logarithmic-dependant (Pic. 19,20).
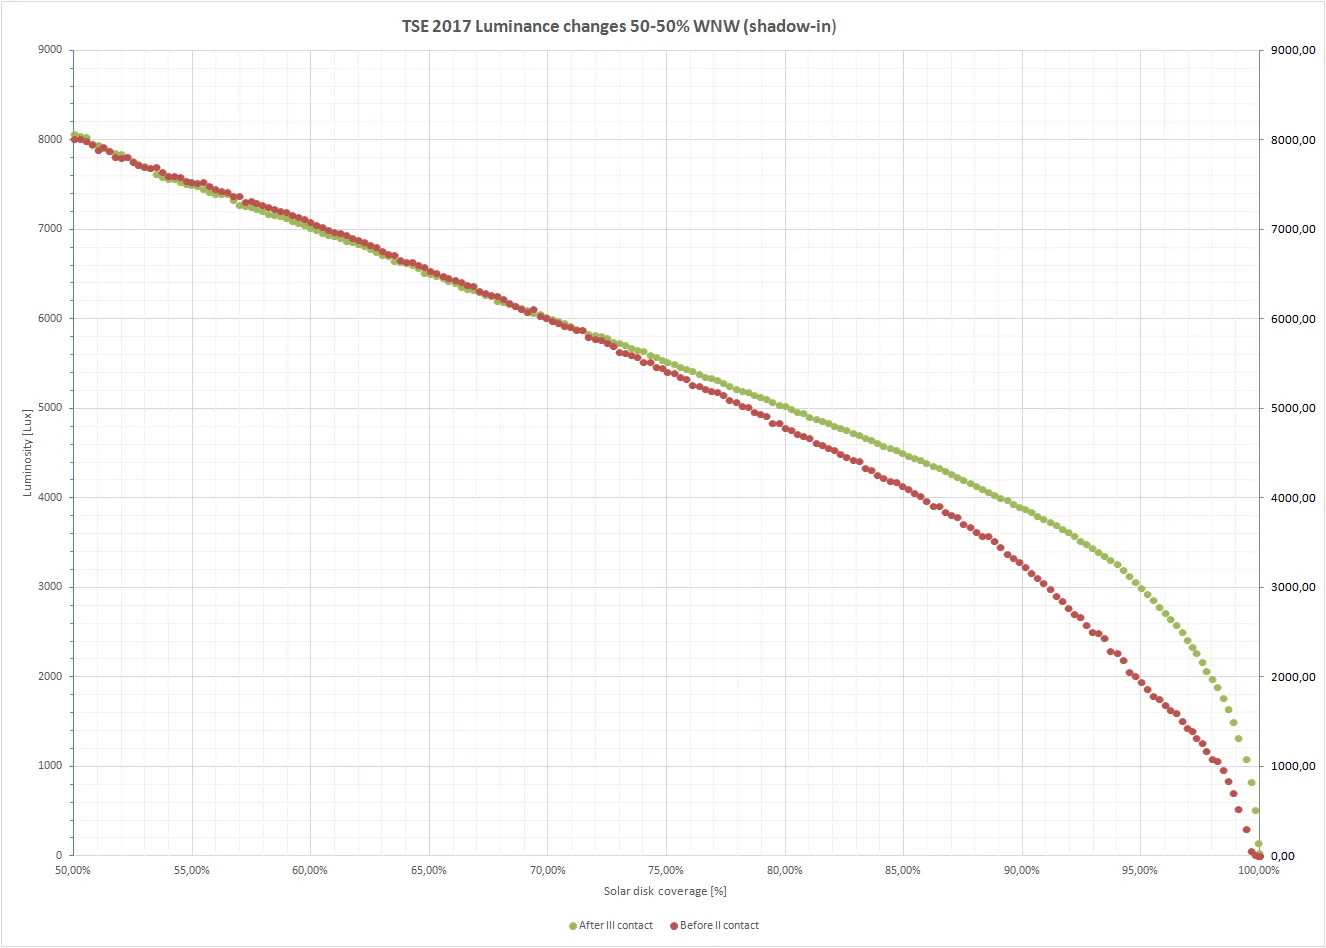

Pic. 19, 20 – Illumination changes towards WNW (shadow-in) sky between 50% obscuration before and after totality. Click to enlarge. - The situation becomes more complicated by the end of the measurement when sky illumination appears to grow slightly faster. It is caused by changing the position of the Sun. As the Sun went more westwards during the eclipse the angular distance between my measured section of sky and Sun. It influences on local brightening of the sky, which we can clearly see on the chart (Pic. 21, 22)
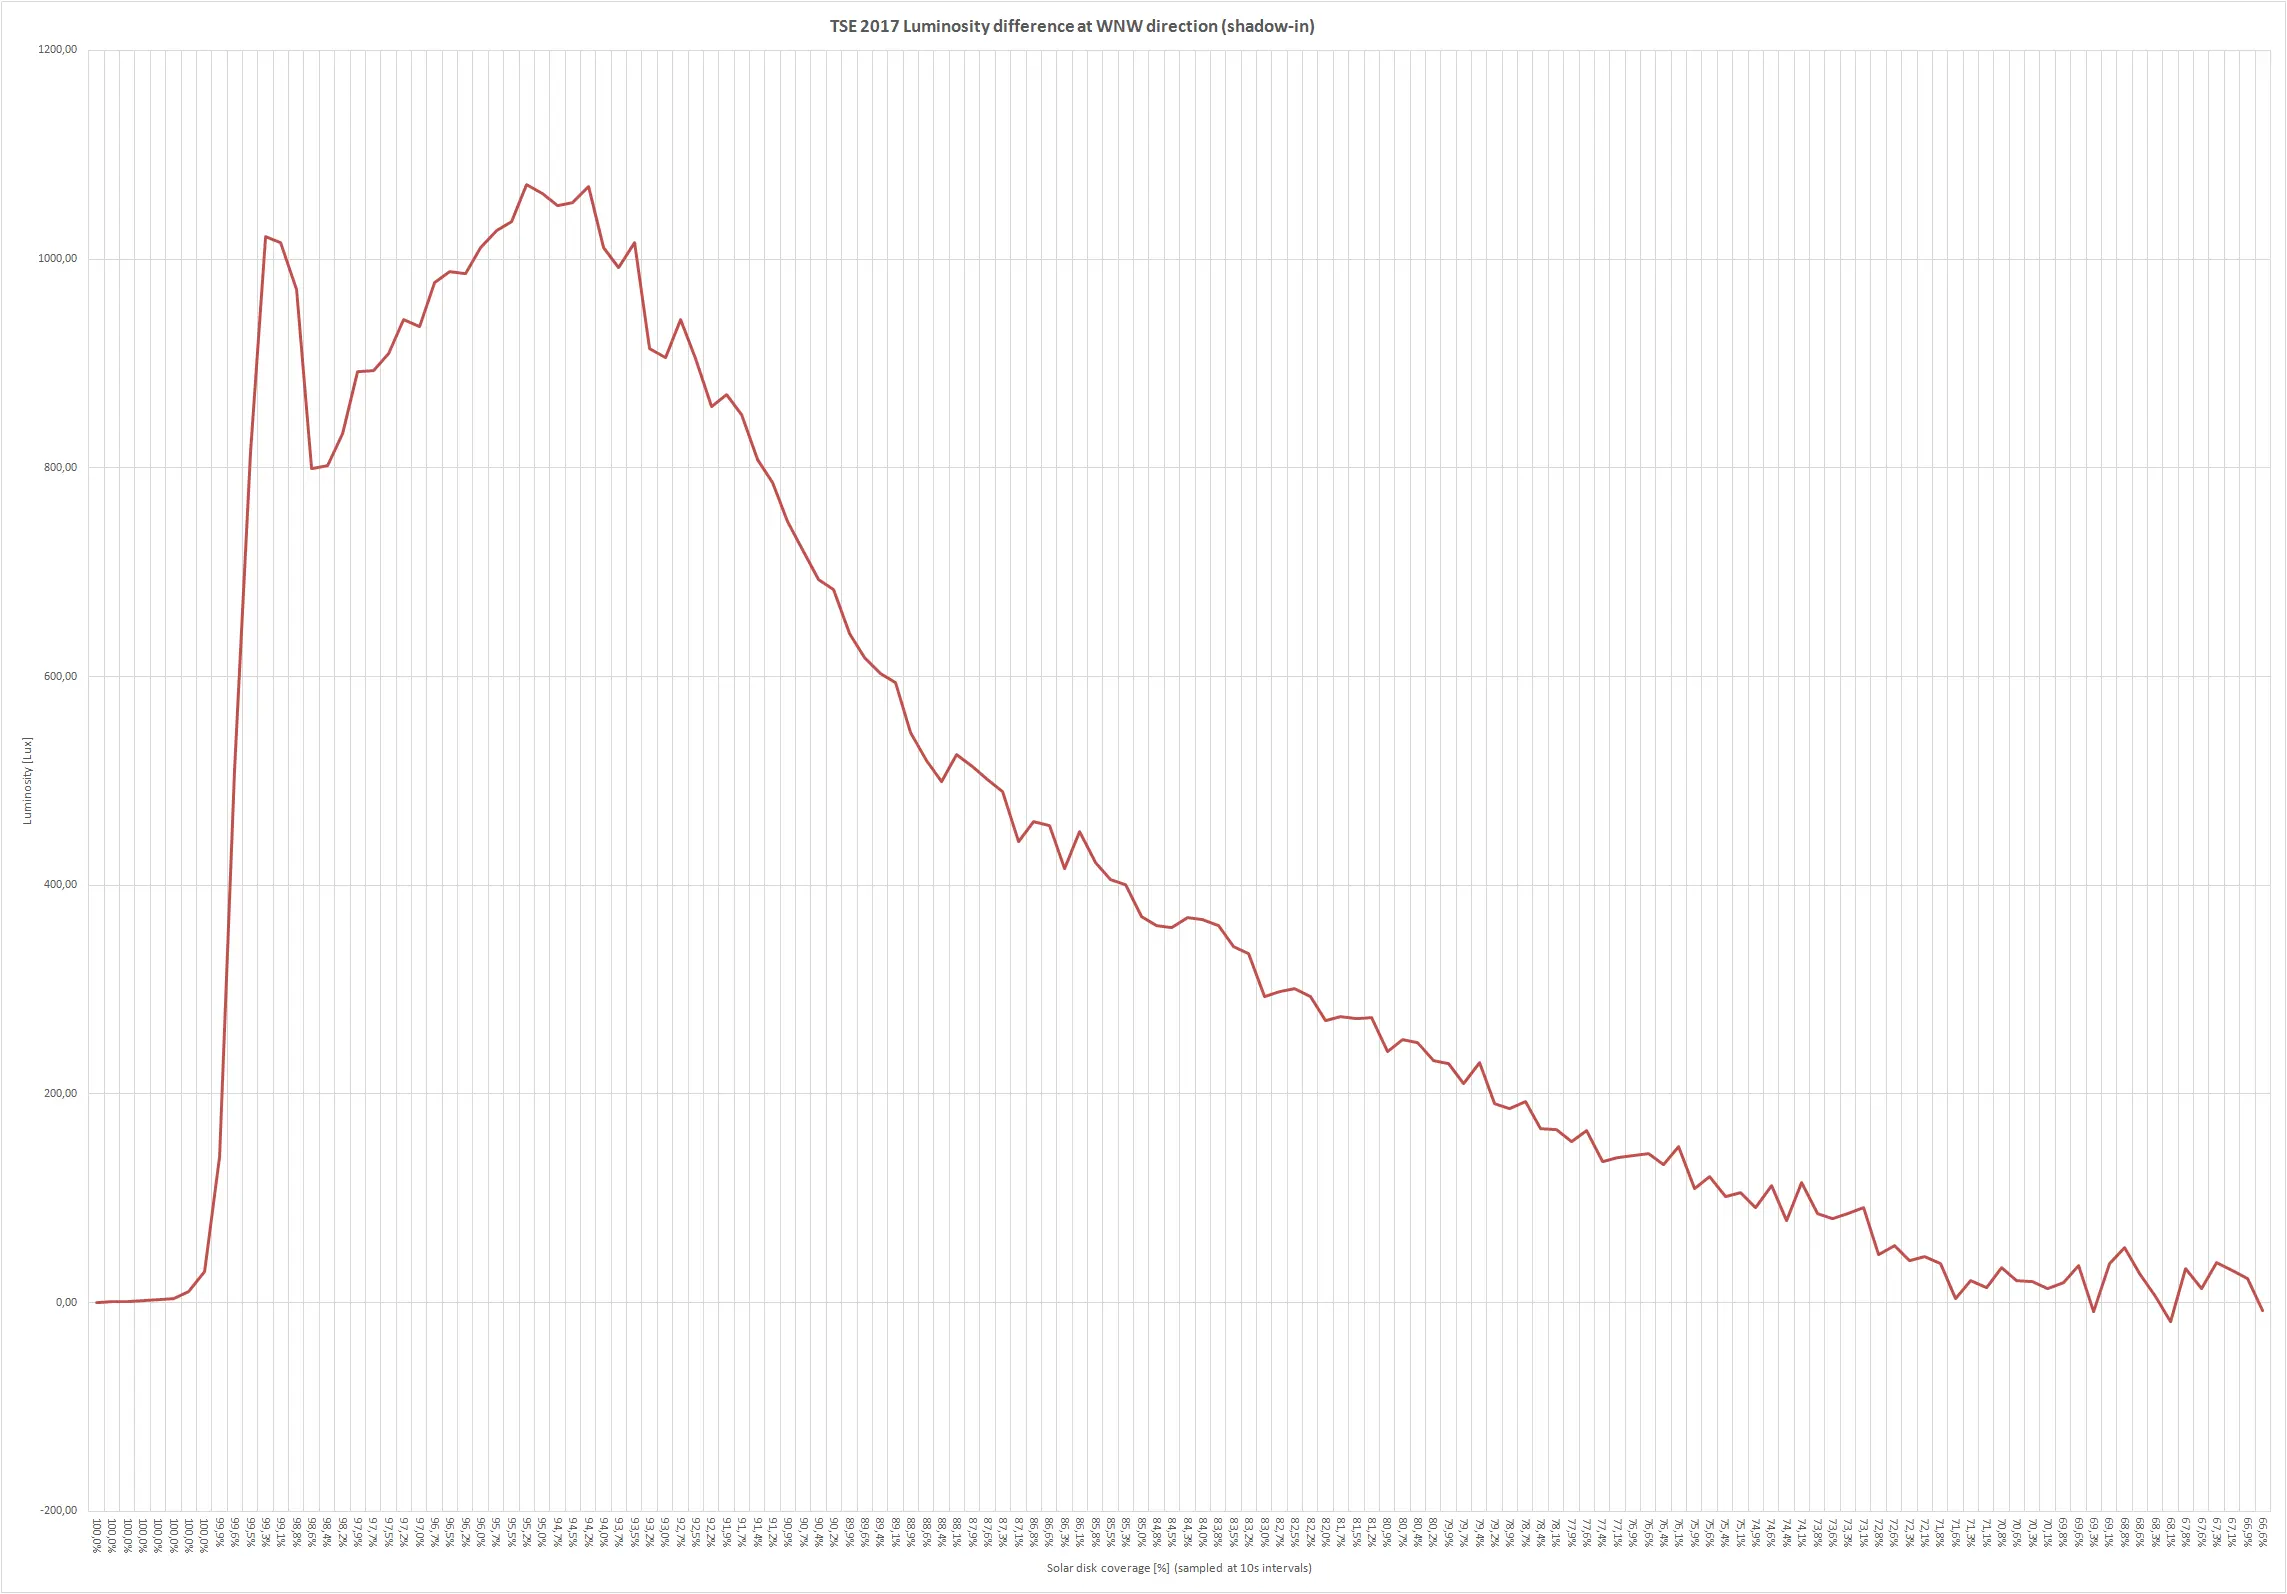
Pic. 21 The light level difference towards the WNW (shadow-in) sky between the totality and the end of the measurement. Click to enlarge. 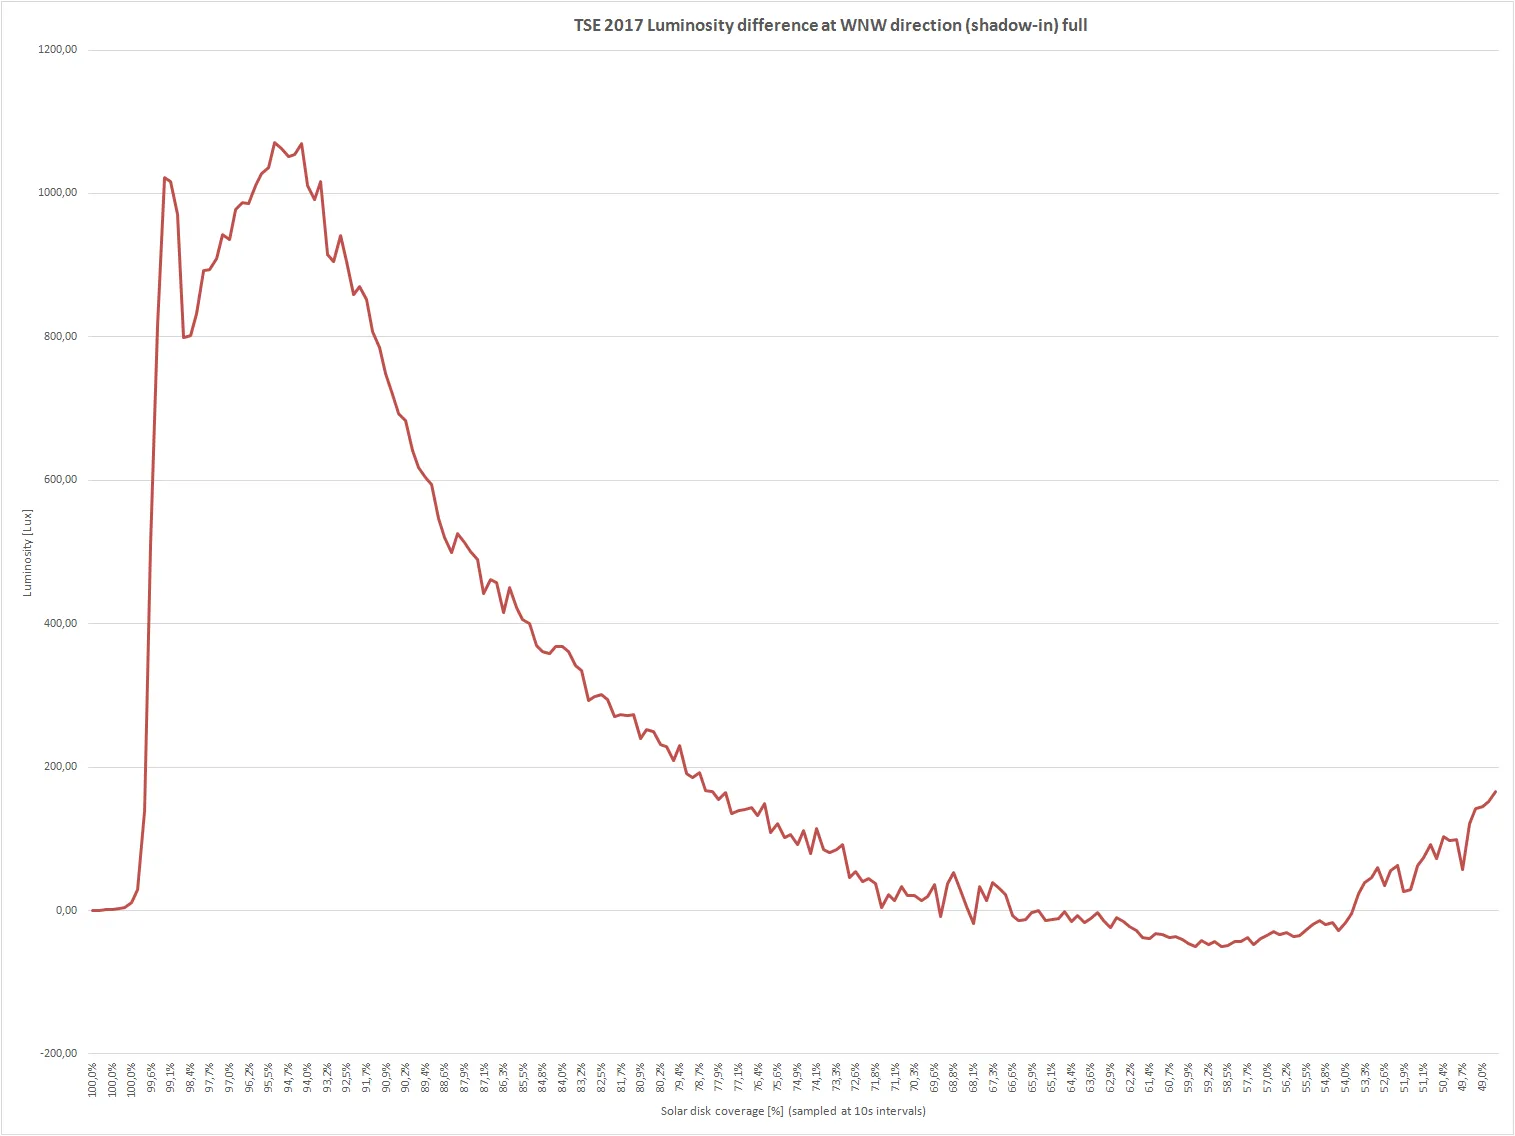
Pic. 22 Light level difference towards WNW (shadow-in) sky related to the lowest value during totality. Click to enlarge.
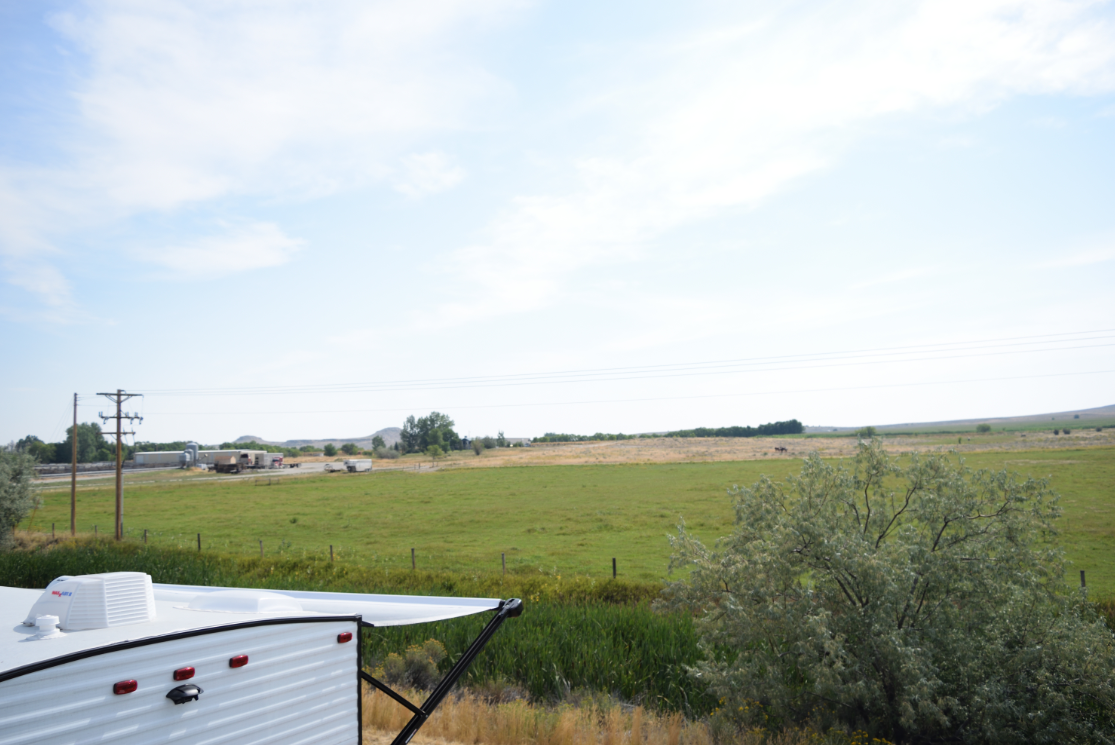
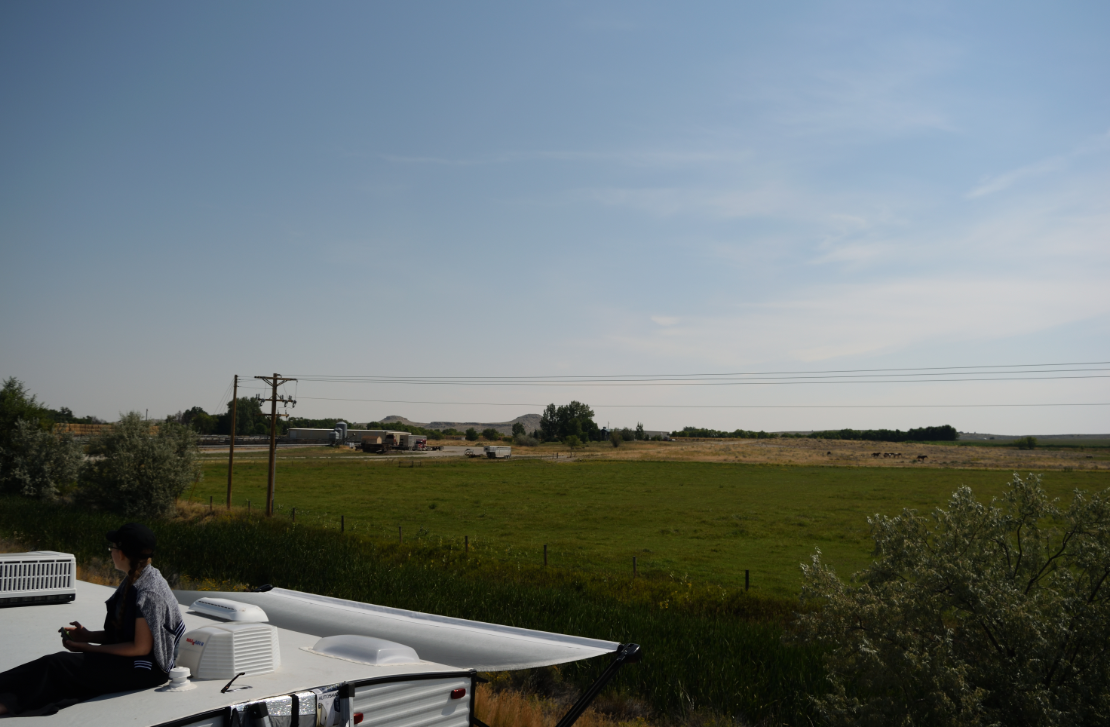
Shadow out direction – This was the section of sky with ESE direction, where the umbra receded after the totality. Similarly to the shadow-in section here also cirrostratus clouds were presented for around the first part of the partial phase (Pic. 23, 24). These clouds moved southward around 10-15 min earlier than in the opposite section of the sky. The base sky illumination level for the shadow-out direction was around 60000 Lx. Due to cloud presence, this value was lifted up to around 61500 Lx. Here I also divided this measurement for shorter periods in order to highlight the most important things, which I spotted.
The most important moments of illuminance changes have been listed below:
- 10:20 – 11:00 – The ESE section of the sky was partially covered by cirrostratus clouds, which intensified the light scattering. The light level fluctuations were cloud-dependent only with no eclipse-induced changes during this period. Solar disk obscuration at 11 am was 41% (Pic. 25, 26).
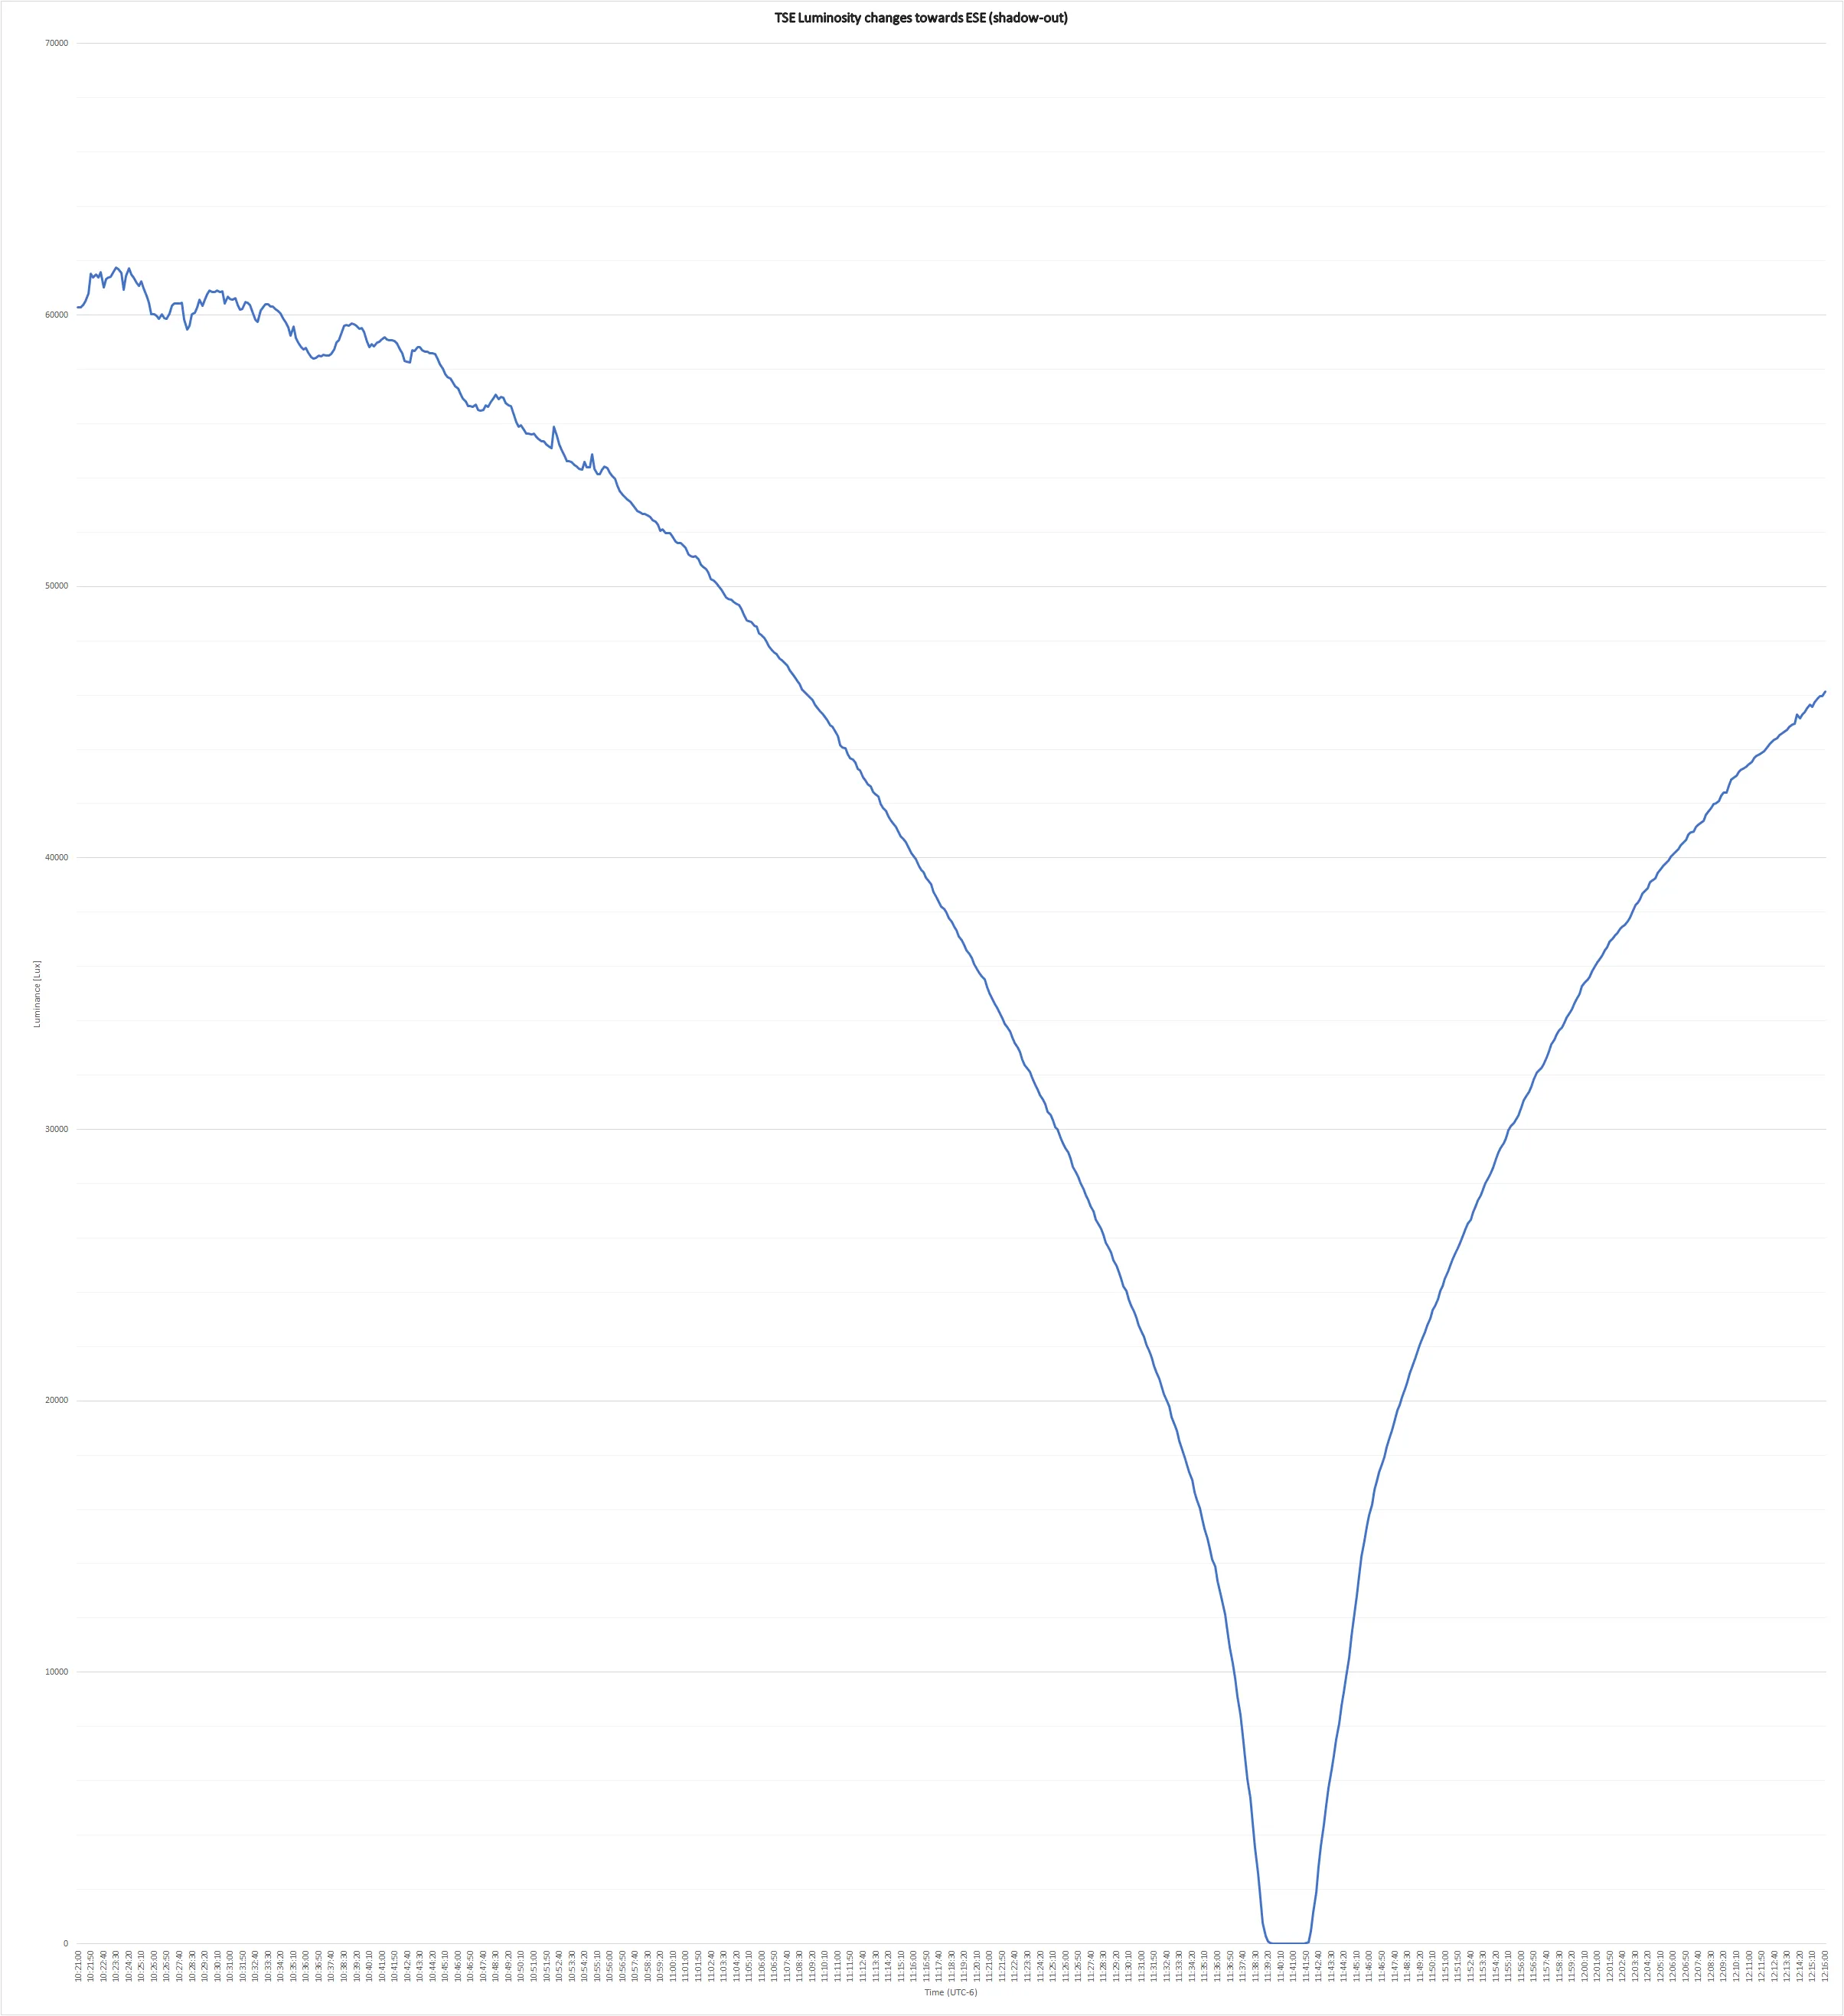
Pic. 25 Overall luminosity changes towards the shadow-out direction during the 2017 Greatest American Eclipse. Click to enlarge. 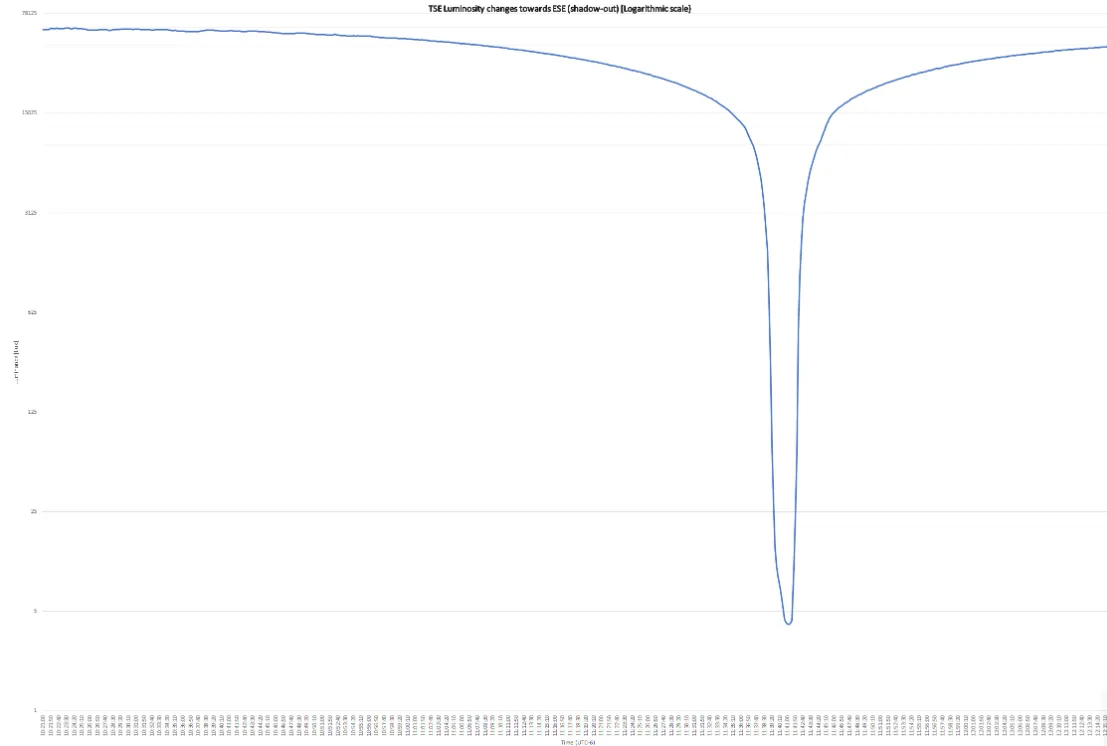
Pic. 26 Overall luminosity changes towards the shadow-out direction during the 2017 Greatest American Eclipse – logarithmic scale. See an original image here. - 11:00 – 11:38 – Illuminance changes behaved likewise logarithmic function does. The light level drop was quicker and quicker as the eclipse progressed. At 11:38:00 the illumination value constituted 10% full daylight in this direction.
- Before 2nd contact – the light level on the shadow-out part of the sky dropped rapidly, however, it remained much brighter than on the opposite side of the sky, because the umbra wasn’t covering it. The biggest illumination level dropping has been recorded between 11:38:50 and 11:39:00 from nearly 1700 Lx to around 750 Lx 10 seconds before totality (Pic. 27).
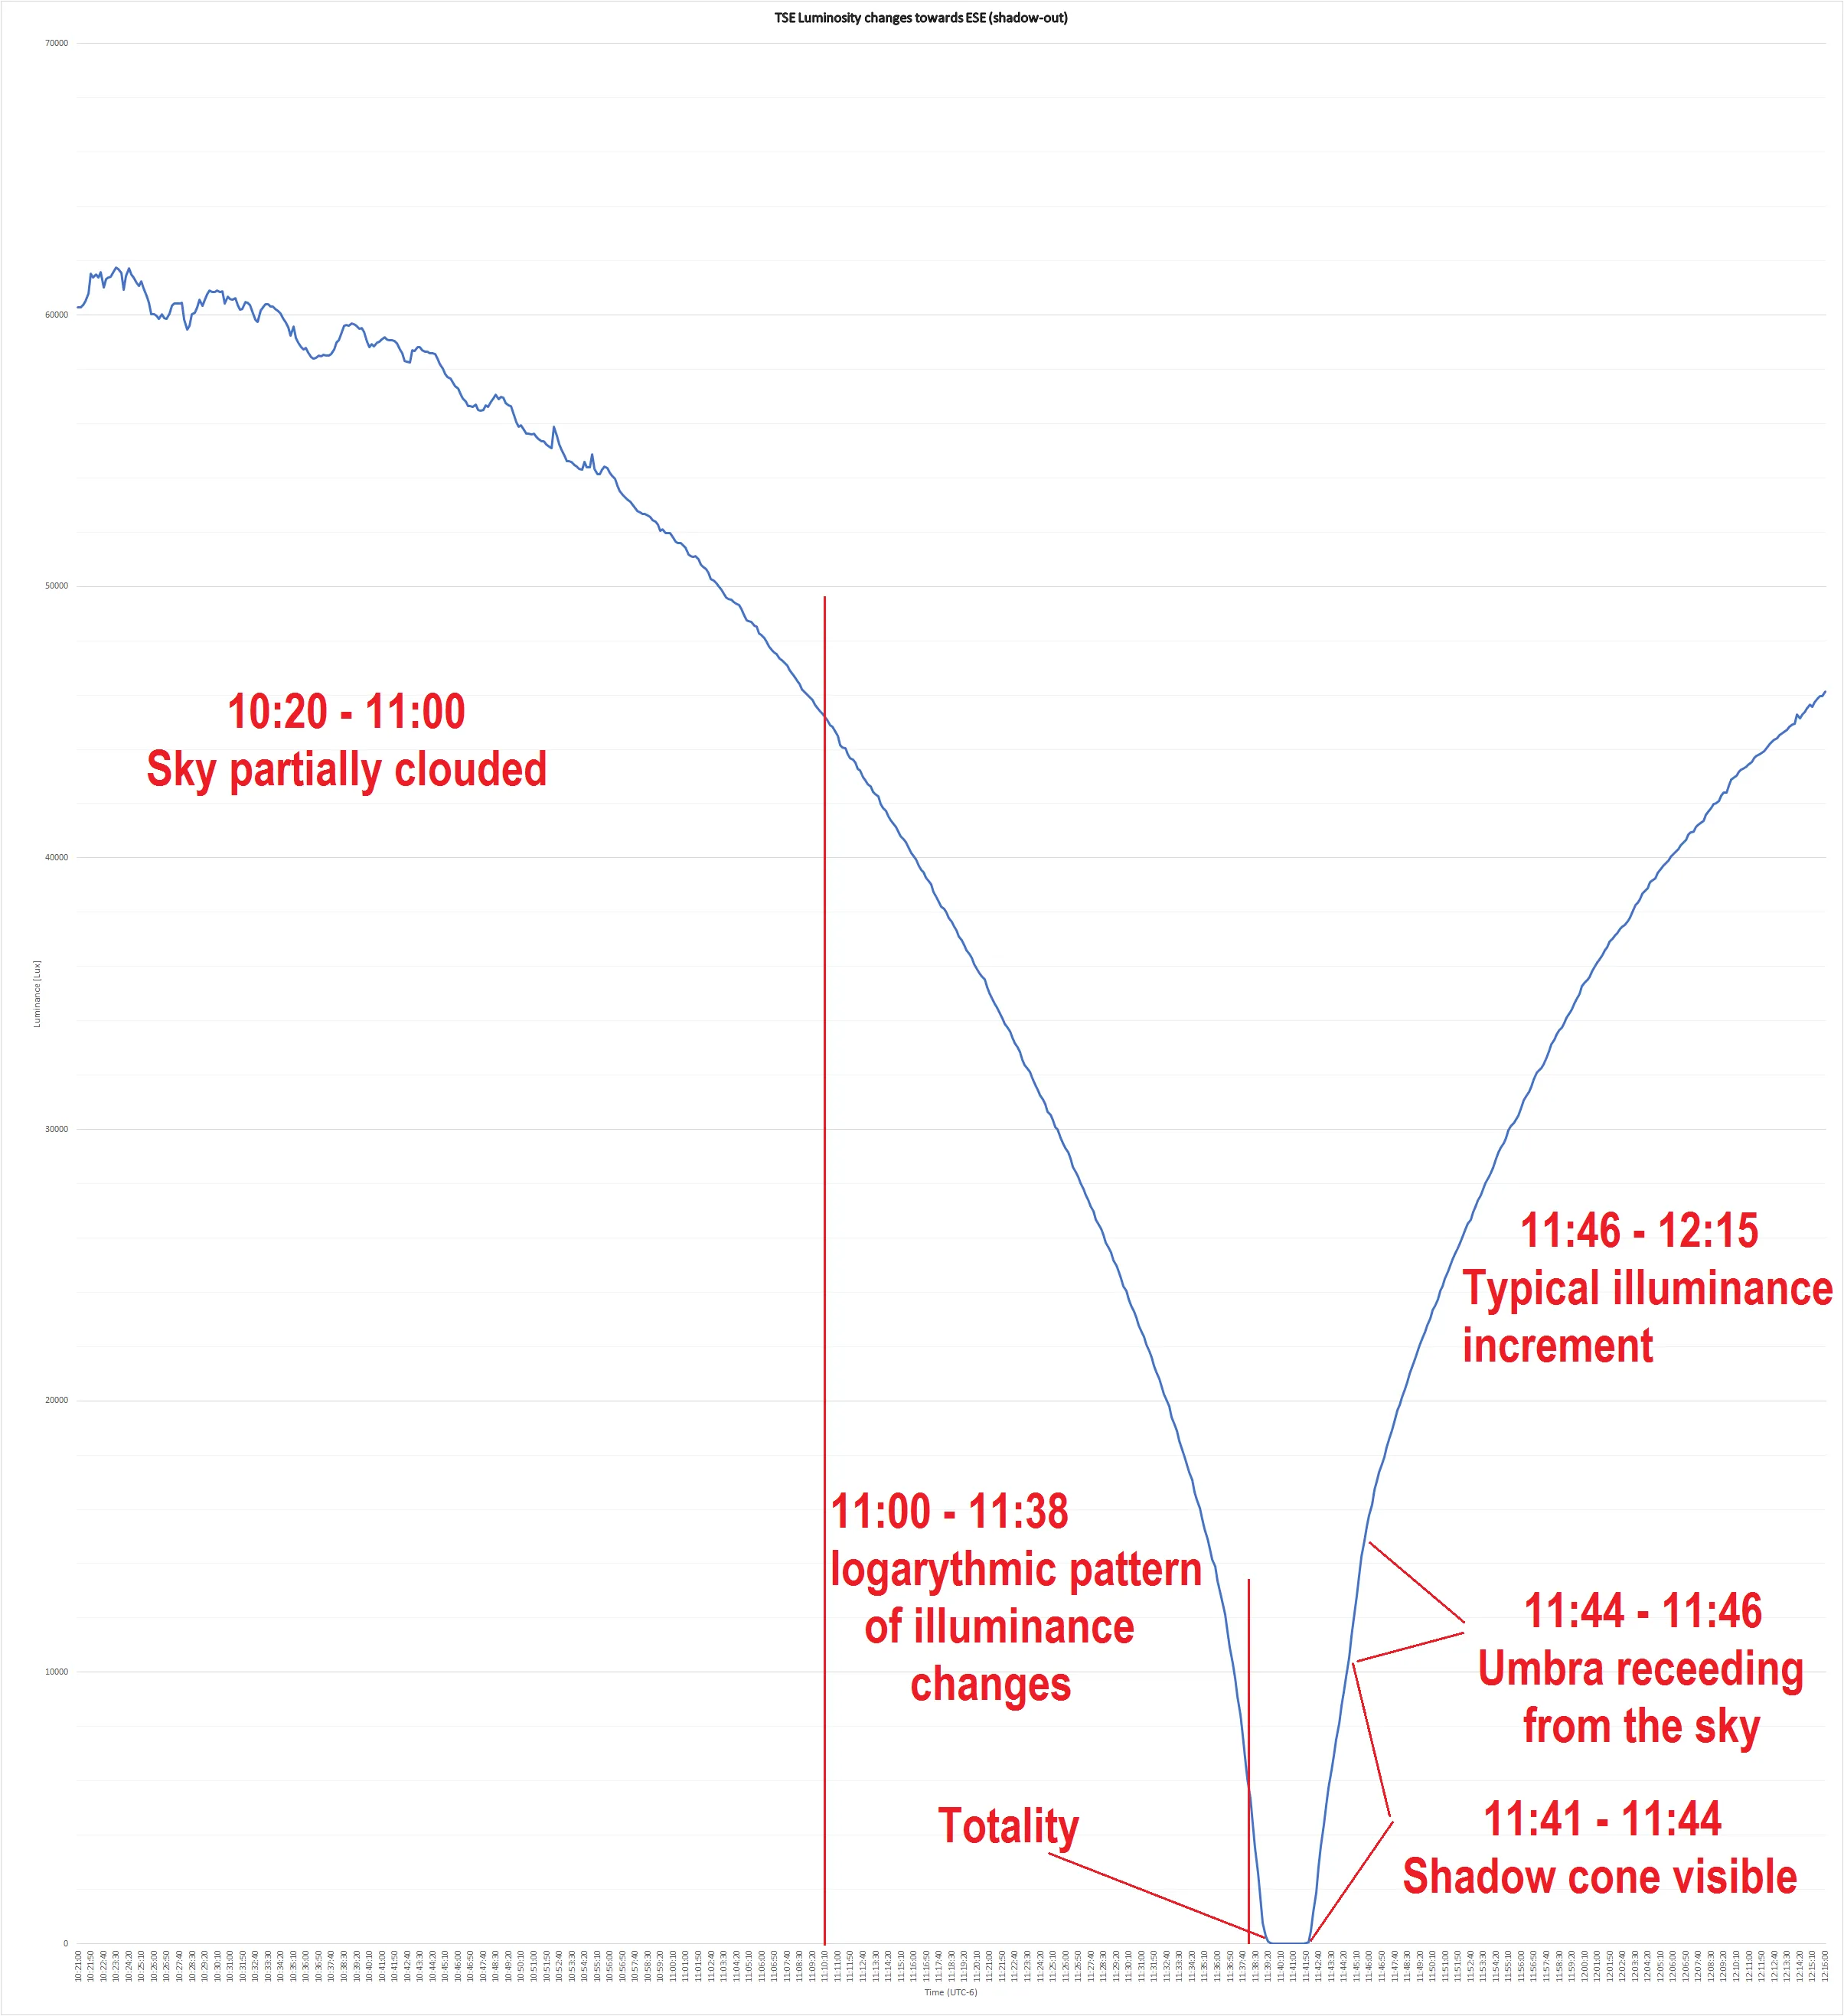
Pic. 27 Light level changes recorded on the ESE (shadow-out) section of the sky with a rough explanation of significant periods. Click to enlarge. - Total phase – Began huge changes of illuminance level in shadow-in direction. For the first seconds of totality, before the lunar shadow-covered ESE sky the illuminance dropped from over 270 Lx to 70 Lx giving this section of the sky a still brighter appearance than on the opposite side. The lowest level of light has been recorded from around 30-40 sec after 2nd contact. At the mid-eclipse, the light level was equal to the moment a few seconds after 3rd contact. The lowest illumination value centered at 20 sec before 3rd contact with 4 Lx (Pic. 28-31).
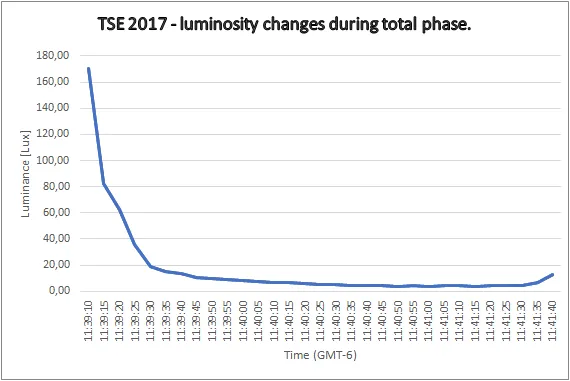
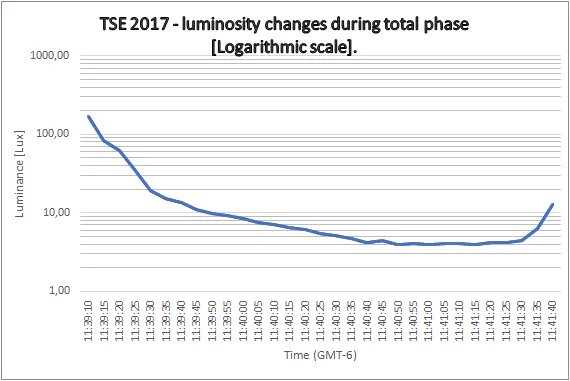
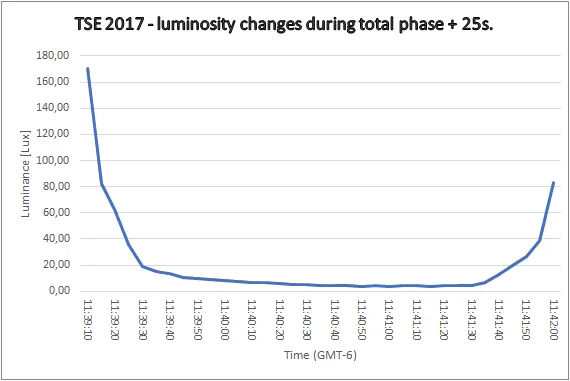
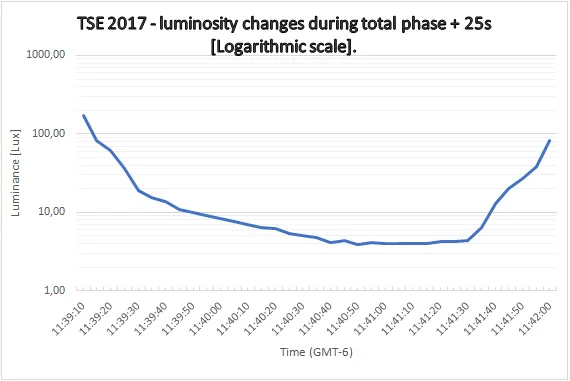
Pic. 28 – 31 Light level changes towards ESE (shadow-out) direction around totality, where: 28 – totality window; 29 – totality window, logarithmic scale; 30 – totality window + 25s afterward; 31 – totality window + 25s afterward, logarithmic scale. - 11:41 – 11:44 – Just after 3rd contact the illumination of the shadow-out sky increased slowly making a shadow cone clearly visible on the East. From 40 sec to 1m10sec after totality was the fastest illumination increase from around 480 Lx at 11:42:10 to nearly 2900 Lx at 11:42:40. Over the next seconds, the light level increased but a bit slower up to 11:44, when solar obscuration was 96,5%. It was the time of considerable influence of the umbra on the illumination of the eastern part of the sky. The high level of haze scattered forward completely washed out this. The dark cone was visible until around 98% obscuration and afterward became invisible to the observer.
- 11:44 – 11:46 – A small acceleration of illumination increase is visible due to the umbra receding from the sky sphere. At 11:46 the solar obscuration was nearly 94%. This is definitely the last moment when the shadow’s presence is set down.
- 11:46 – 12:15 – The last part of the measurement was a typical performance (Pic. 32, 33).
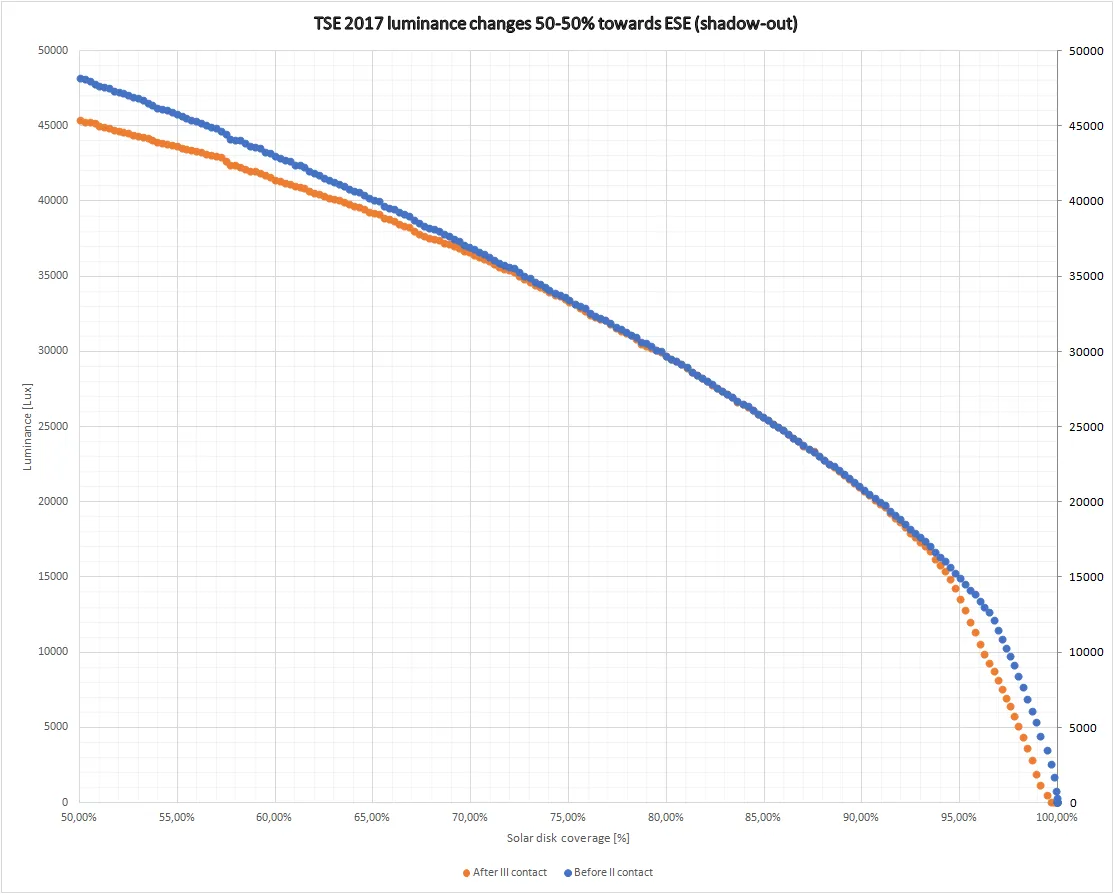
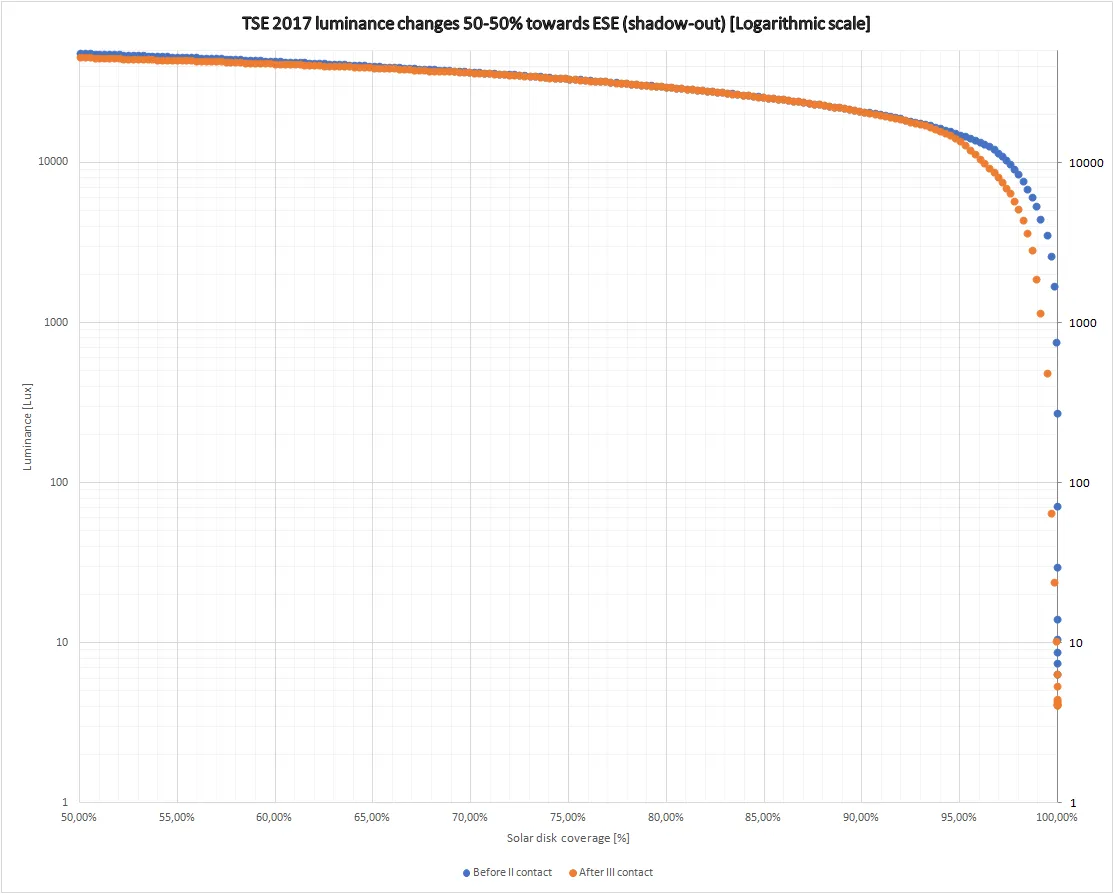
Pic. 32, 33 Illumination changes towards ESE (shadow-out) sky between 50% obscuration before and after totality. Click to enlarge. Light level grew slower and slower, especially near the end of the measurement. Unlike in the northwestern sky, the angular distance between Sun and the measurement direction was bigger resulting in less amount of light reflection (Pic. 34, 35).
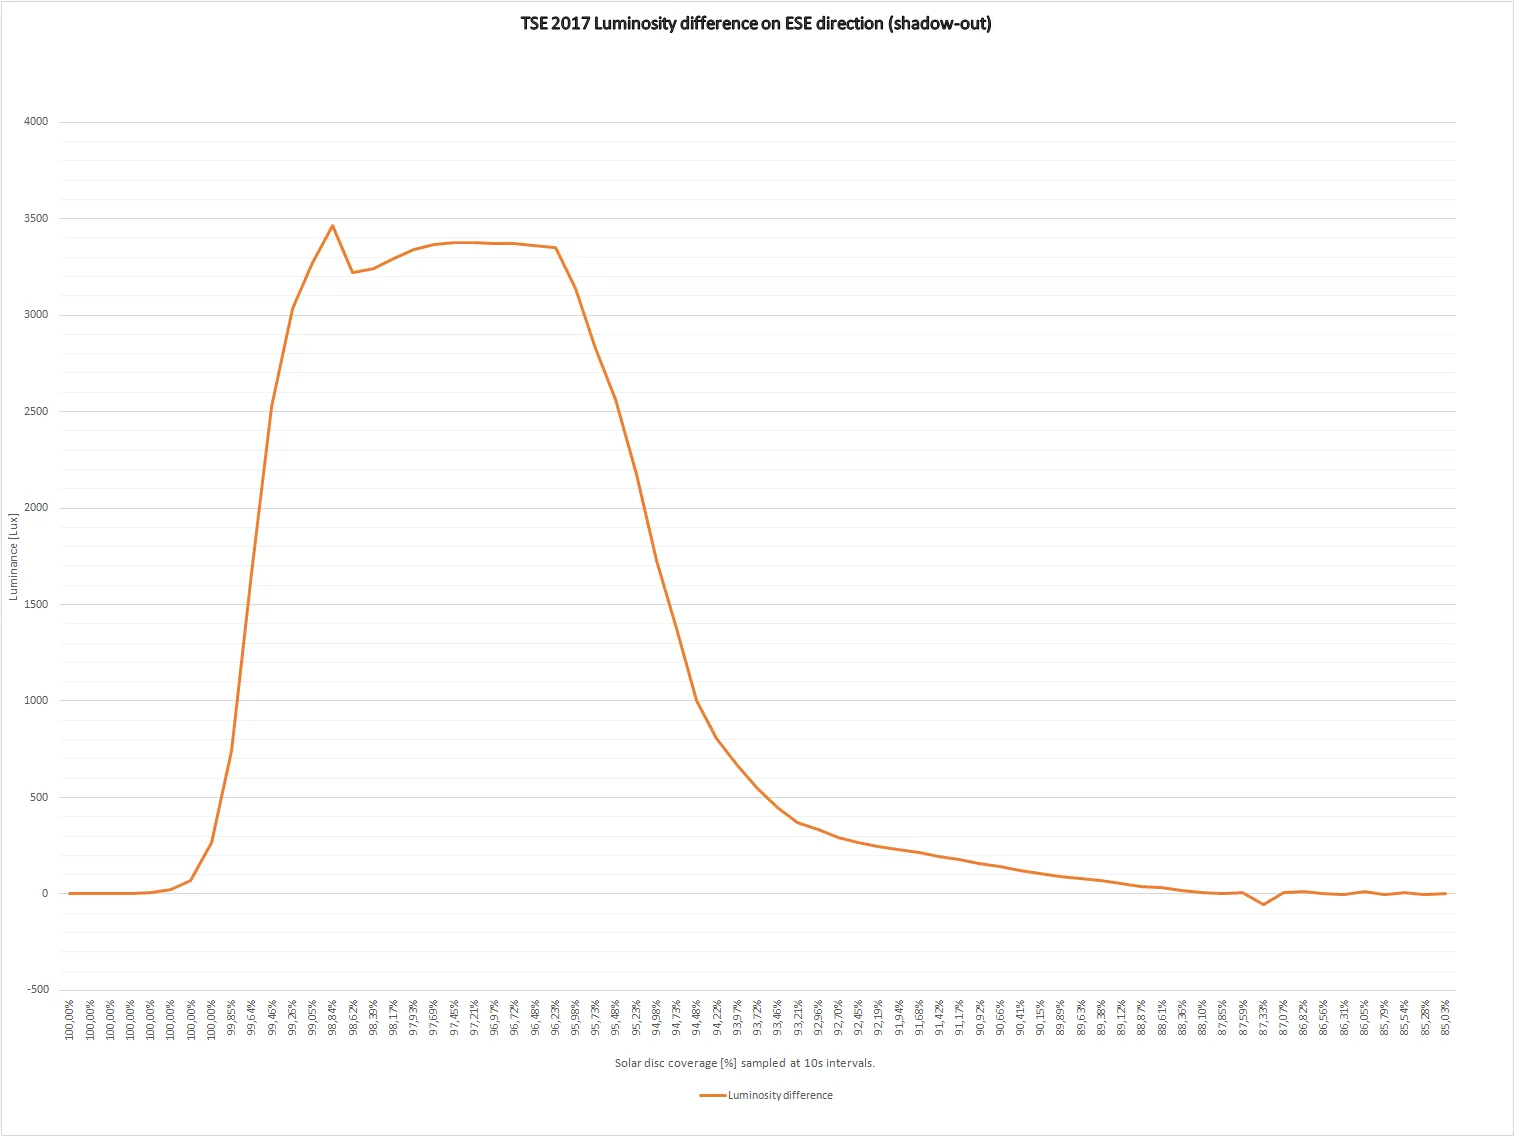
Pic. 33 The light level difference towards ESE (shadow-out) sky related to the lowest value during totality. Click to enlarge. 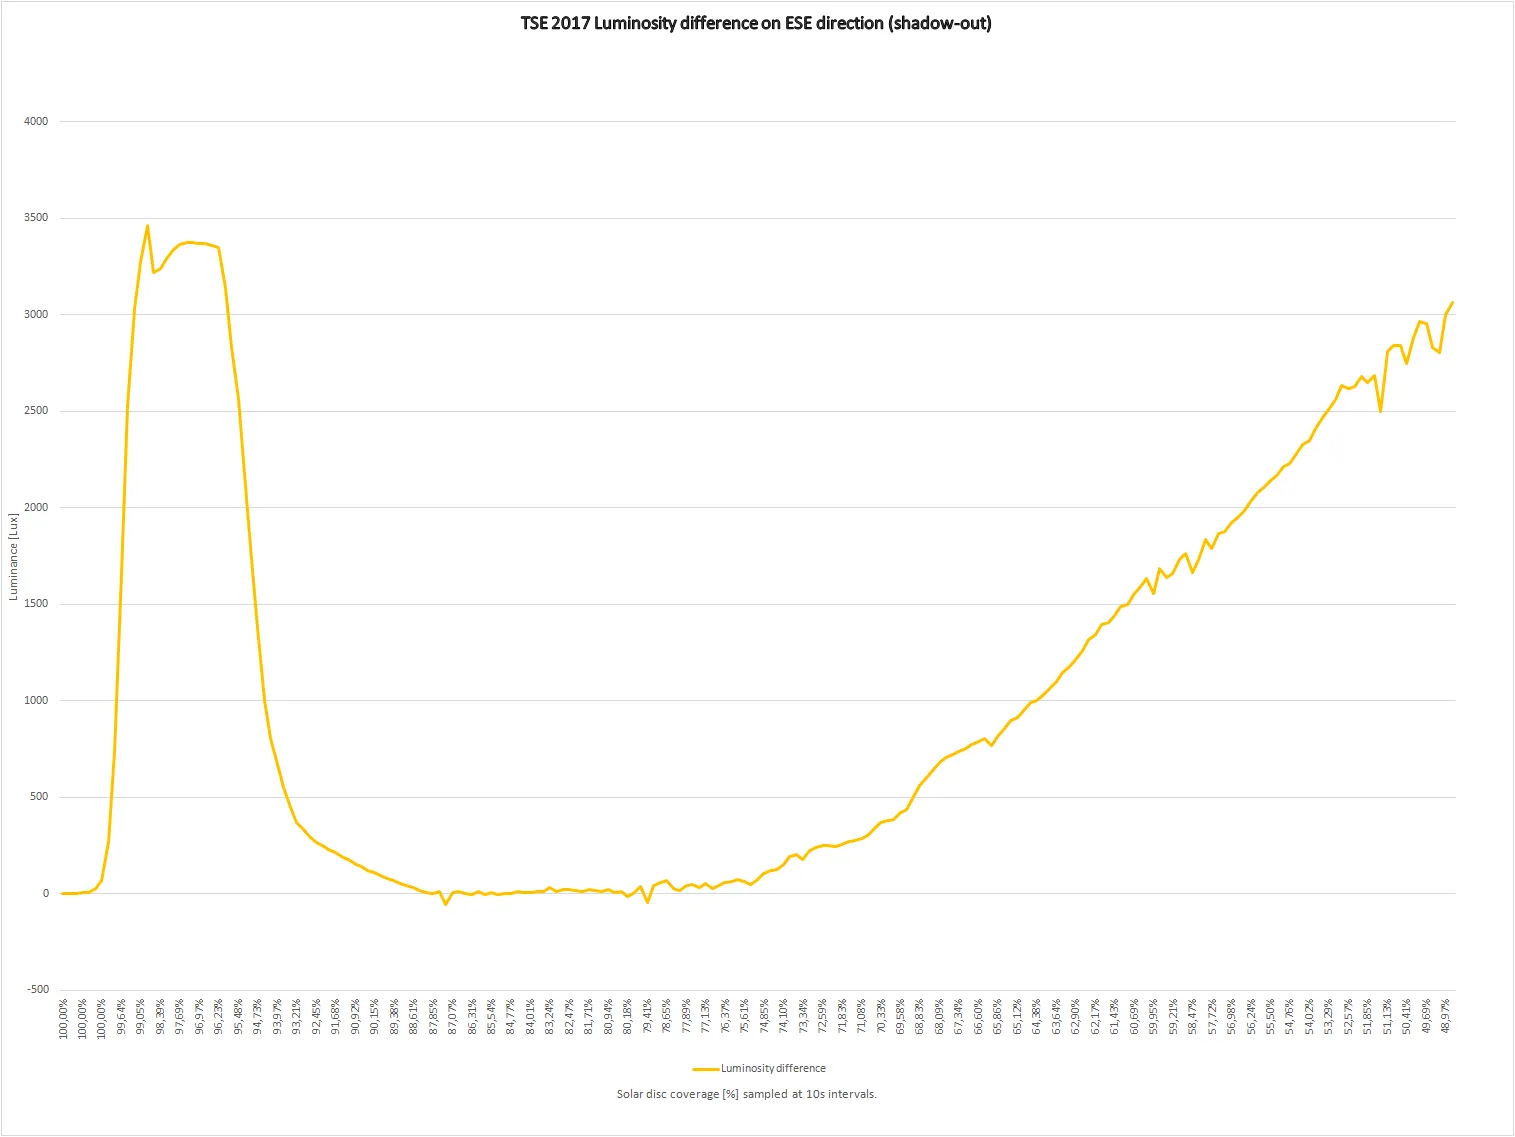
Pic. 34 The light level difference towards ESE (shadow-out) sky between the totality and the end of the measurement. Click to enlarge. Before and after comparison – These measurements differ from each other not only in direction but also a character. Analyzing a shadow-in chart solely we can conclude, that the darkening of the sky started when the solar disk was obscured by 72%. These values are minor and become significant for around 80% obscuration, where the difference between before and after is more than 200 Lx. For further moments the difference increases constantly up to 88% obscuration, where lunar shadow influence becomes significant.
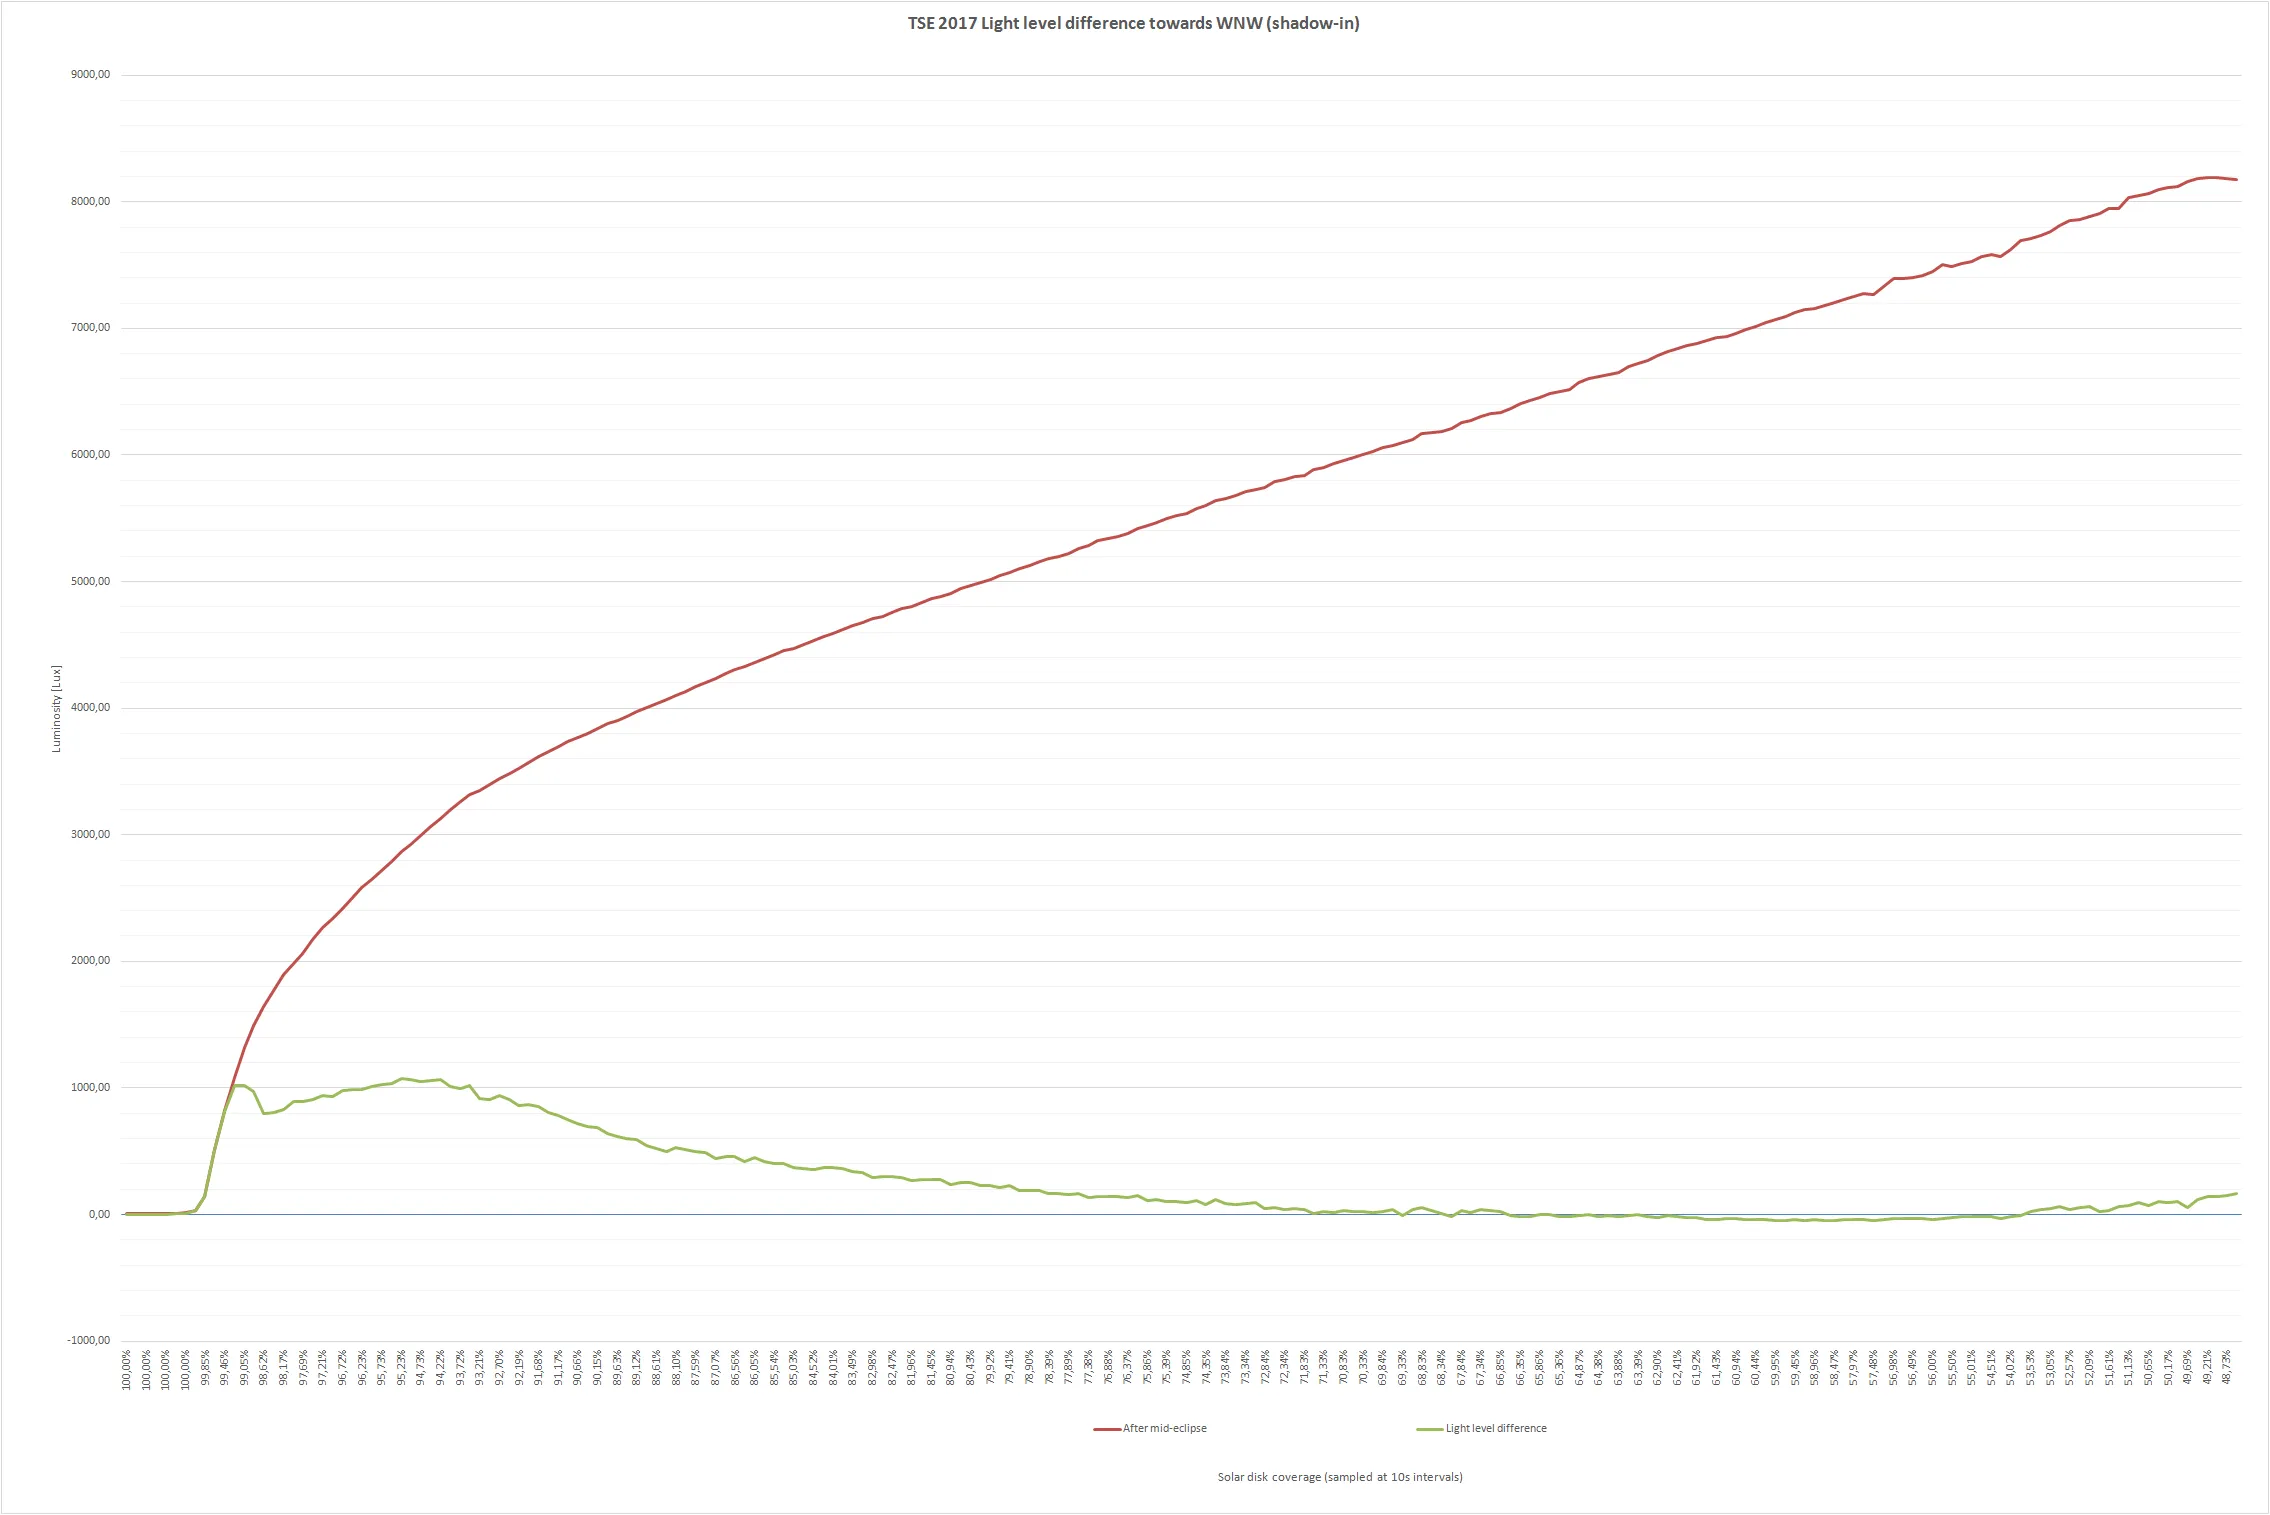
Pic. 36 The light level difference towards the WNW (shadow-in) section of the sky during the 2017 Greatest American Eclipse. Click to enlarge. The chart (Pic. 36) shows the biggest difference ( over 1000 Lx) for 94% obscuration once the umbra appeared in the sky. There is another peak for 99,5% obscuration with a difference of more than 1000 Lx. This is a result of the umbra’s position in the sky just before 2nd contact and just after 3rd contact. In the finish, it’s good to point out another before-after difference arising out of the sun’s position change throughout the eclipse. The shadow-in chart looks more clearly than the shadow-out due to backward scattering. Unlike to northwestern sky, the umbral impact was much less noticeable on the eastern side (Pic. 37). The main culprit was a big aerosol condensation, which caused forward scattering. As a result, the sky remained bright, stifling any deviations of illumination changes. First of all, there is a 1 peak only, where the before-after illuminance difference is almost 3500 Lx. This peak is centered at 99% to 96,5% obscuration. Afterward falls down rapidly to merely 500 Lx reported around 94% obscuration moment. Any difference between before and after the totality becomes visible from around 88% when umbral affection on the eastern sky is magnificent. Comparing other parts of the eclipse there is no before-after difference in illumination level except the sun position change factor. It is visible in the further part of the chart rising up to 3000 Lx at the finish of measurement.
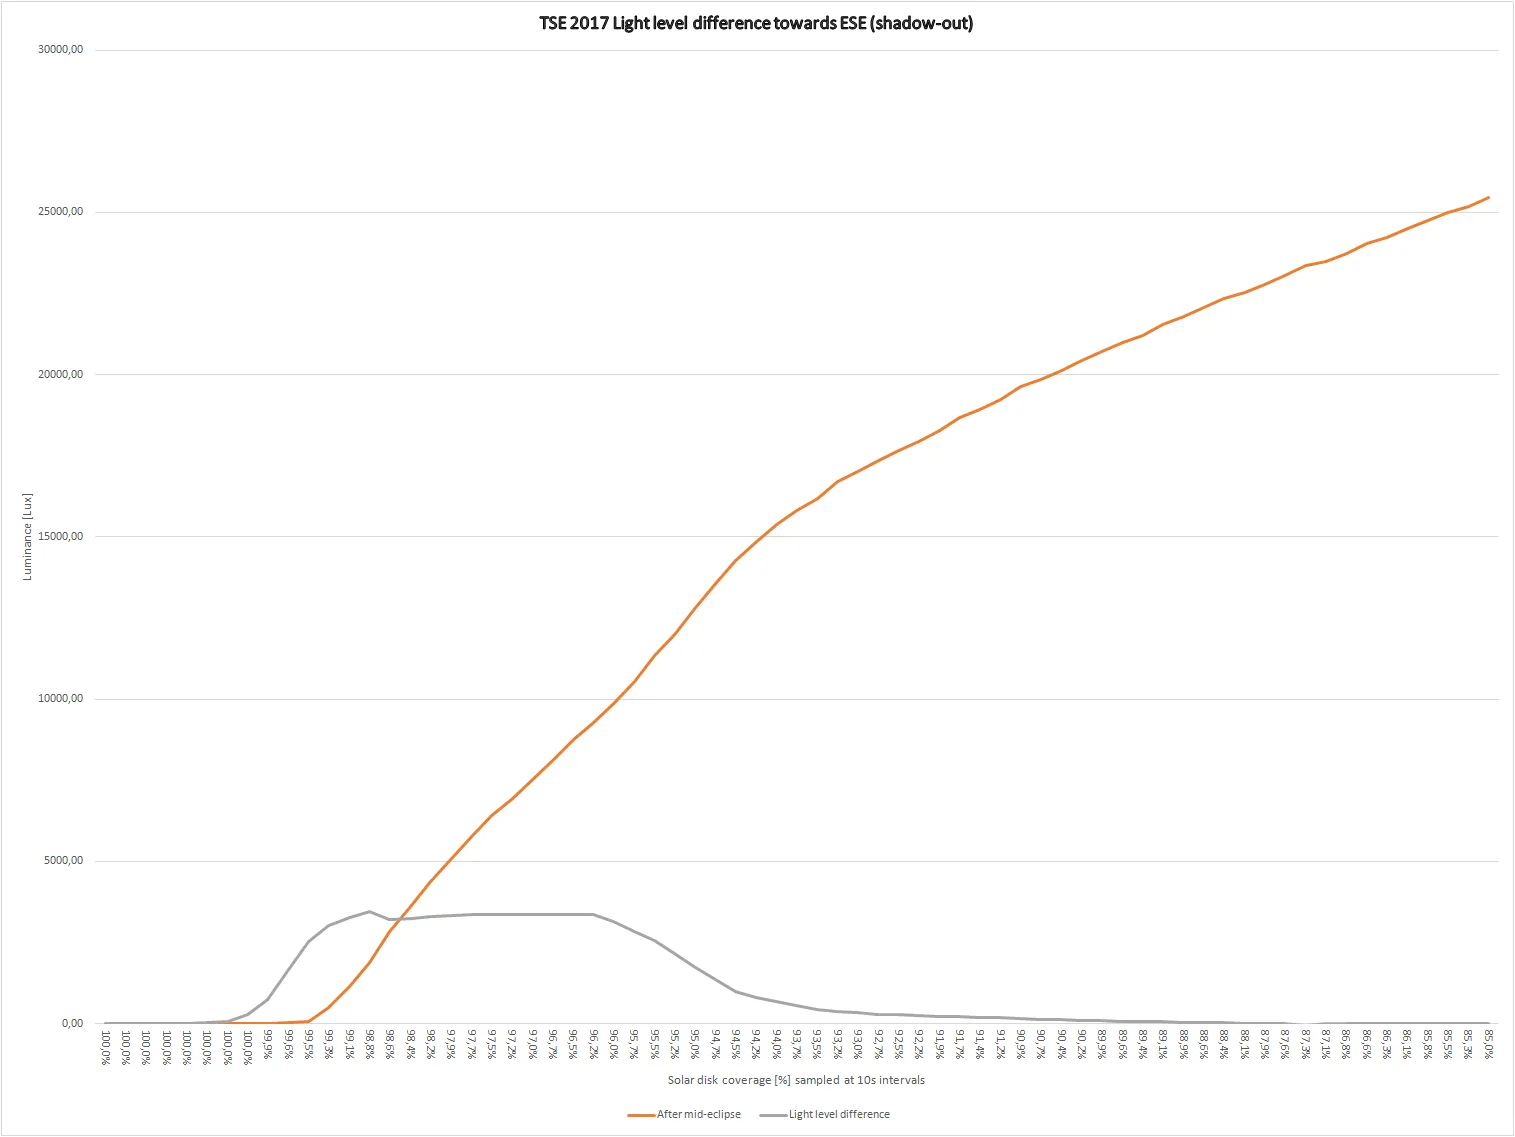
Pic. 36 The light level difference towards the ESE (shadow-out) section of the sky during the 2017 Greatest American Eclipse. Click to enlarge. General light level comparison – looks also intriguingly. Contrary to the mathematical assessments, the mid-eclipse is not the darkest period of the totality (Pic. 38-41). It is an effect of different illumination levels throughout the whole sky sphere including the twilight glow surrounding the lunar shadow. In the beginning, the shadow-out sky was much brighter than the shadow-in due to the solar position of the sky.
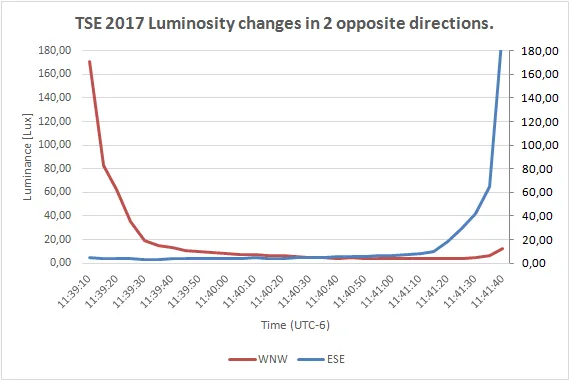
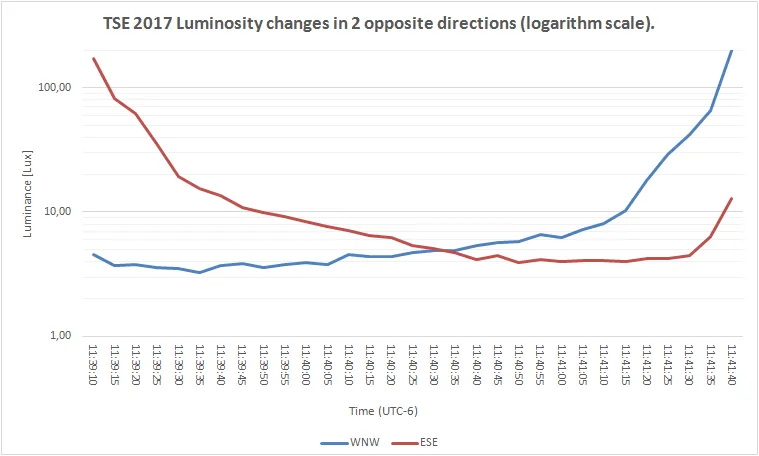
Pic. 38-39 Luminance changes in 2 opposite directions (shadow-in and shadow-out) at the total phase of the 2017 Great American Eclipse, where: 37 – normal; 38 – logarithmic scale. The darkest moment (an illumination balance in both, and presumably all directions) is to be seen about 10 seconds after mid-eclipse. 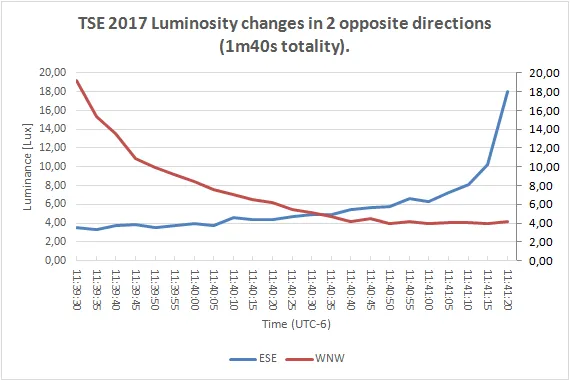
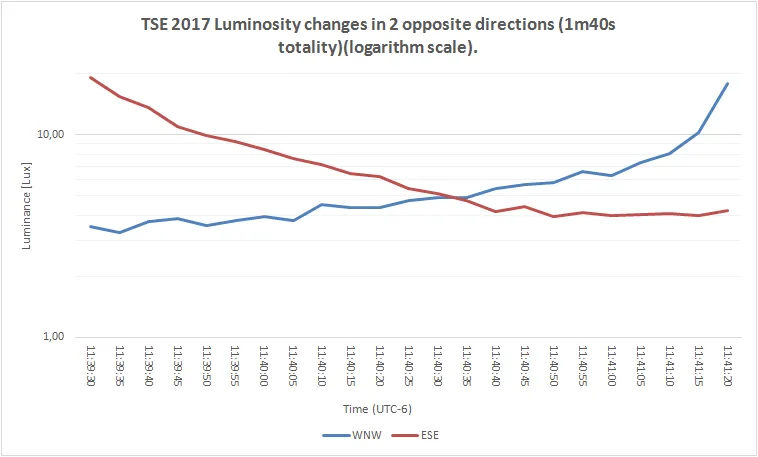
Pic. 40-41 Luminance changes in 2 opposite directions (shadow-in and shadow-out) at the 1m40s of total phase (first and last 20s of totality excluded) of 2017 Great American Eclipse, where: 40 – normal; 41 – logarithmic scale. This situation remained invariant until 1min 25 sec of totality basically. Because already we know, that mid-eclipse is not the darkest moment of the totality is good to know exactly when the peak of the darkness occurs. The chart shows minimal value occurrence for both WNW and ESE sections of the sky, which we can see on the opposite sides of totality. If we know, that the light level of these opposite parts of the sky changes throughout the totality we must find a moment, where these values will be equal. As per the chart, this moment occurred at 1m23s after 2nd contact and 11 sec after mid-eclipse, at 1m00s before 3rd contact. The illumination level for both the shadow-in and shadow-out sky was about 5 Lx. This value corresponds to deep civil twilight. Interesting is also a change just after 3rd contact. For the first 50 seconds after totality, the WNW section of the sky was brighter than the ESE part with a visible shadow cone. After 11:42:20 the illuminance level of the shadow-out sky overstepped the light level of the shadow-in sky. It was the moment when solar obscuration was again 99%. At the moment of equaling the value, according to my smartphone was around 1350 Lx. Afterward, the difference in illumination was the same as in the 1st partial phase.
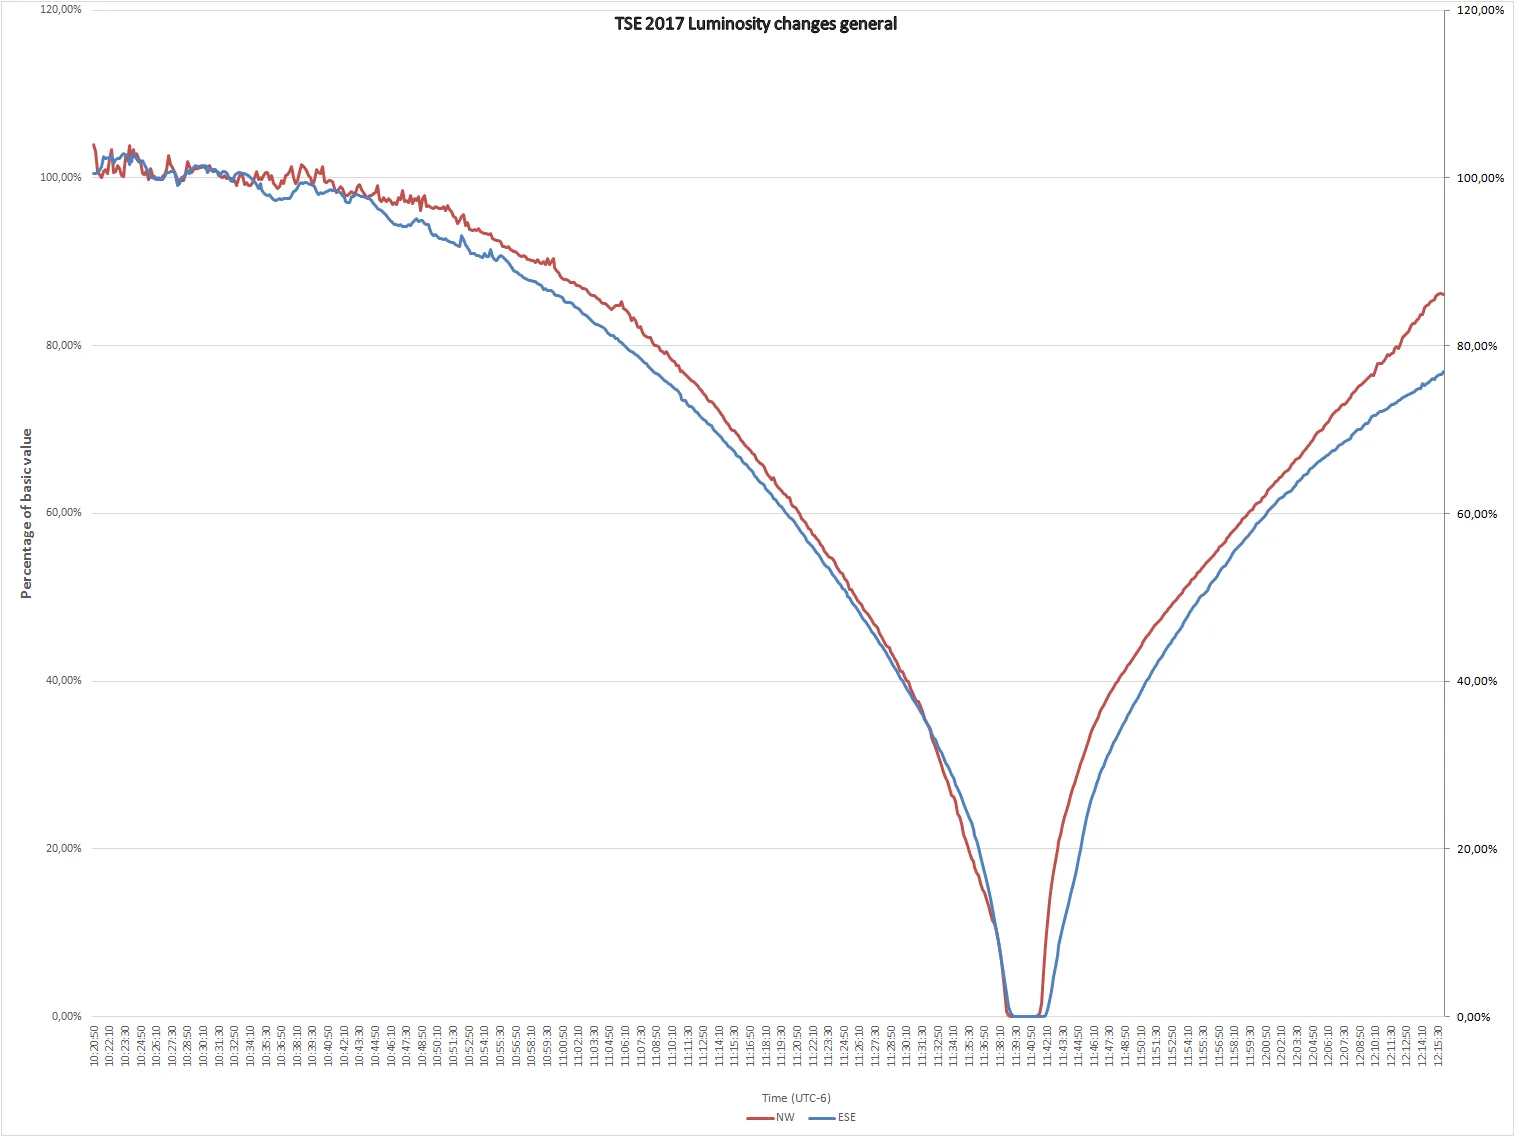
Pic. 41 Luminosity changes during the 2017 Greatest American Eclipse, where the red line shows the WNW (shadow-in) direction and the blue line shows the ESE (shadow-out) direction. Click to enlarge.
5. CONCLUSIONS
The light level measurements of the shadow-in and shadow-out sky show different scenarios of illumination changes. Unlike solar (or presumably antisolar) direction, where illumination changes usually progress symmetrically the other directions show asymmetrical illumination changes. Moreover, the darkening and brightening phenomena are also haze-dependant, because of forward and backward light scattering influence. The shadow-in section of the sky section represents an earlier darkening process with a minimal value just after 2nd contact (20-30sec of totality). Thenceforth sky illumination starts to grow as twilight glow approaches. Significant light level changes are to be observed shortly before 3rd contact when the umbra leaves the measured sky section. Afterward, the illuminance increases likewise normal logarithmic function pattern.
The shadow-out sky is to be the section, with the latest illumination changes process. Contrary, to the shadow-in section of the sky, the 1st partial phase brings a typical light level drop, which increases as the eclipse progresses. A remarkable light level difference can be seen just after 3rd contact when the lunar shadow doesn’t cover the sky yet. Later as totality progresses, the twilight glow edges away decreasing illumination gradually down to 2m05s of totality (15-the 20s) before 3rd contact reaches a minimum value of 4 Lx. Next, the light level starts to increase slowly for around 1 minute, and shoot-up rapidly making the shadow-out sky brighter than on the opposite side. The main role in illumination changes in this section of the sky played a high aerosol concentration causing backlight scattering.
The next aspect of the observation was the significant moments of the light level changes throughout the eclipse. It is found that the shadow-in sky can start darkening when obscuration higher than 70%, considering a hazy day with backward light scattering conditions. Probably under fair weather conditions, this effect can be visible a little bit earlier. The umbra’s presence in the atmosphere should be visible by 86% obscuration, but it is impossible due to atmospheric particles. By 88%, the obscuration observer can spot a significant darkening of the sky when backward light scattering takes place. A real presence of the umbra on the sky sphere has been reported at 94% obscuration for the shadow-in sky and 96.5% for the shadow-out sky, where it was much less visible. I based it on the biggest before-after illumination difference recorded and shown on the charts. A forward light scattering was playing the main role in the shadow-out sky, where the umbral presence was drowned out much quicker. By 93,5%, obscuration light level changes were the same in the before-after relation. The darkest moment occurred 11s after mid-eclipse. This lag was an effect of solar position on the sky (53deg above S horizon), which interacted with overall sky illumination level making it slightly various across the sky sphere. Another fact, that has been observed and measured during this solar eclipse was sky illumination changes due to solar position changes. As the Sun moved westwards throughout the eclipse measurements window the shadow-in sky became brighter, whereas a shadow-out sky is darker than at the beginning. This kind of measurement can be applied both for deep partial and any kind of annular eclipse. Despite the simplicity of the smartphone Lux measures app with a big deviation value, all phenomena associated with the umbral impact of the sky illumination remained visible. These results will be analogous to total eclipses with similar lengths, however, the subject remains open for shorter and especially the longest periods of totality as well as a different moment of the day when this celestial event occurs.
Mariusz Krukar
References:
- Emde C., Mayer B., 2007, Simulation of solar radiation during a total eclipse: A challenge for radiative transfer, (in:) Atmosphere, Chemistry and Physics, vol. 7 p. 2259-2270
- Lee S.H., Lee S., 2012, Illuminance during a solar eclipse with limb darkening: A mathematical model, (in:) Journal of the Korean Astronomical Society, vol. 45, p.111-116
- Mollmann K.P., Vollmer M., 2006, Measurements and predictions of the illuminance during a solar eclipse, (in:) European Journal of Physics, vol. 26, p.1299-1314.
- Shettle E., 1989, Models of aerosols, clouds and precipitation for atmospheric propagation studies, (in:) Atmospheric propagation in the uv, visible, ir and mm-region and related system aspects, no 454, AGARD conference proceedings
- Vollmer M., 2009, Sonnen- und Mondfinsternisse: Beobachtungen, Messungen und Quantitative Modelle, (in:) Praxis der Naturwissenschaften – Physik in der Schule, vol. 58, s. 38-44.
Links:
- Full observation details and description
- Wolfgang Strickling eclipse projects
- Eclipse Droid – an Android application
Read also:
- First time in the shadow
- Light scattering in the atmosphere during the total solar eclipse
- Visual range changes during total solar eclipses
- Deep partial solar eclipse in Scotland
