
“Beast from the east” is the common British expression for the wintry air mass, that comes to Britain mainly from the east or northeast. It happens when a big land-based high-pressure system is coming to Eastern Europe and bringing arctic air mass from north-west Russia (The White Sea or the Ural Mountains) to Central and Western Europe. As an outcome, nearly the whole continent tends to experience very low temperatures. Snow and frost are possible even in the warmest European climes.
I would like to bring you more details about the last British winter, which was the strongest since I started to live in this country. People told me about another one, that brought a stable snow accumulation during the 2012/2013 cold season. Many things are happening and many discussion is rising up due to global warming, which causes severe weather around the Globe.
Causes of strong winter in Europe
In our simple understanding, once the climate is getting warmer, winters should tail off. The situation looks different. Winters are not extinct, but winters change. It is understandable in marine climates, that the coldest month is usually February instead of January inland. However recent winter seasons have shown, that moment with the lowest temperature may occur in late February on the internal part of the continent and even mid-March near the Atlantic. Everyone, who is by no means a meteorologist can notice it.
The basic cause of unusual winters in Europe is climate change in the Arctic. As you learned from geography lessons the weather in the Arctic Ocean is driven by the Polar cell. The air rises to the tropopause near the 60th parallel and next moves poleward. When the air reaches the polar areas, it has cooled and is considerably denser than the underlying air. It descends creating a cold, dry high-pressure area. Next at the polar surface level, the mass of air is driven toward the 60th parallel, replacing the air, that rose from there and completing the polar circulation cell at once.
The outflow of air mass from the cells creates the Rossby waves (planetary waves), which are giant meanders in high-altitude winds. Those winds have a major influence on the weather. The Planetary waves are associated with pressure systems and jet streams (Holton, James, 2004). The polar jet stream is determined by them.
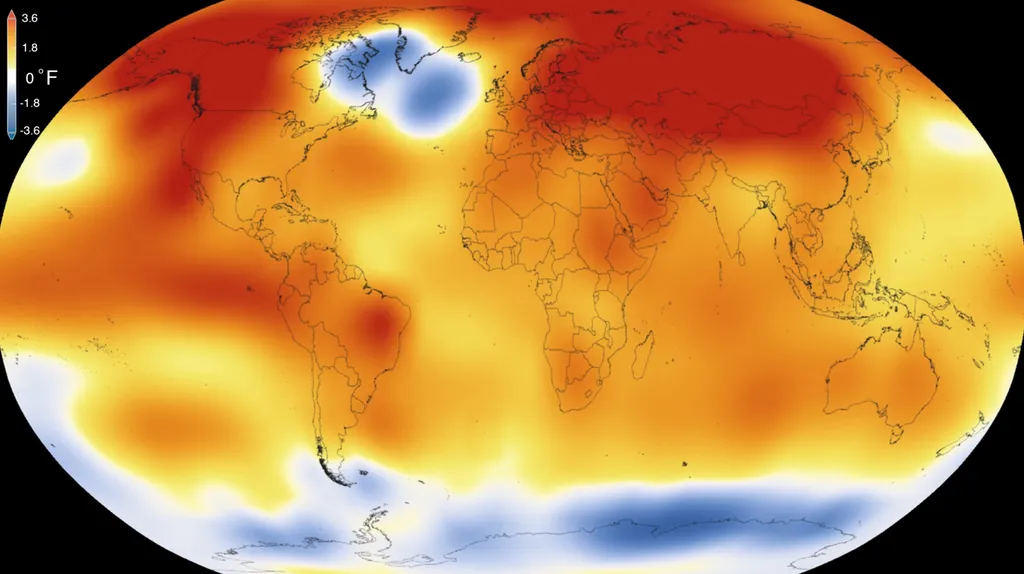
As the climate gets warmer the situation in the Arctic changes. Temperatures there are higher than normal (even 30 degrees above the average!). As a outcome, the ice becomes thinner and more confined (Pic. 1). Let’s have a look at the processes, that arise out of climate change in the Arctic:

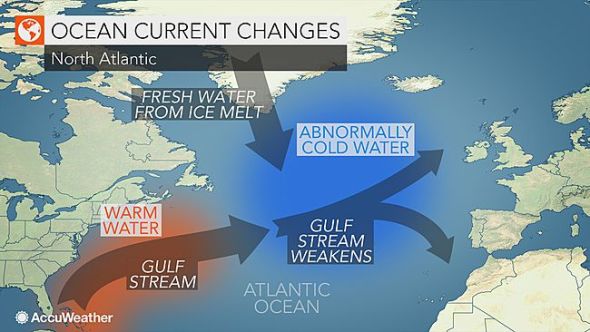
– Cold blob – this is a phenomenon of cold temperature anomaly of ocean surface waters (Pic. 2). How this cold blob is produced?
High temperatures cause the melting down of the Greenland ice sheet, which is possibly related to cold temperature anomalies observed in recent years in Europe and North America. The freshwater, that comes straight from the melted ice sheet decreases ocean water salinity. Due to this process, colder waters cannot sink. As a result, the warmer water supported by Gulf Stream cannot reach the Arctic Ocean. This water becomes colder than normal even halfway of the Gulf Stream around 50 – 60 latitude (Pic. 4). The 2015 example caused a lot of speculations about the further British winters (Pic. 3).

– The waviness of the polar jet stream – is caused by rising temperatures in the polar areas, that destabilize the border between the Polar and Ferrel cells. The jet stream should blow consistently from west to east and keep the cold Arctic air locked in the polar region. Warming the Arctic reduces the termic contrast between Polar cells and Ferrel cells thereby destabilizing the polar jet stream, which starts to meander (Pic. 5, 6).

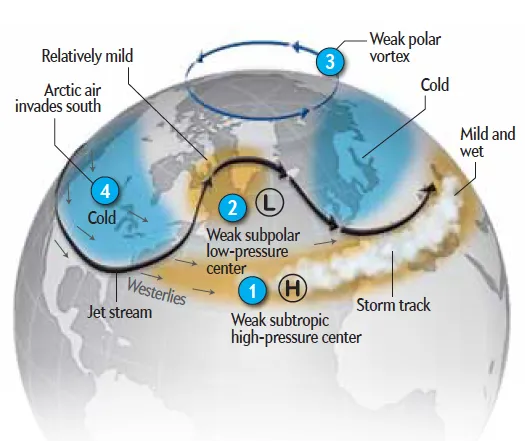
The wobbling polar jet stream allows warmer air masses going poleward and colder air masses southward at once. As the result, we may have much colder winters (or simply episodes) in Europe or North America with much milder winters in the Arctic even with a higher temperature than inside cold mass outbreaks in lower latitudes. Waviness and weakening of a jet stream may also cause extended periods of severe weather like heat waves during the summer, dry spells, etc.


– The air mass circulation changes – The wobbling polar jet stream can disrupt typical pressure systems, which will result in changes in the air mass circulation pushing low-pressure systems poleward and bringing the high pressure outside the Arctic (Pic. 9).

The Arctic warms twice as fast compared to different parts of the world. When the ice sheet disappears the albedo will drop down rapidly making the temperatures much higher. Moreover, alongside rising temperatures, the methane concentration is increasing. This greenhouse gas is one of the major contributors to global warming.
Anyway knowing the basic mechanism of the polar cell and all aftermaths of the climate change in the Arctic we should be aware of the cold temperature anomaly, that may bring an unforeseen cold increase in warmer climate zones.
Last cold waves in Britain – February & March 2018
The best example was last winter in Britain, where in many region temperatures has fallen down reaching almost the lowest values since it has been recorded. It happened at the turn of February and March. Almost the whole of Great Britain has recorded temperatures lower than 0 Celcius. Only the extreme parts of Cornwall, the Isles of Scilly, and the Thames Estuary area were free of frost, although even there ground frost took place. I would like to list the lowest temperatures, that have been measured in a few places across the UK (data from modellzentrale.de):
– Cairngorm Mountains in Scotland: -14
– Snowdonia National Park: -10
– Cambrian Mountains in Wales: -9
– Loch Lomond & Trossachs National Park: -8
– Gloucester: -8
– Bristol: -6
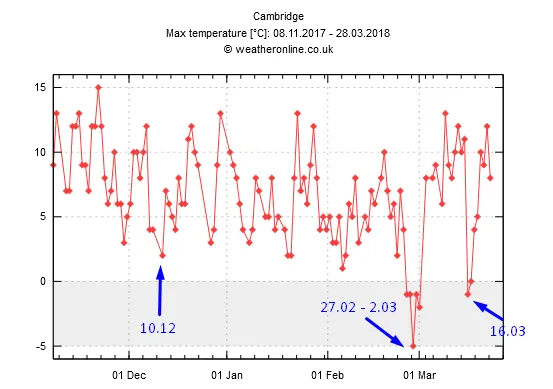
– Cambridge: -6
– Bristol: -5
– Dartmoor National Park: -7
– Penzance: -2
– Land’s End 0
An unusual situation for Britain according to me was a temperature below 0 Celsius even throughout the day! I live in Cambridge, where the temperature from Tuesday, Feb 27 till Friday, March 2 was not higher than -1deg!


Typical “beast from the east” bringing to the UK not only low temperatures but also a lake-effect snowfall. This kind of precipitation is produced when the cold air mass moves across long expanses of warmer lakes or seas (Pic. 13, 14). In the case of Britain, this is the North Sea with water surface temperature around 6-8deg during the coldest season. Those snowfalls are the strongest when reaching coastlines or mountain ranges (Pic. 12).


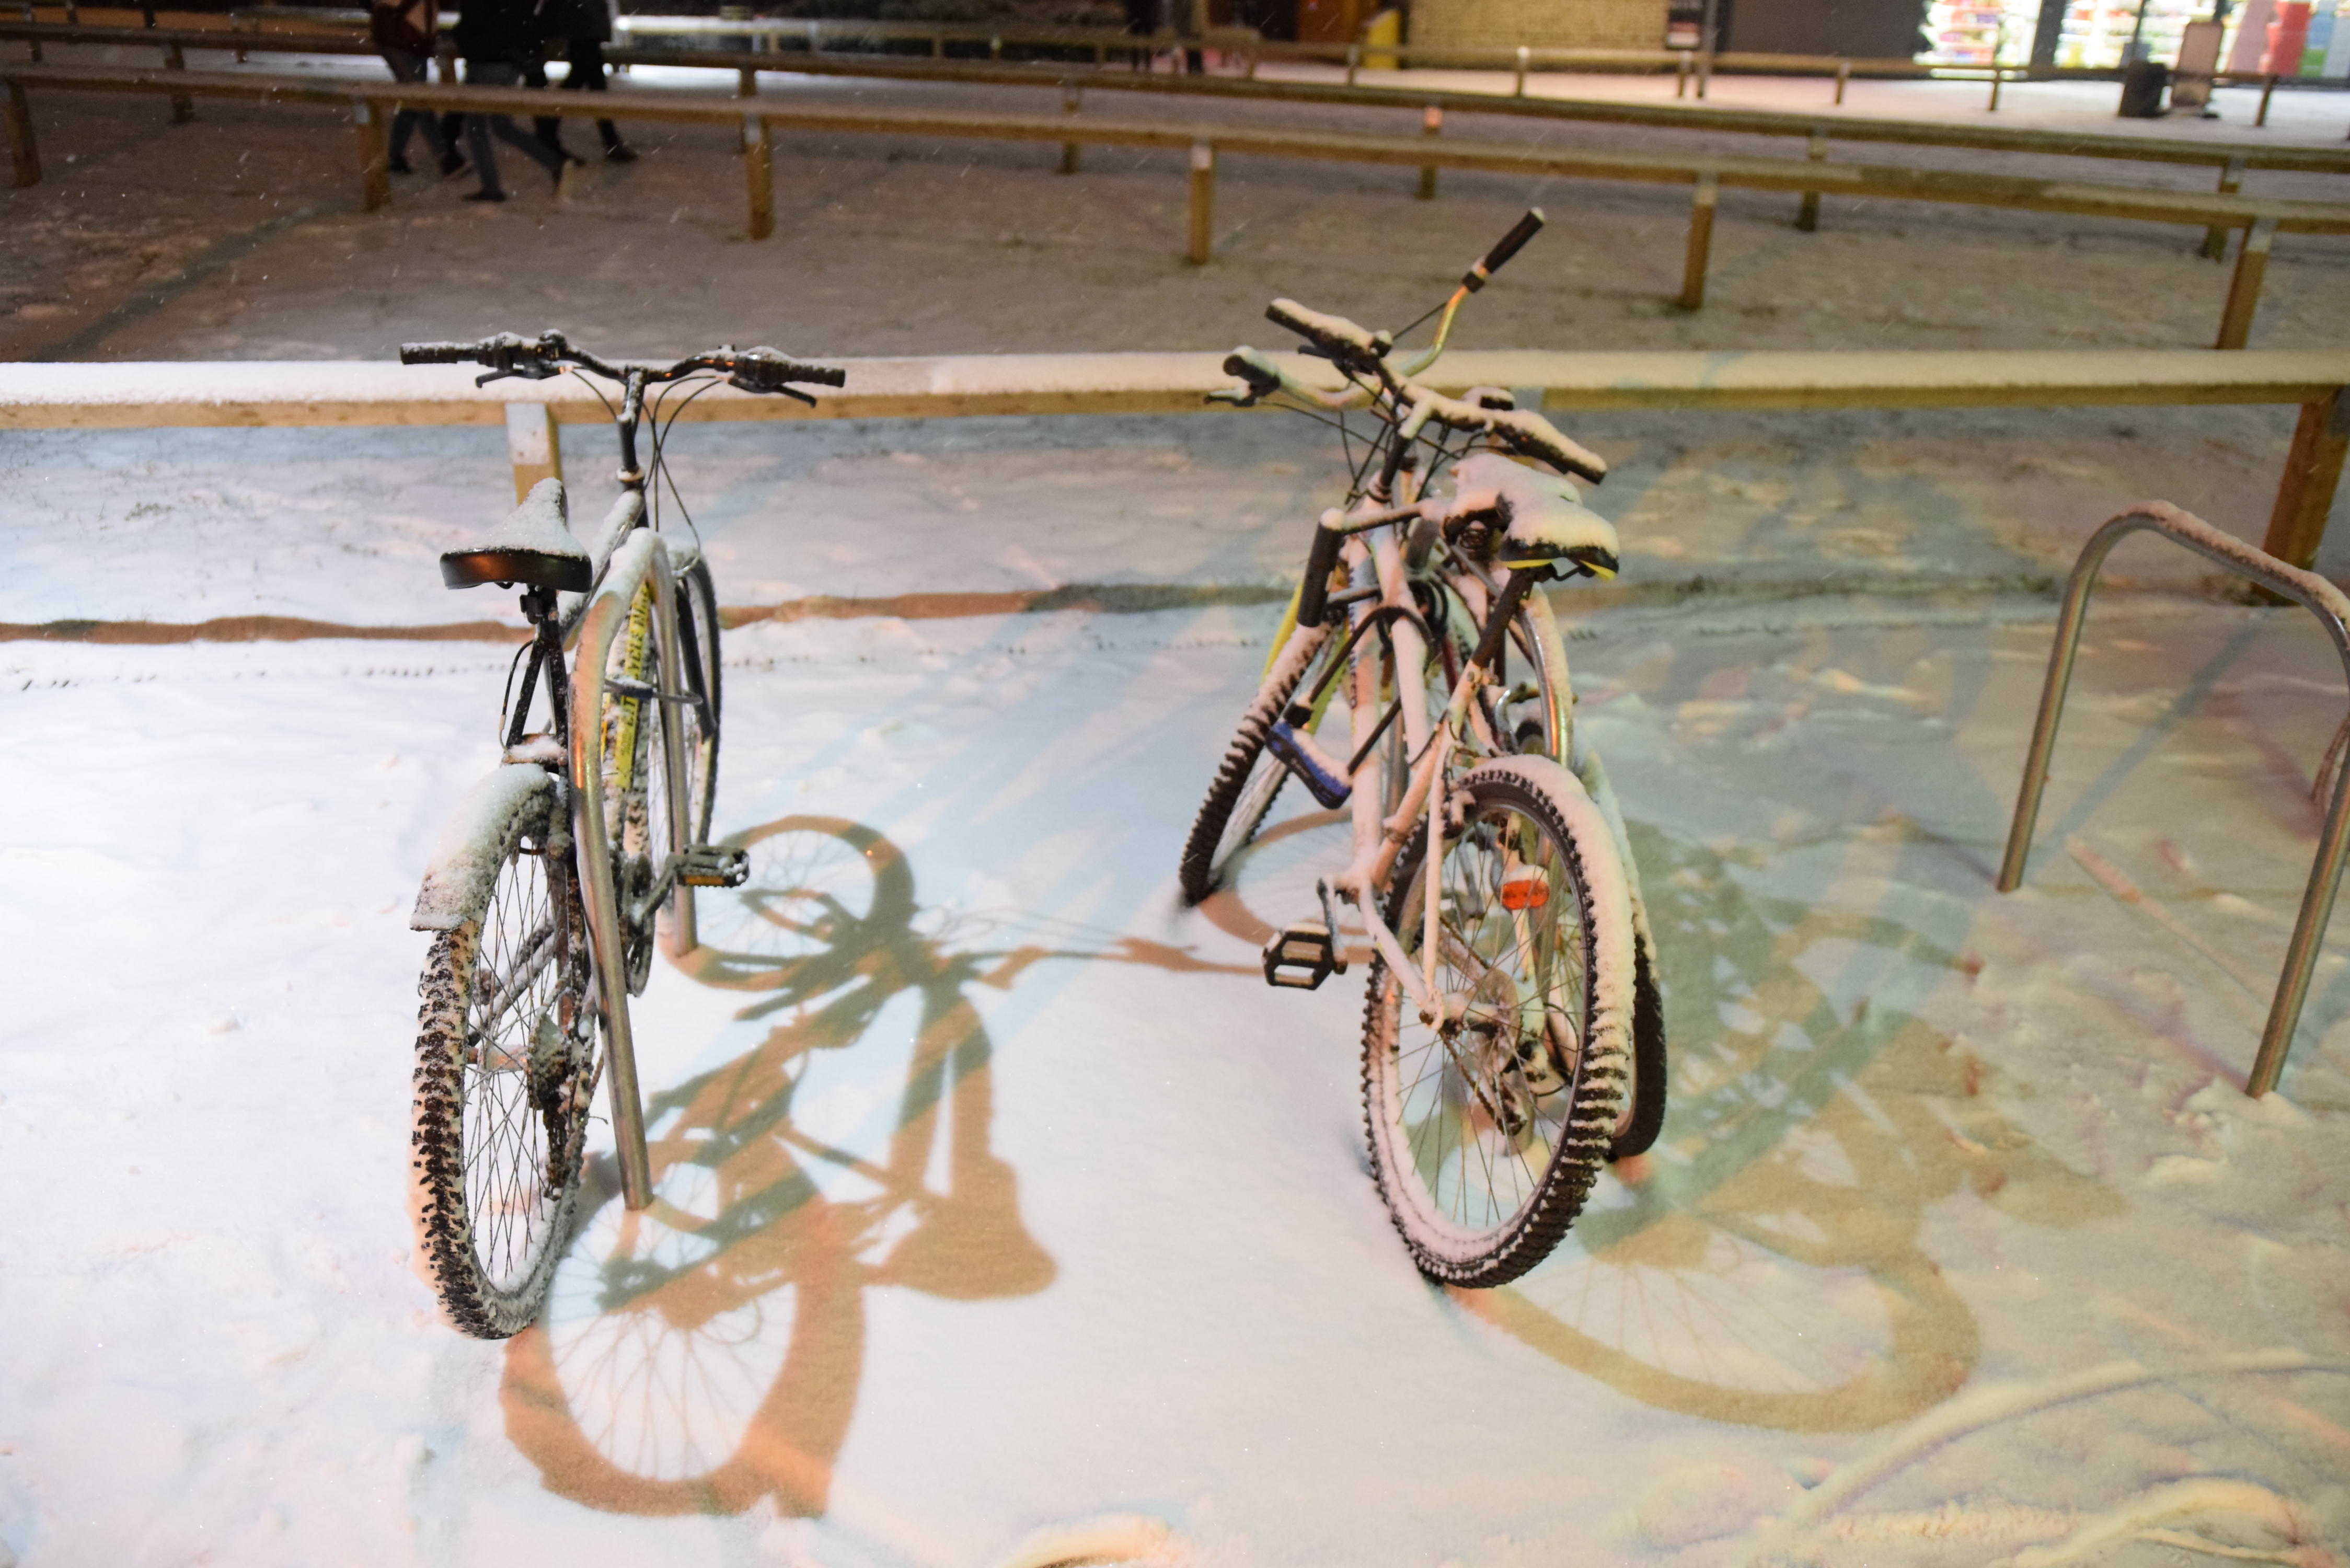
For this instance Cambridge (in general southeast England except for the shoreline) was located in the snow shadow, thereby the precipitation was not too big. We could witness short and intensive snowfalls with building accumulation (Pic. 15, 16).


The situation started to change rapidly on Friday, March 2 afternoon, when a warm front was inching from France. Big snowfalls followed by sleet and consequently rain were observed in the southeast UK corner first. In Cambridge this day remained a really strong winter.


After the night melt came and snow sheets started to disappear so quickly.

This period so-called “first beast of the east” in the February & March winter period brought definitely the hardest winter episode (Pic. 30).

A mild Atlantic air mass came afterward and temperatures rose up to 13 degrees. This spring-looking weather didn’t last long, because after around one and half weeks the UK area was stroke by the “2nd beast from the east”, which was slightly weaker than the previous one. It brought precipitation with snow setting, however, the white sheet disappeared after a dozen or so hours. Unfortunately, the spring progress had been stopped for nearly 3-4 days (Pic. 31 – 34).


The third “beast of the east” cames just before Easter. We are facing it now at the time of preparing this article. Today in Cambridge is heavy rain with small pieces of hail when the temperature drops down to 4 degrees only. Yesterday was colder due to the clear sky (Pic. 35).

Hopefully, this is the last cold episode in Britain during this cold season. We will see.
Last winter in Britain
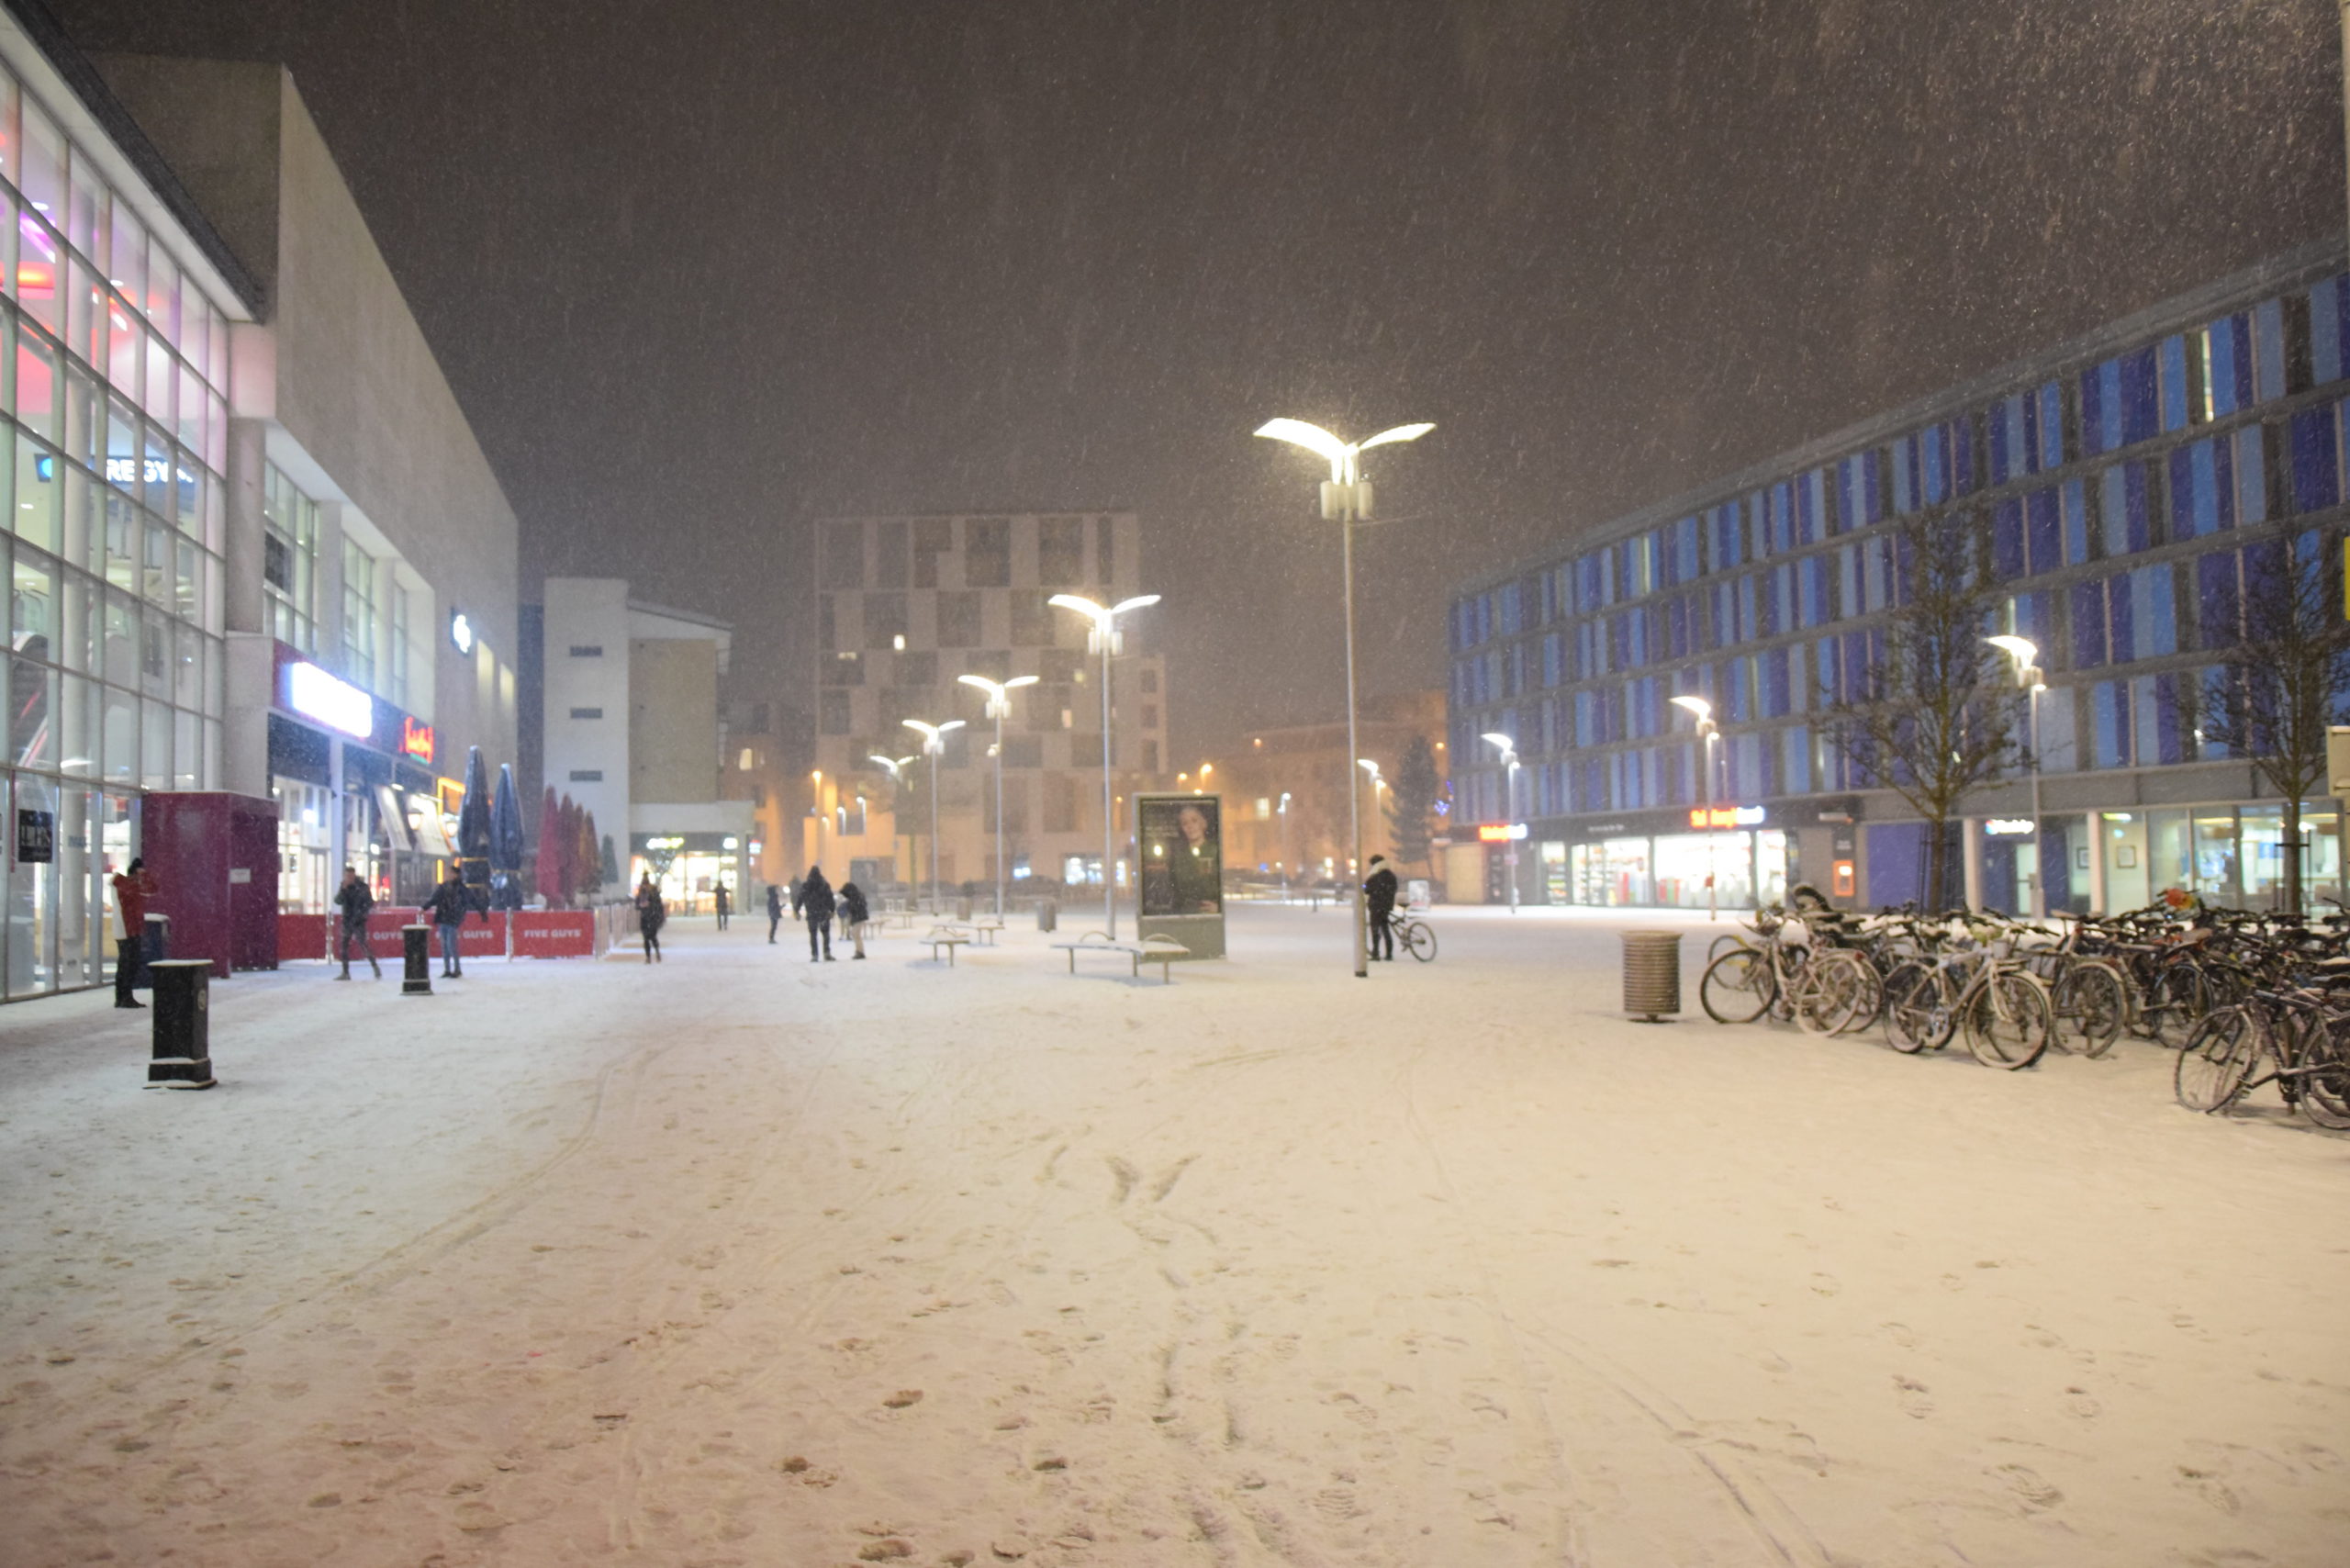
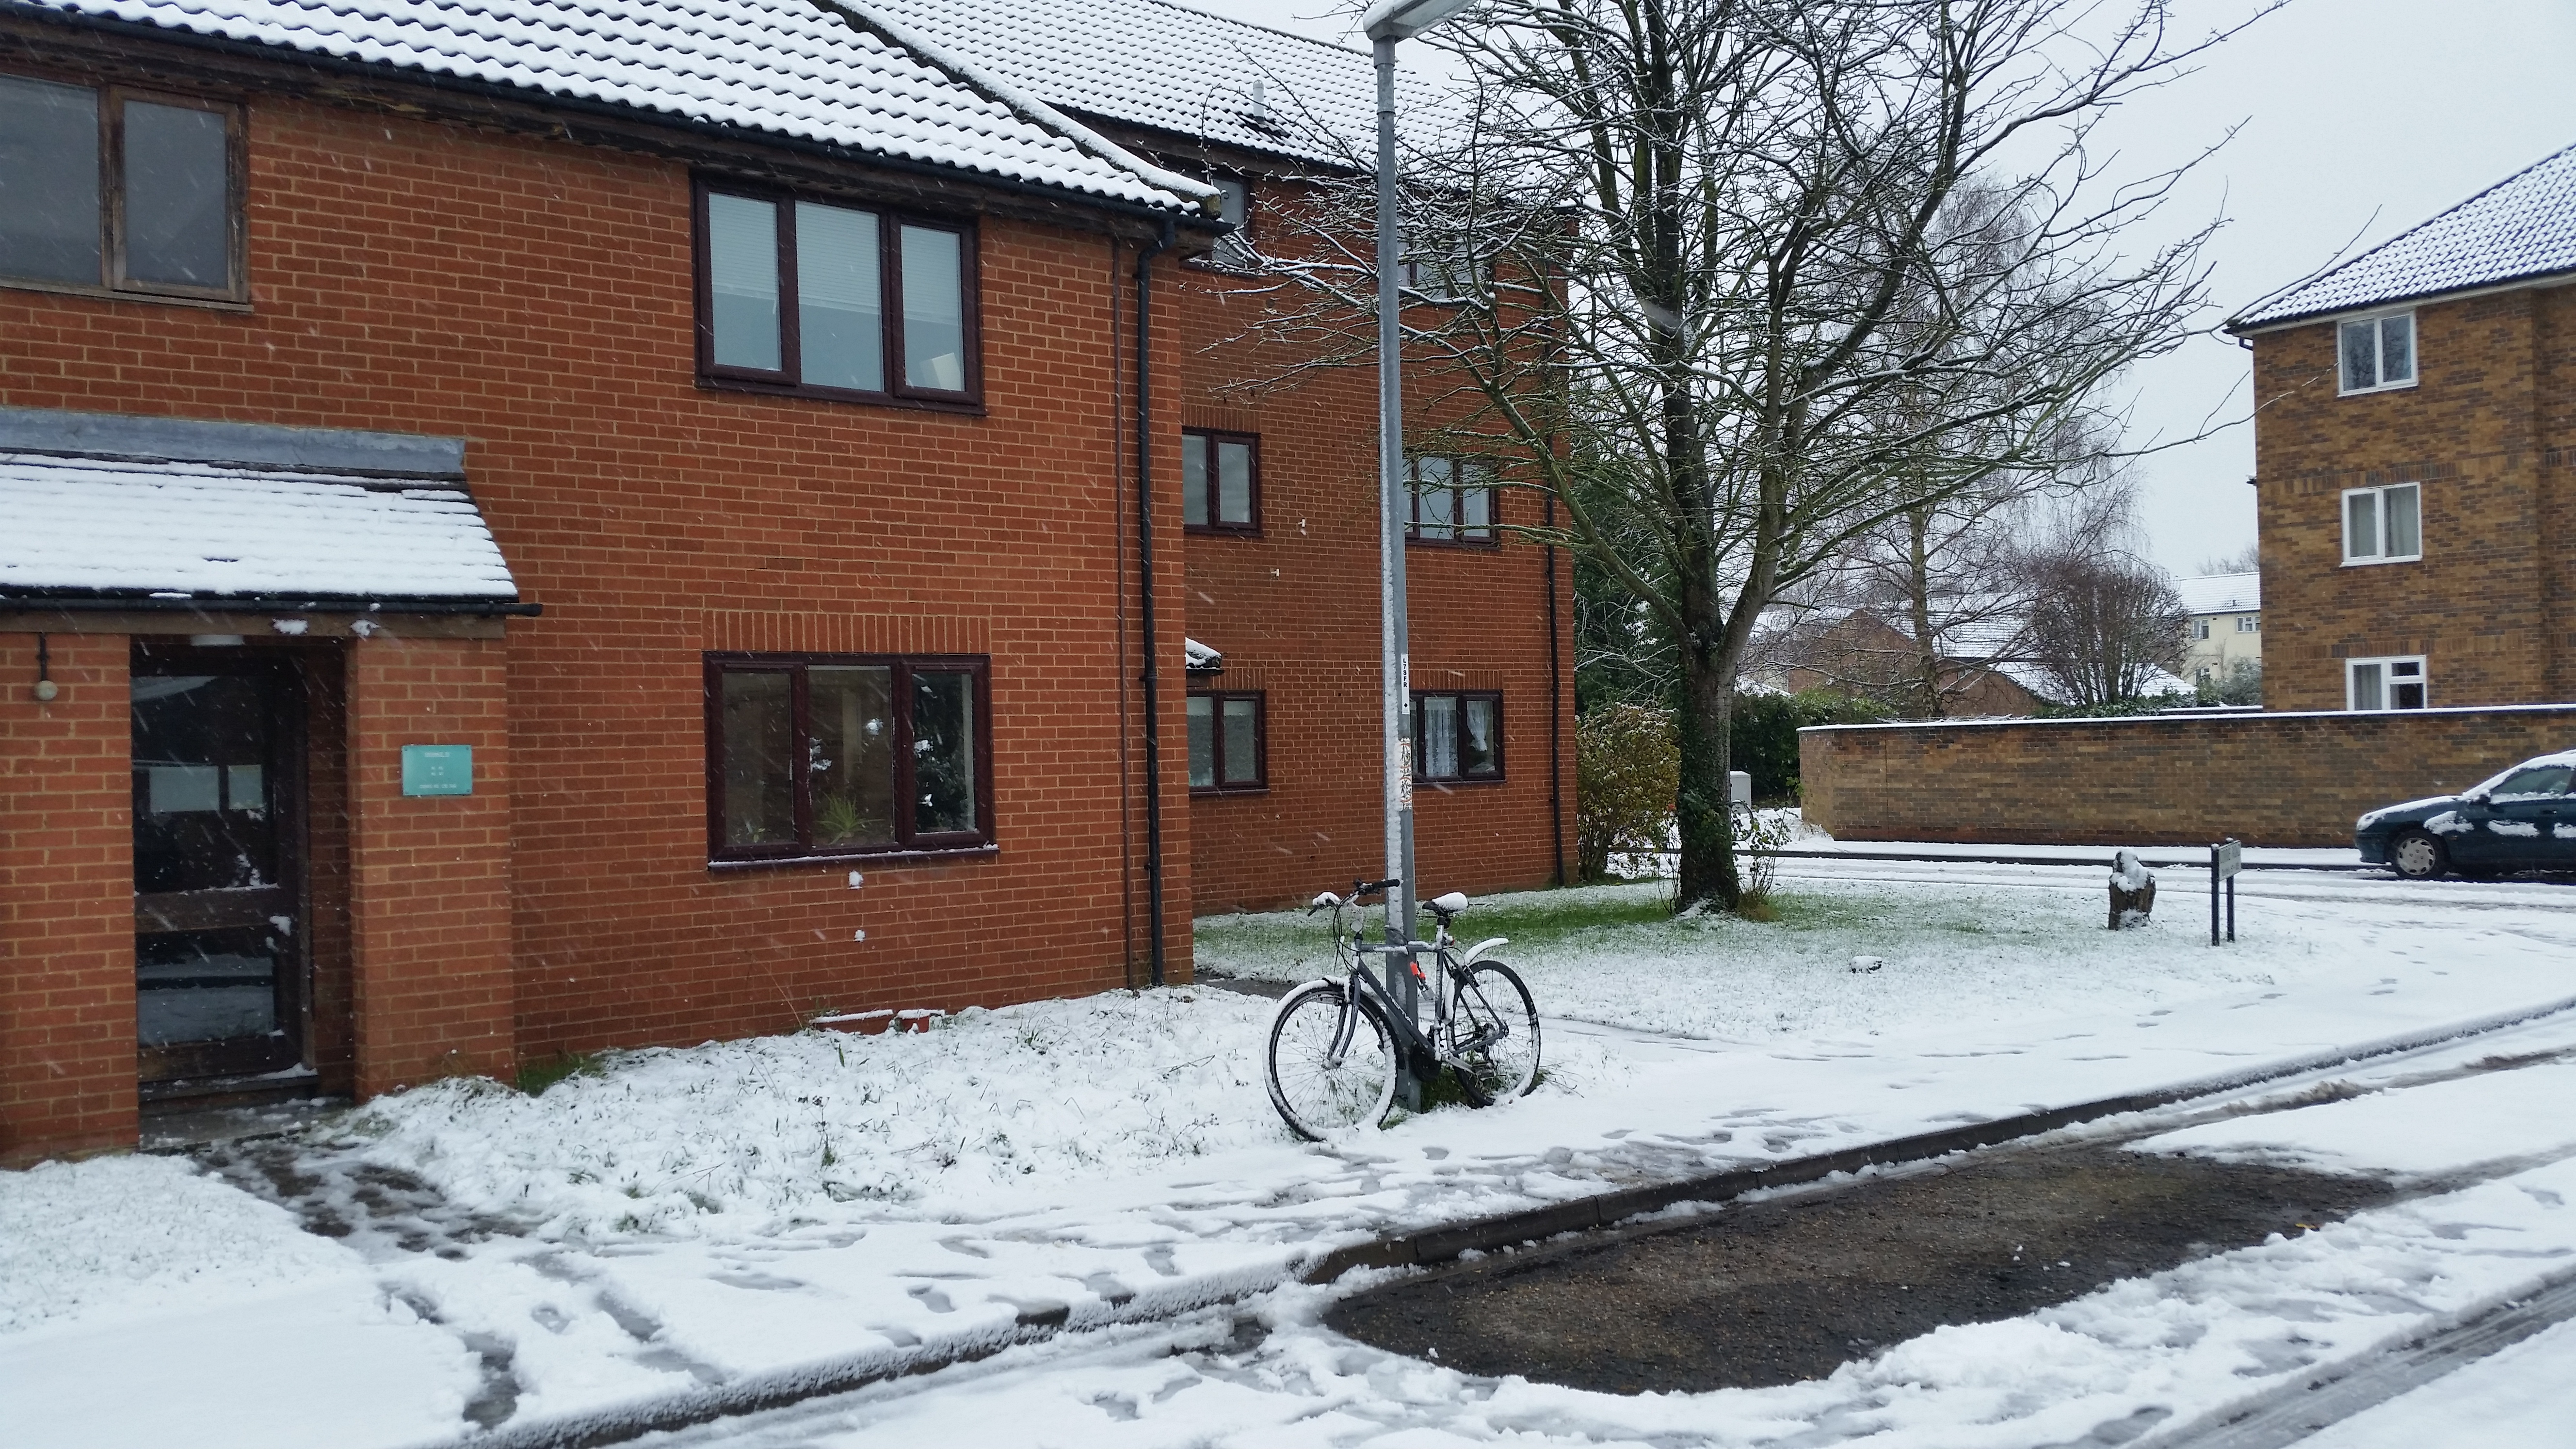
At the finish, I would like to bring some information about the last British winter in general. Media spoke a long time before this cold season, that winter in Britain “is going to be incredible”. Were they right? Possibly! It was the hardest winter, that I have witnessed in England. The first snowfall in Cambridgeshire was recorded on 30th November (Pic. 36), but a much bigger one with serious building accumulation could be seen 10 days later (Pic. 37 – 44).


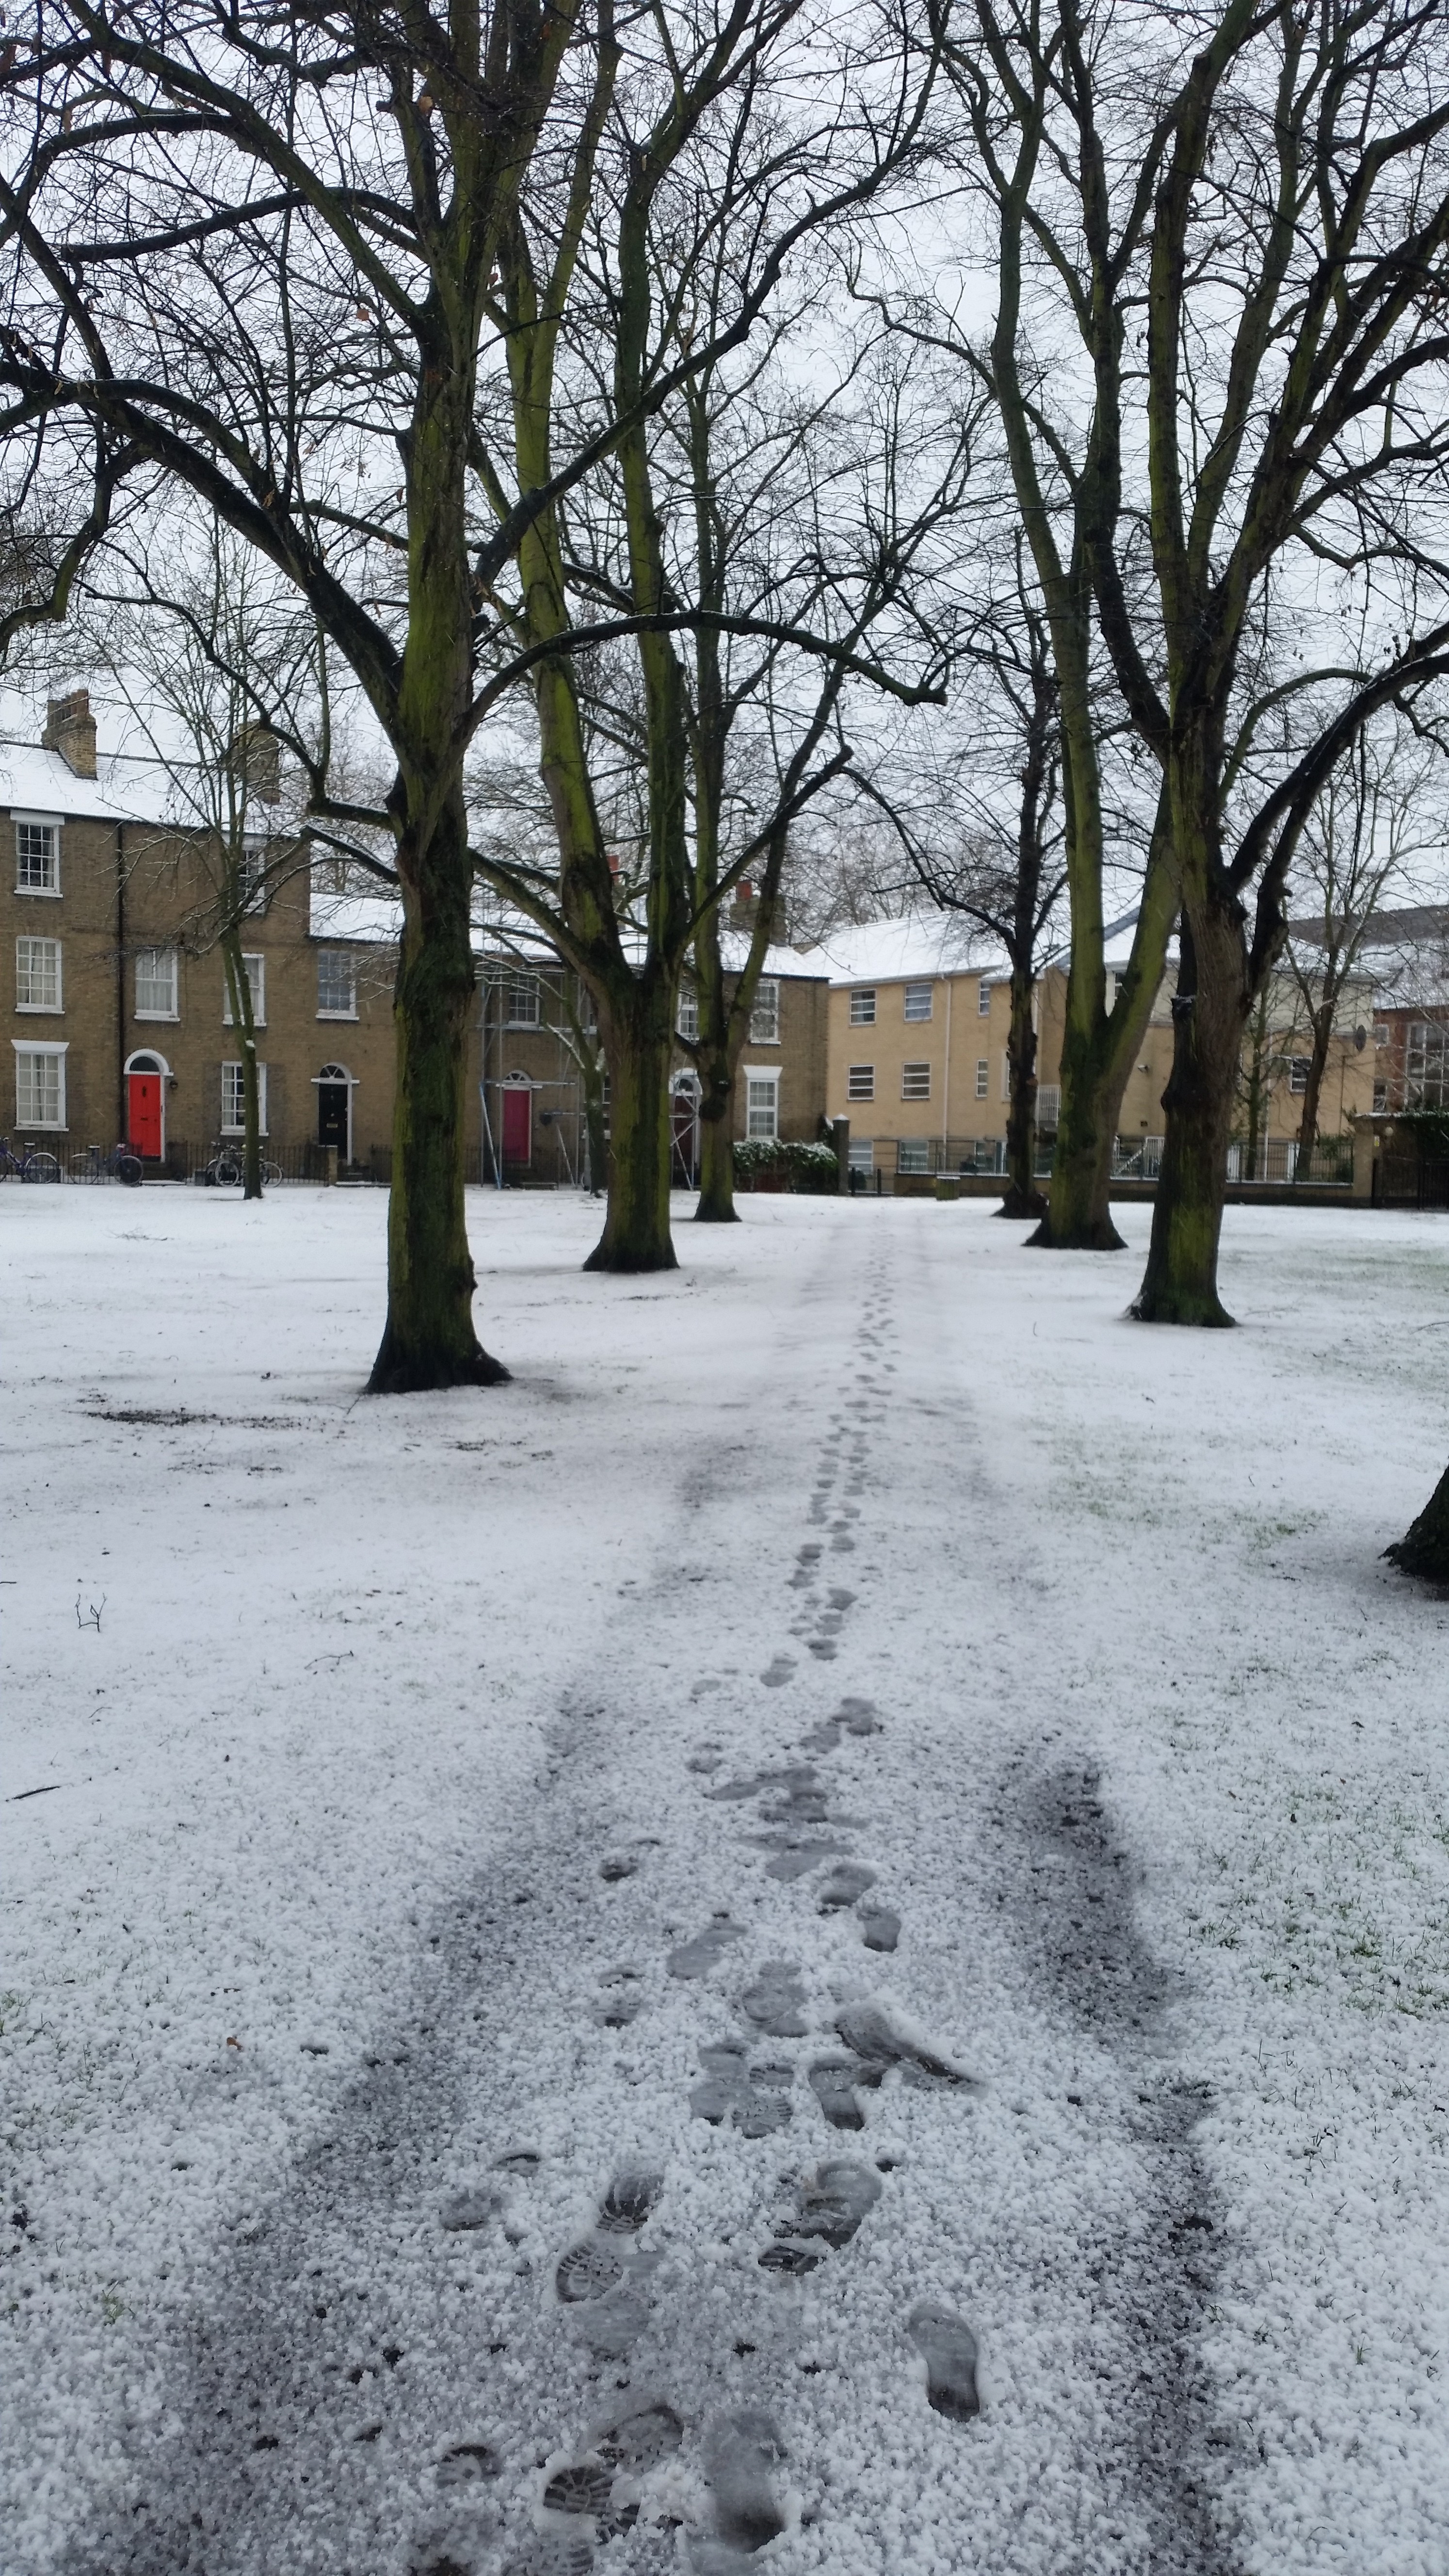


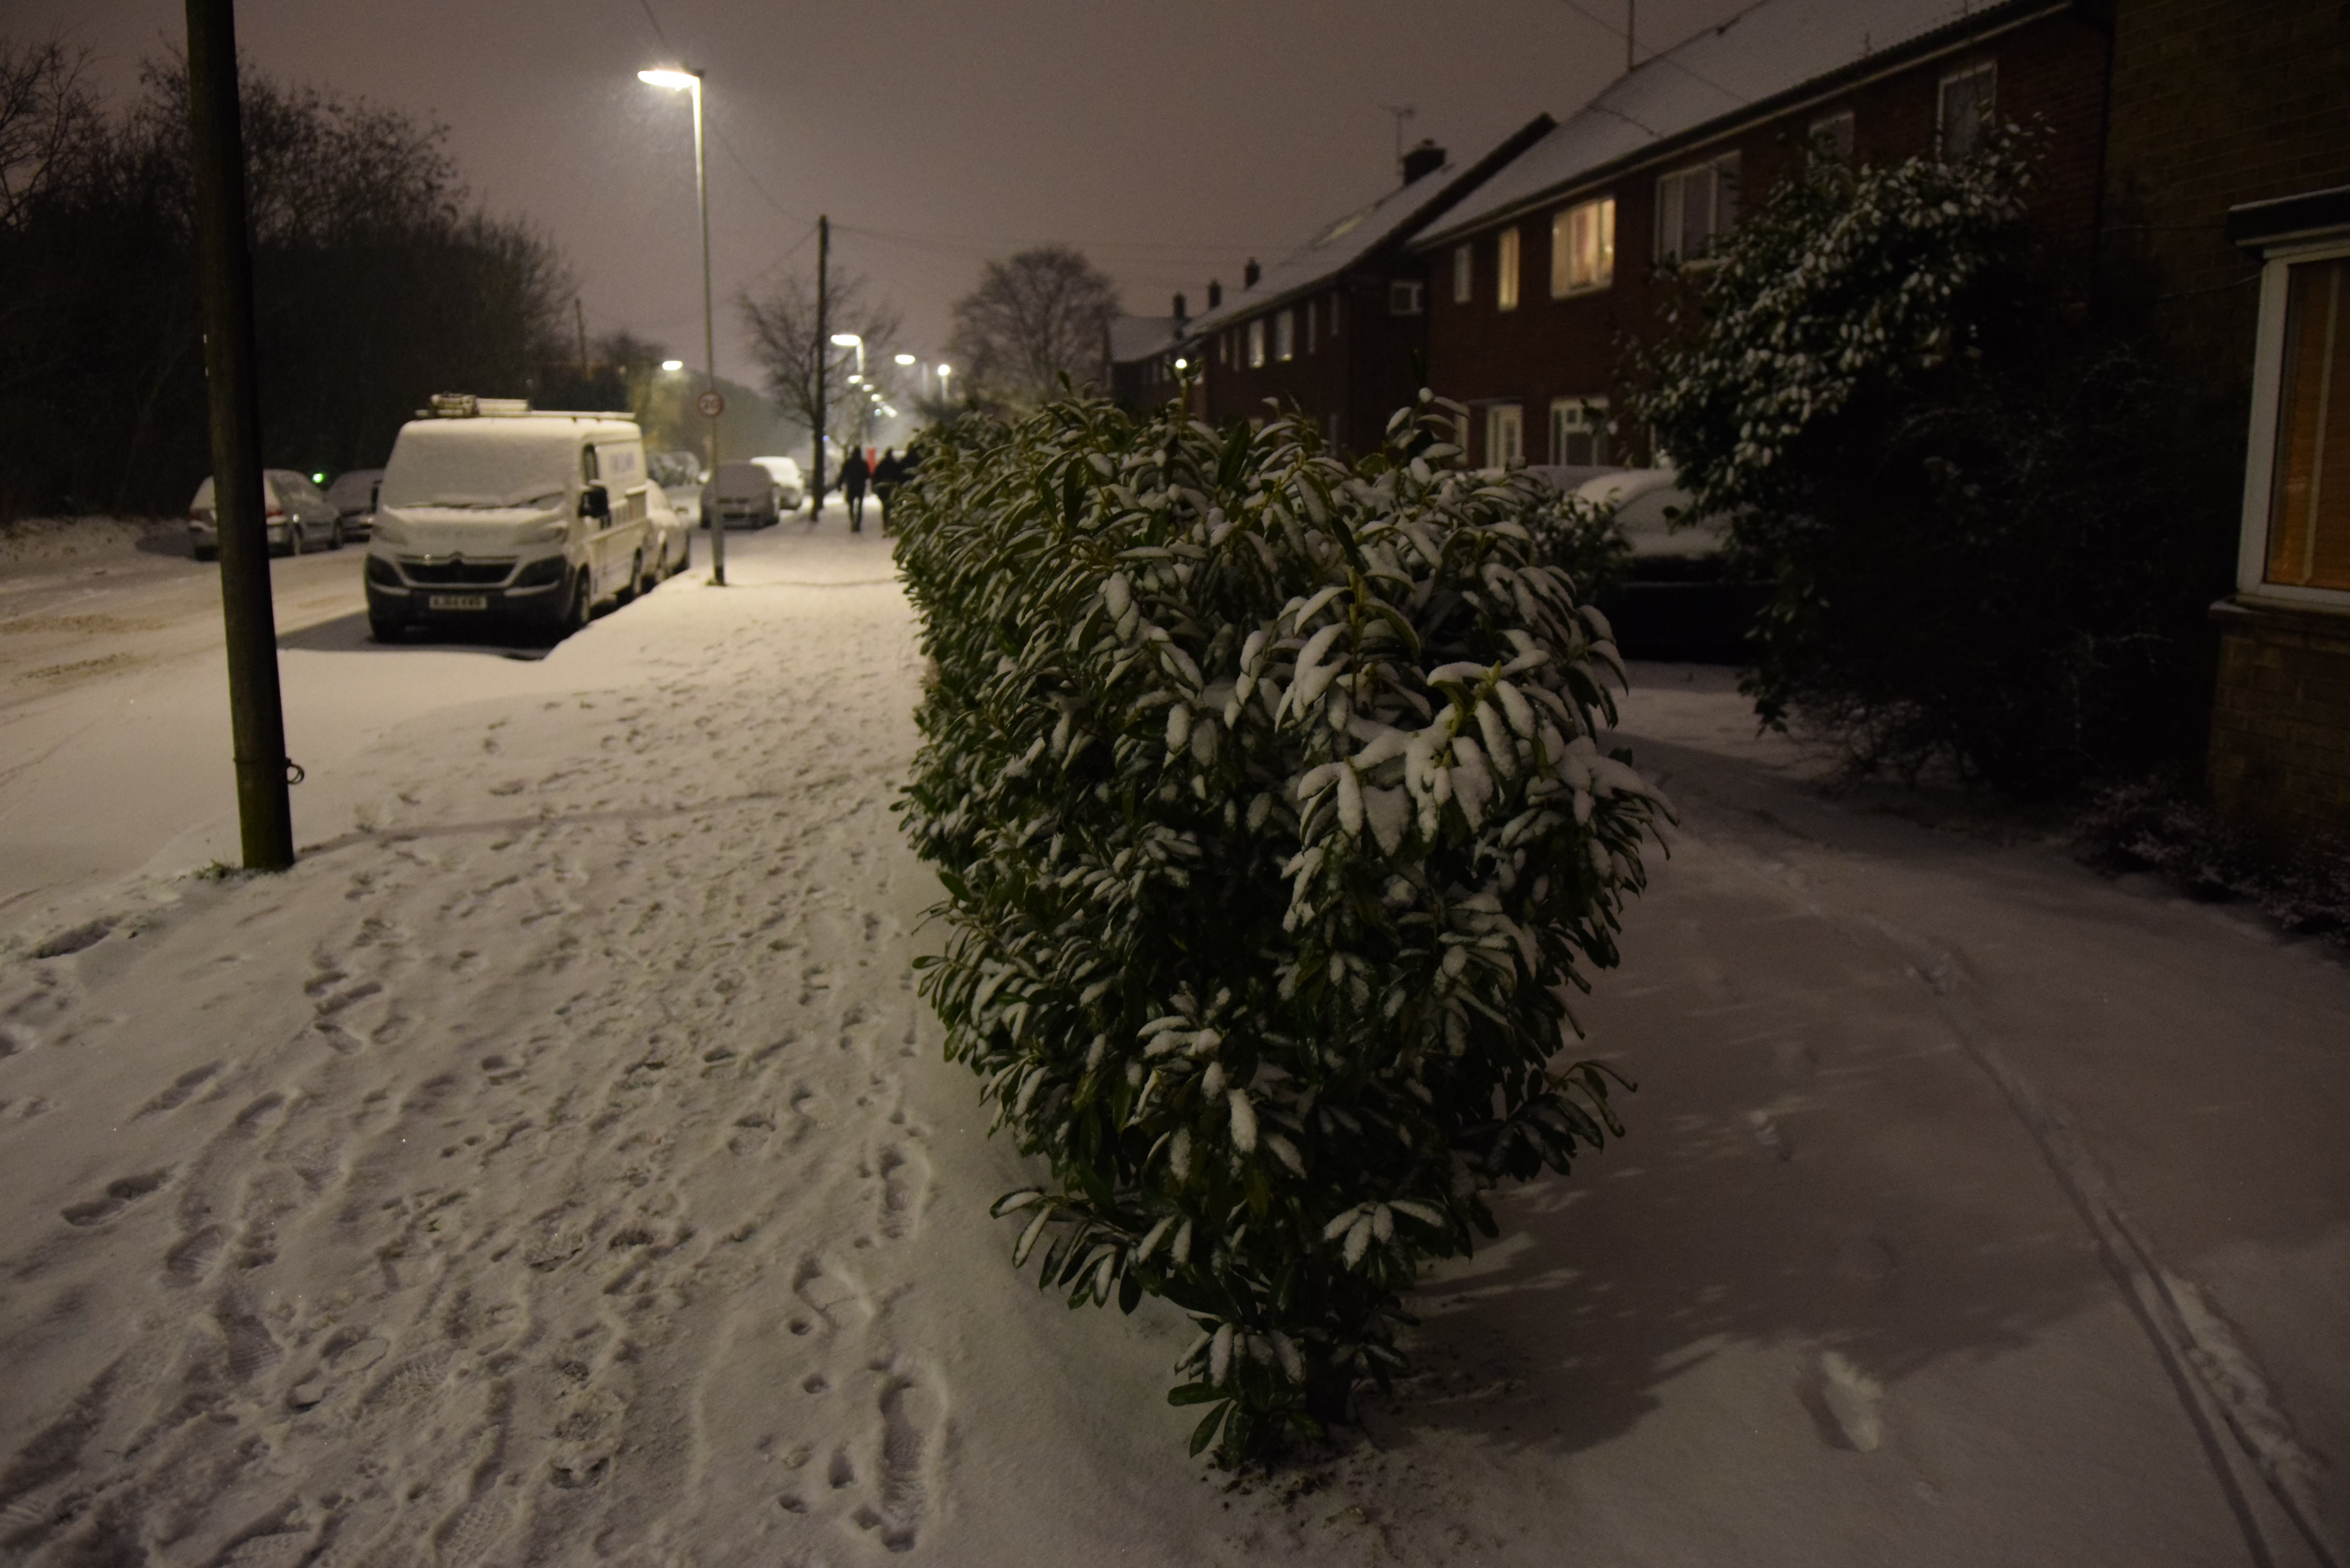
I can say, that Cambridge in snow conditions looks unusual.
Mariusz Krukar
References:
1. Holton J.R., Hakim G.,J, 2014, An Introduction to Dynamic Meteorology, Elsevier Science, Amsterdam, ISBN 0-12-354015-1.
2. Rahmstorf S., et.all., 2015, Exceptional twentieth-century slow down in Atlantic Ocean overturning circulation, (in:) Nature Climate Change, vol. 5, p475-480.
3.Tedesco M., et.all, 2015, Arctic cut-off high drivers the poleward shift of a new Greenland melting record, Nature Communications, vol. 7
Links:
1. Gulf Stream system slowdown and cold blob
2. Climate.NASA.gov: Arctic wintertime sea ice extent is among lowest on record
3. Climate.NASA.gov: Cold snaps plus global warming do add up
4. Climatenewsnetwork.net/
5. Technology.org: Study links 2015 melting Greenland ice faster arctic warming
6. Arctic-news.blogspot.co.uk/
7. Arctic oscillations data
8. Theguardian.com: Arctic warming scientists alarmed by crazy temperature rises
9. Metro: What caused the beast from the east?
10. Metro: Snow at easter likely as the beast from the east refuses to die
11. Theconversation.com: Beast from the east the science behind Europes Siberian chill
12. Metoffice.gov.uk: February & March 2018 – snow
13. Metoffice.gov.uk: March 2018 – statistics
14. North Atlantic cold blob in January 2017
15. Accuweather.com: North Atlantic cold blob could affect Gulf Stream weather in eastern Europe and the US
16. Insideclimatenews.org: Cold weather polar vortex jet stream explained global warming arctic ice climate change