
In this article, I want to demonstrate to you some shortcut, which is a product of two traditional ways of collecting the elevation data for any project in QGIS.
The first way of collecting the elevation data in QGIS is by downloading and using the Digital Elevation Model from which this particular data can be extracted easily. The second way seems to be slightly longer, as a user needs an additional tool, which is Google Earth. By using this simple application with the terrain mode turned on, the elevation data can be assembled without a problem. There is in fact one demerit of this way, which is the protracted drawing of the line back and forth across the area in which we want to get the data (Pic. 1).
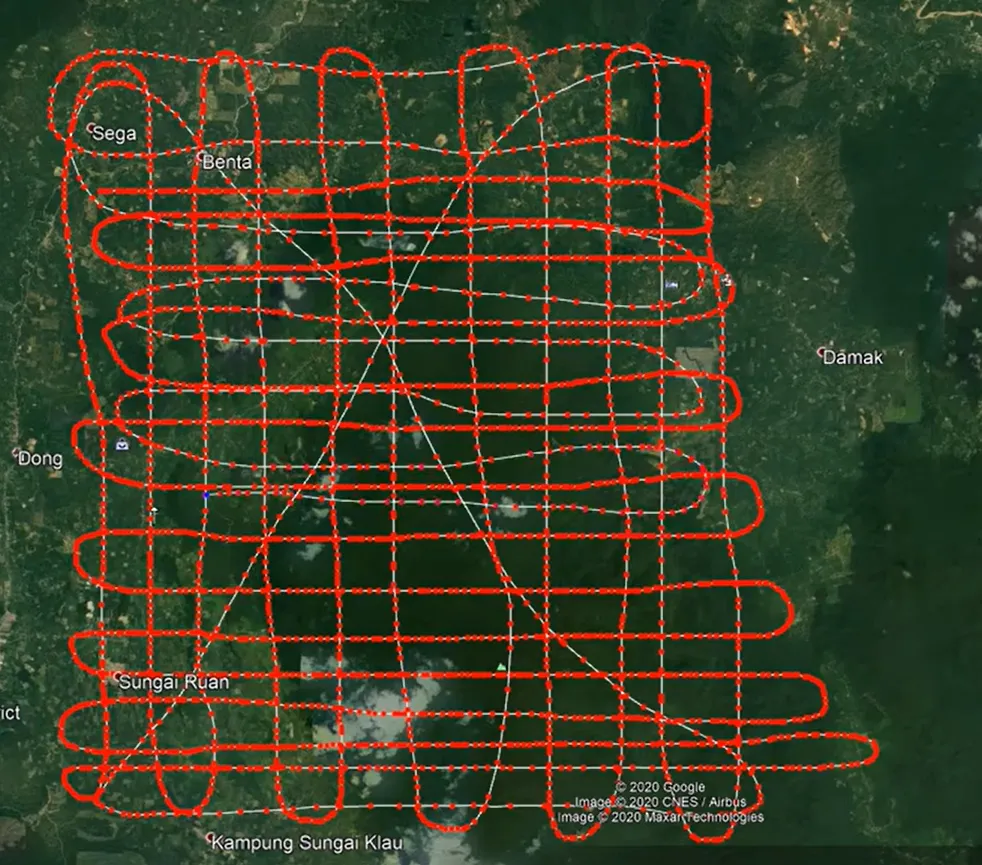
Obviously, we want to get as much detailed elevation data as possible, therefore the number of these points must be enormous at some point. It must take time to get them by drawing the shape like this.
Therefore I’ve decided to raise this issue in this paper by acquainting you with a much quicker method of elevation data collection.
Firstly let’s consider instances such as this. The elevation file from Google Earth must be saved in the .kml format, which is converted to the .gpx file thereafter. Along with the conversion, the elevation data is added. Everything is advised to be done by the GpxVisualizer tool, which appears to be the handiest open-source web-based tool for manipulation with .gpx files.
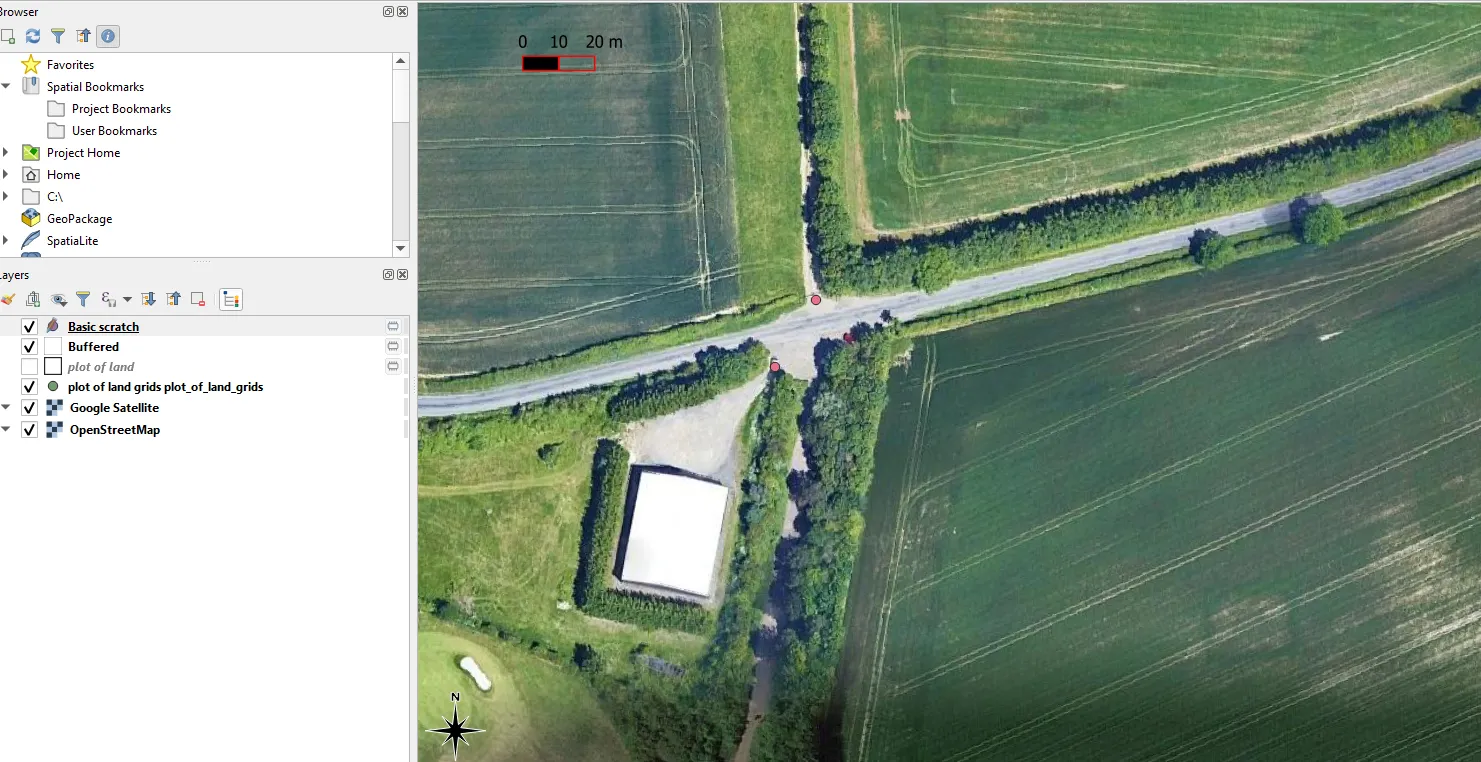
Let’s see two types of .kml file input: produced by Google Earth and produced outside of Google Earth – in QGIS. Both show two points in almost exactly the same places (Pic. 2, 3). The first one represents the simplest line produced in Google Earth, and the second one is just two points representing the scratch point layer in QGIS exported further as the .kml file.
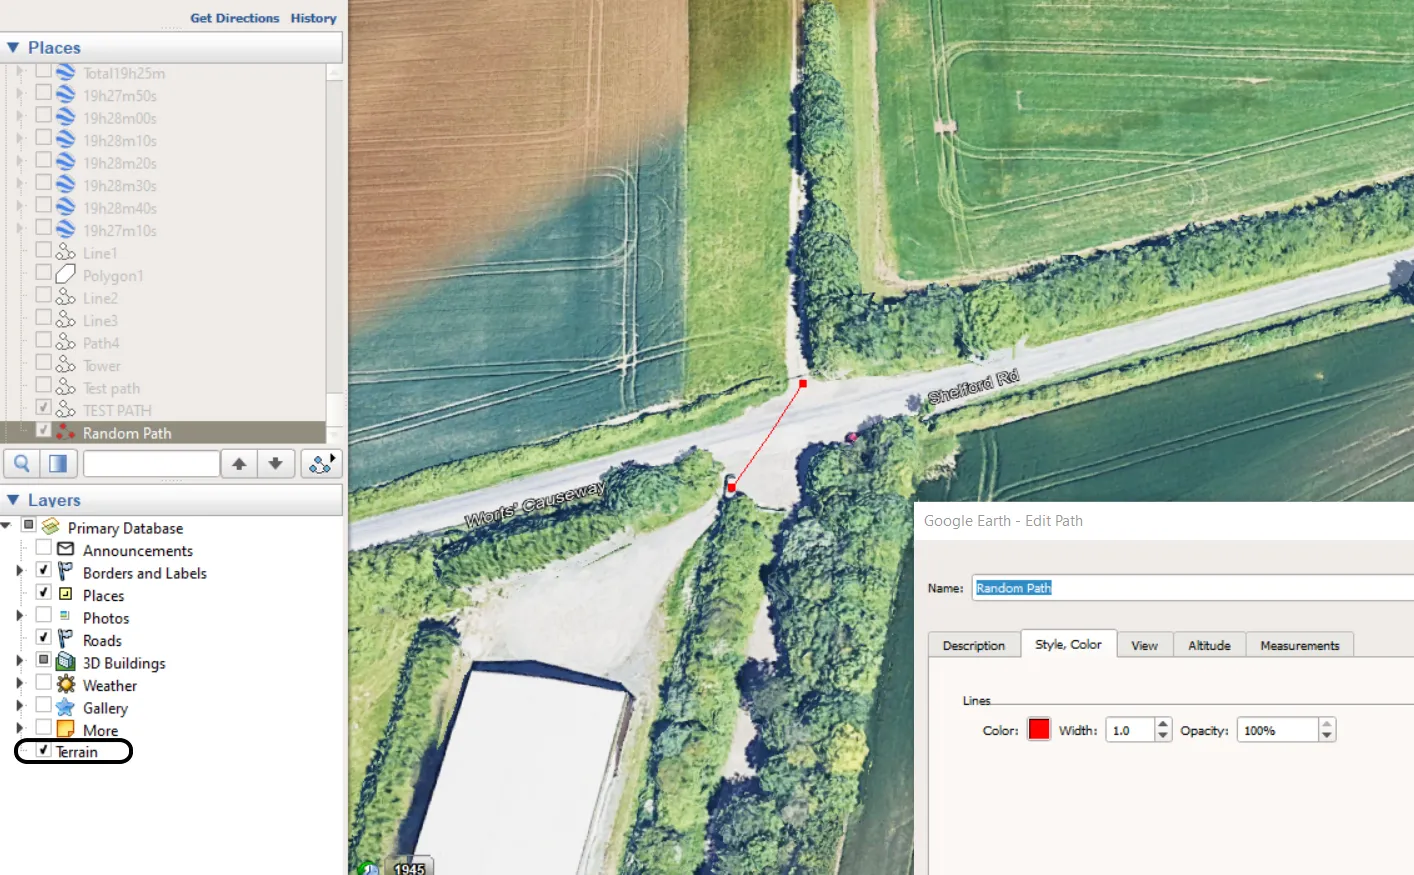
Both files have been exported to the .kml file, where the Random path .kml was the Google Earth output and Random path2.kml was created by the QGIS scratch layer.
Next, as per many tutorials, both files have been uploaded to GPS Visualizer for the .gpx conversion with the “add elevation” option. Afterward, both have been downloaded and opened in the Notead++ application (Pic. 4).
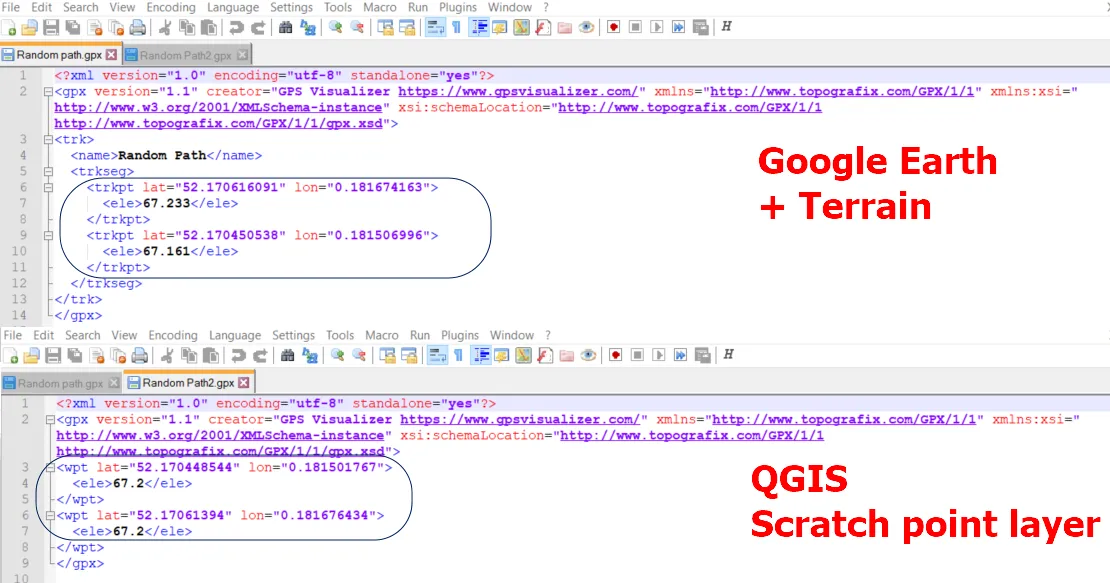
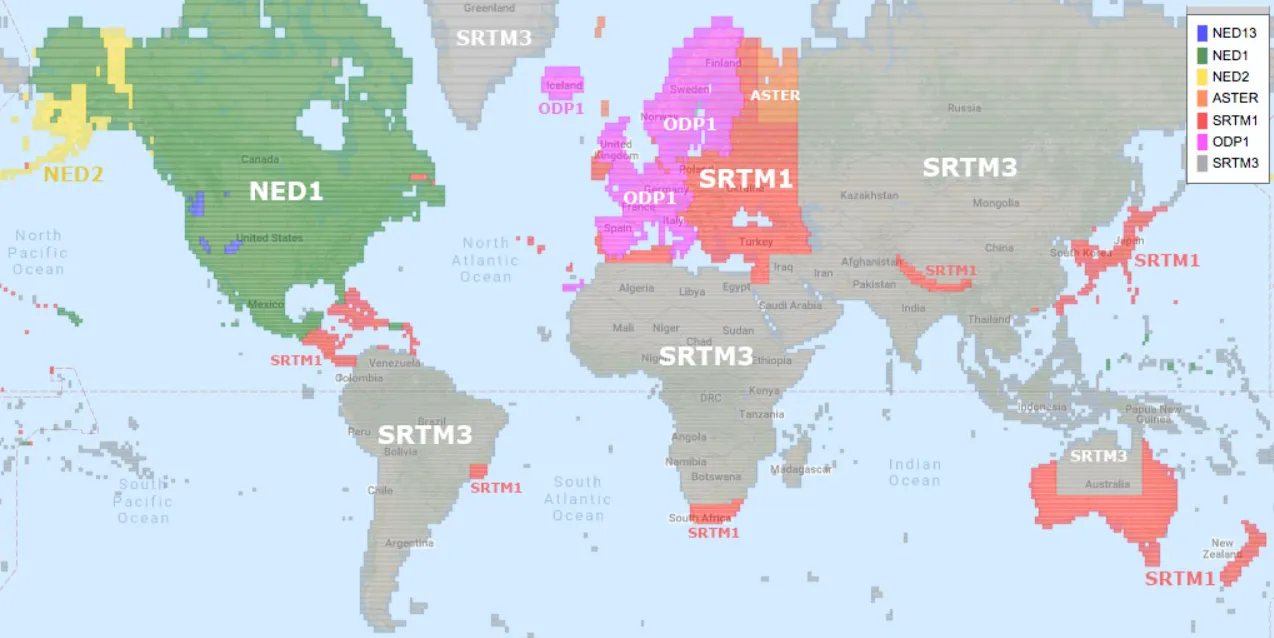
Both files have been converted from .kml to .gpx extension. The GPS Visualizer platform has added the elevation data to both of them. As you can see, the primary difference between these 2 files is just the decimal place! Beyond the difference with the .xml code, it clearly looks like the elevation data bounded within <ele> tags has been provided correctly. The GPS Visualizer has the elevation database coverage worldwide based on various DEM with location-based usage (Pic. 5).
In practice, it means, that the .gpx conversion along with providing the elevation data can be used without third-party tools like Google Earth. In this case, instead of manually drawing the line, which is surely time-consuming, we can prepare the data much more quickly by utilizing dedicated algorithms in QGIS. This is what is shown below.
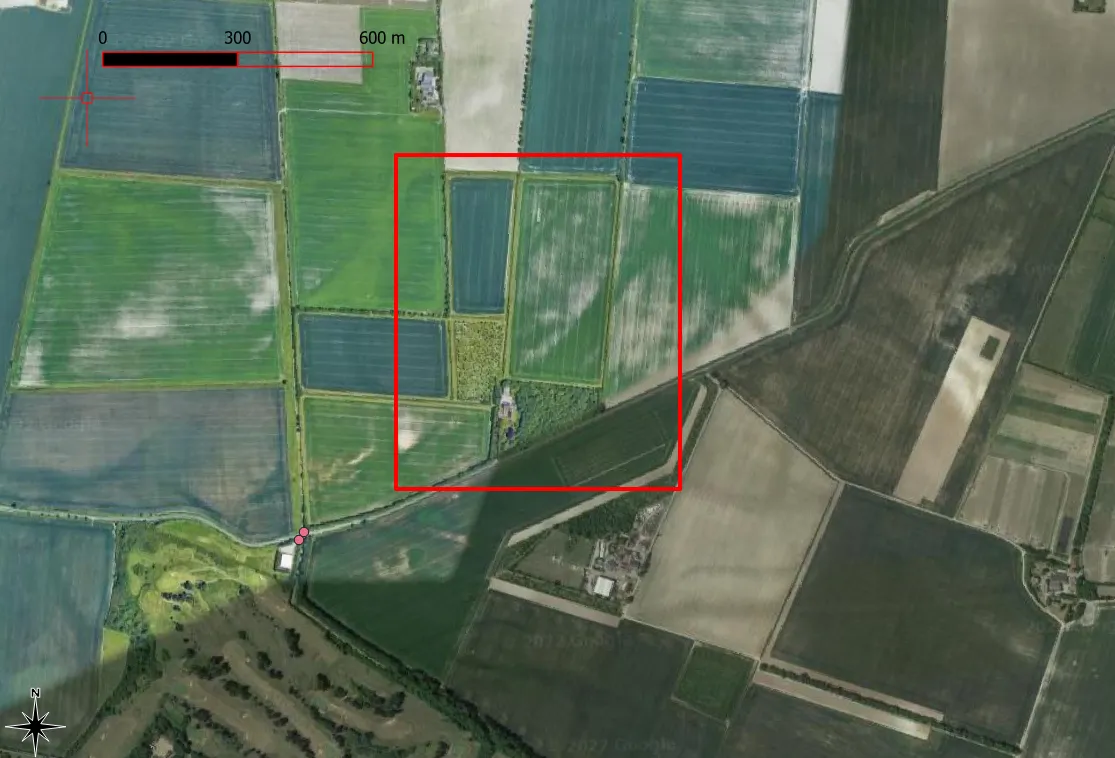
Imagine, that we need to get the elevation data for the area bounded in red as presented below (Pic. 6).
In QGIS there is a nice algorithm, which can be run straight from the Processing Toolbox – Create Grid (Pic. 7). Next, we must set up the type of grid (advisable in point layer) area, and space (usually in meters) between the points. Make sure, that you are making selections on the map canvas manually because otherwise, your QGIS might crash when you specify too small distances between the points. This is a dependency between the overall area selected and the space provided. For one plot of land, it can be even 2m, for a whole town it must be something about 20m. The upper limit is the 10MB size of the exported .kml file from QGIS, which can be further converted by GPS Visualizer.
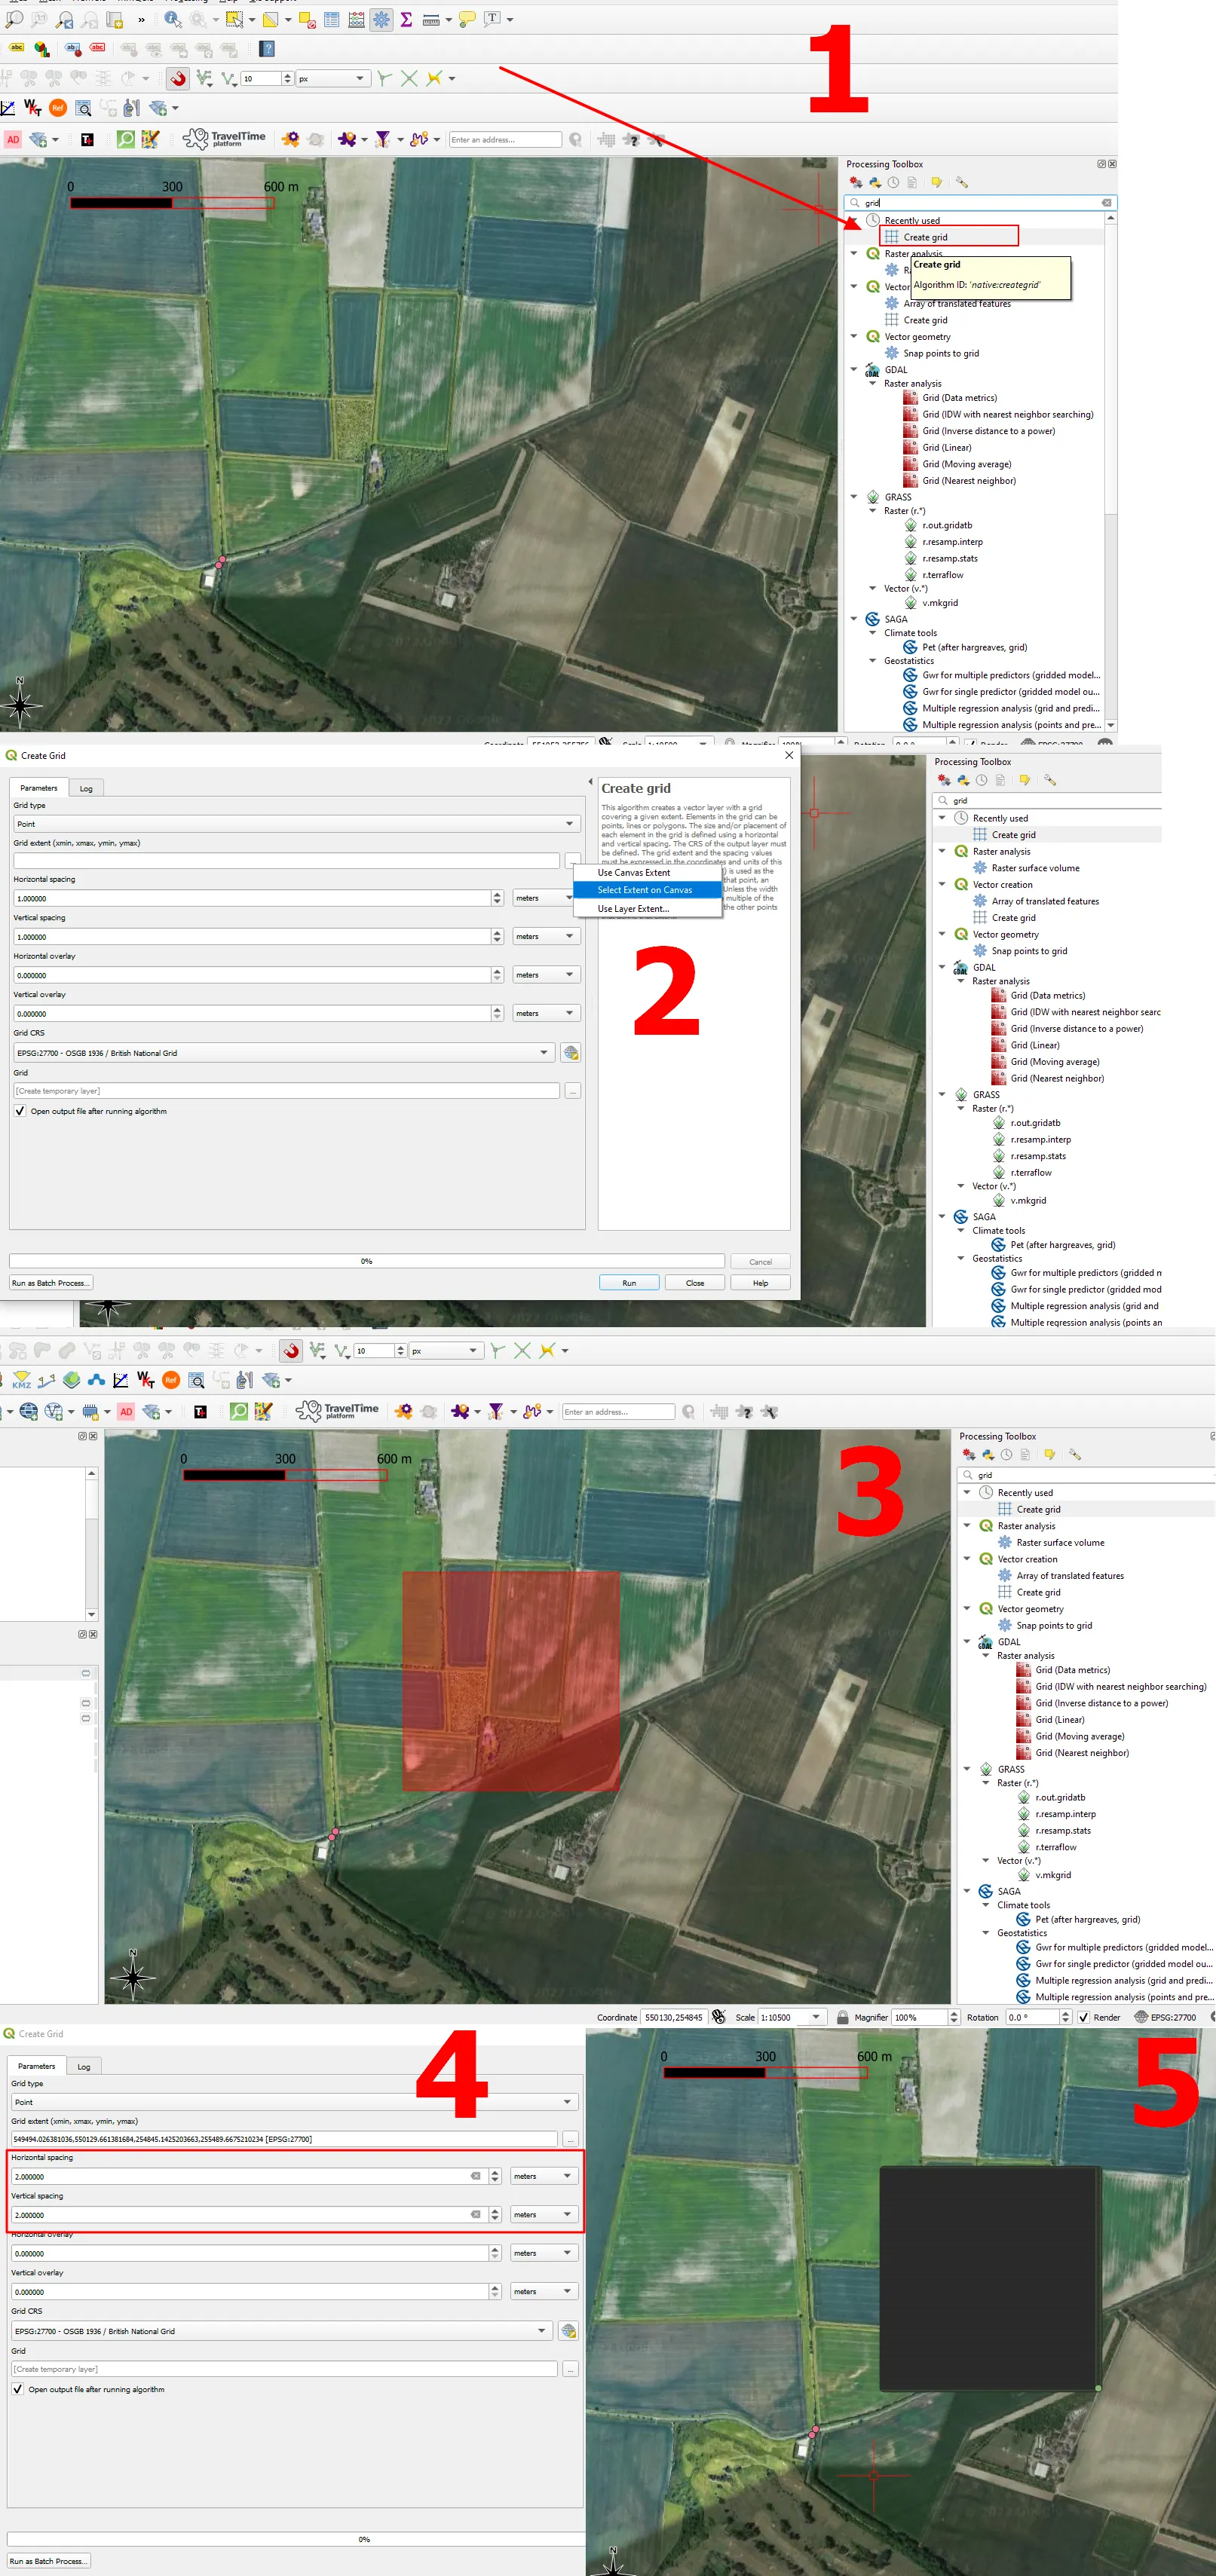
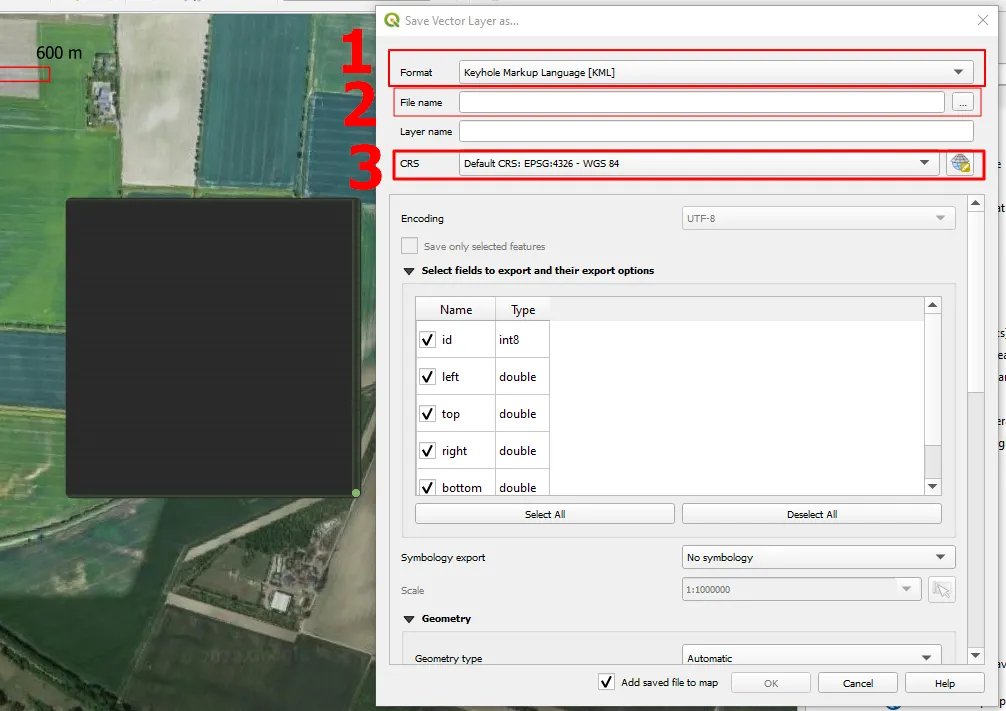
When everything is alright, as shown in the picture above you can export your output as the .kml file. Remember about changing the CRS system to WGS84 which is used by Keyhole Markup Language (Pic. 8).
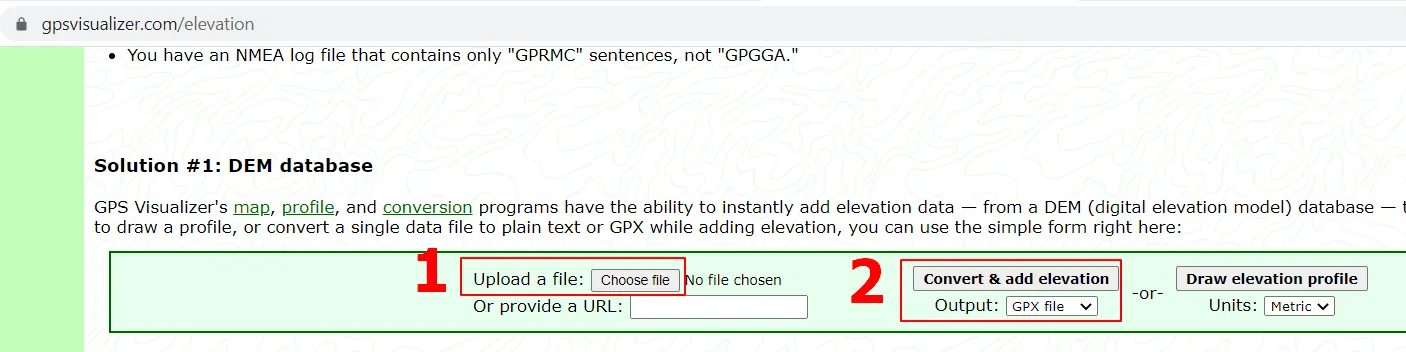
Next, open the Elevation converter in the GPS Visualizer platform, upload your file there, and convert it to .gpx along with adding elevation data (Pic. 9).
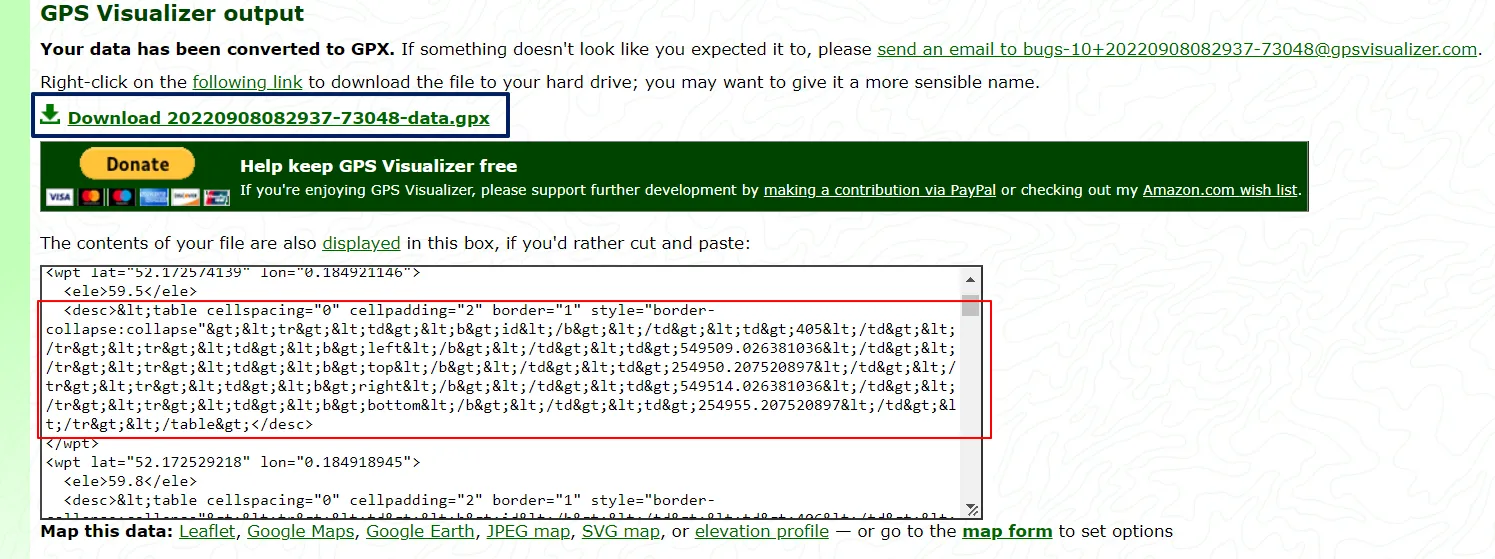
The black side of the conversion is quite a robust description section, admittedly with nothing special, which just overtaxes our .gpx file and might extend the conversion slightly, when the .kml input is large (Pic. 10).
In general, we shouldn’t worry about this and just download the file available above. Afterward, we can change its name optionally.
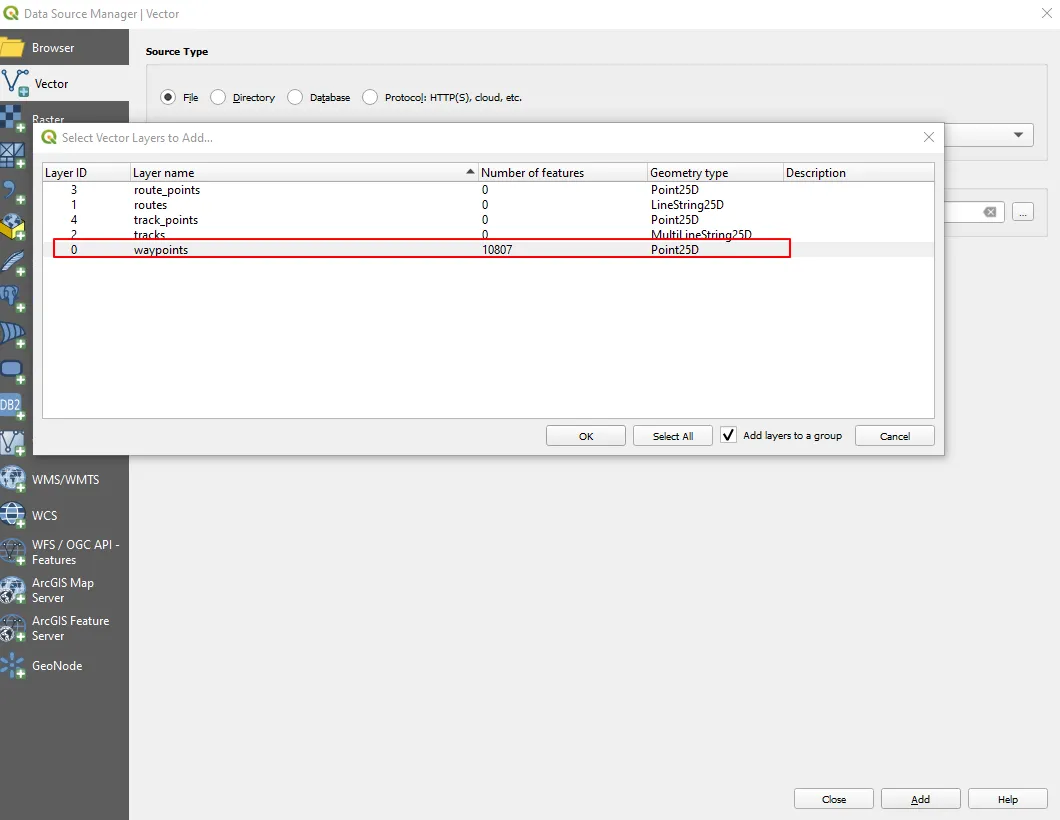
The .gpx file can be added to QGIS easily by using Vector-> Add Vector Layer -> Source (selecting Vector Dataset). Bear in mind, that you don’t need all these separate layers included in the .gpx file. The savvy users notice, that all of them are empty apart from the Waypoints, where all the points have been included. Instead of Select All we should pick up just the last layer (Pic. 11).
Once imported, the box with our point grid will appear again (assuming, that you’ve removed the previous scratch one). By looking at the attribute table you will spot, that the “ele” column has been created with the elevation data assigned for each point regardless of their total number in the grid polygon (Pic. 12).

Optionally you can move this point layer out of the group, but it’s not necessary.
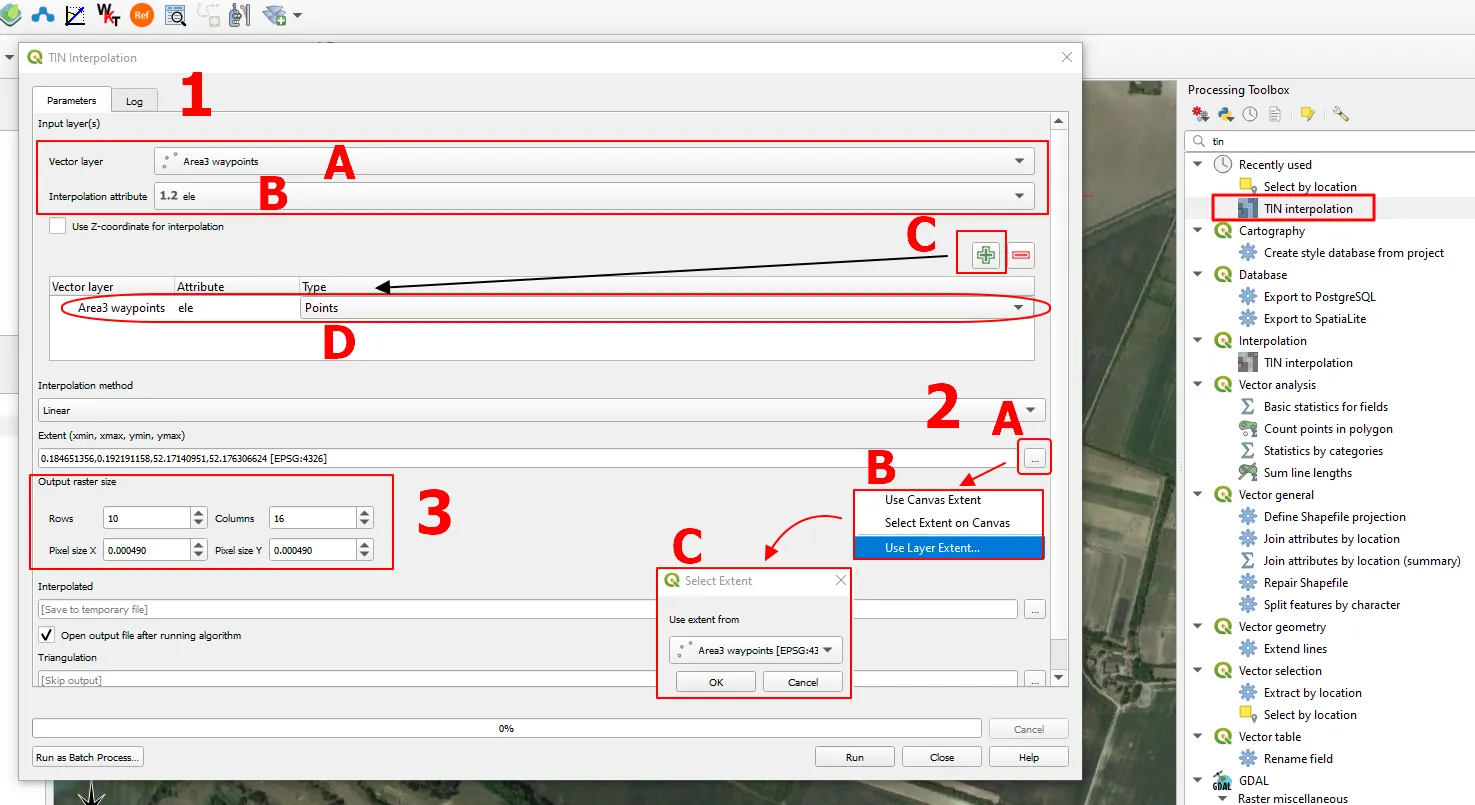
Your next step will be finding and running the TIN Interpolation algorithm from Processing Toolbox. There are a few important options to set here. You need especially to pick up the correct layer to which the interpolation refers. It’s your recently added layer by importing the .gpx file. Besides the layer itself, the most important is specifying the attribute column, which in our case will be “ele” including elevation data for each point. A further step is to precise the area of interpolation, which should be restricted to the layer imported as the .gpx file. Finally, our output raster size should have at least 10 rows if we wish to have quite reliable results (Pic. 12).
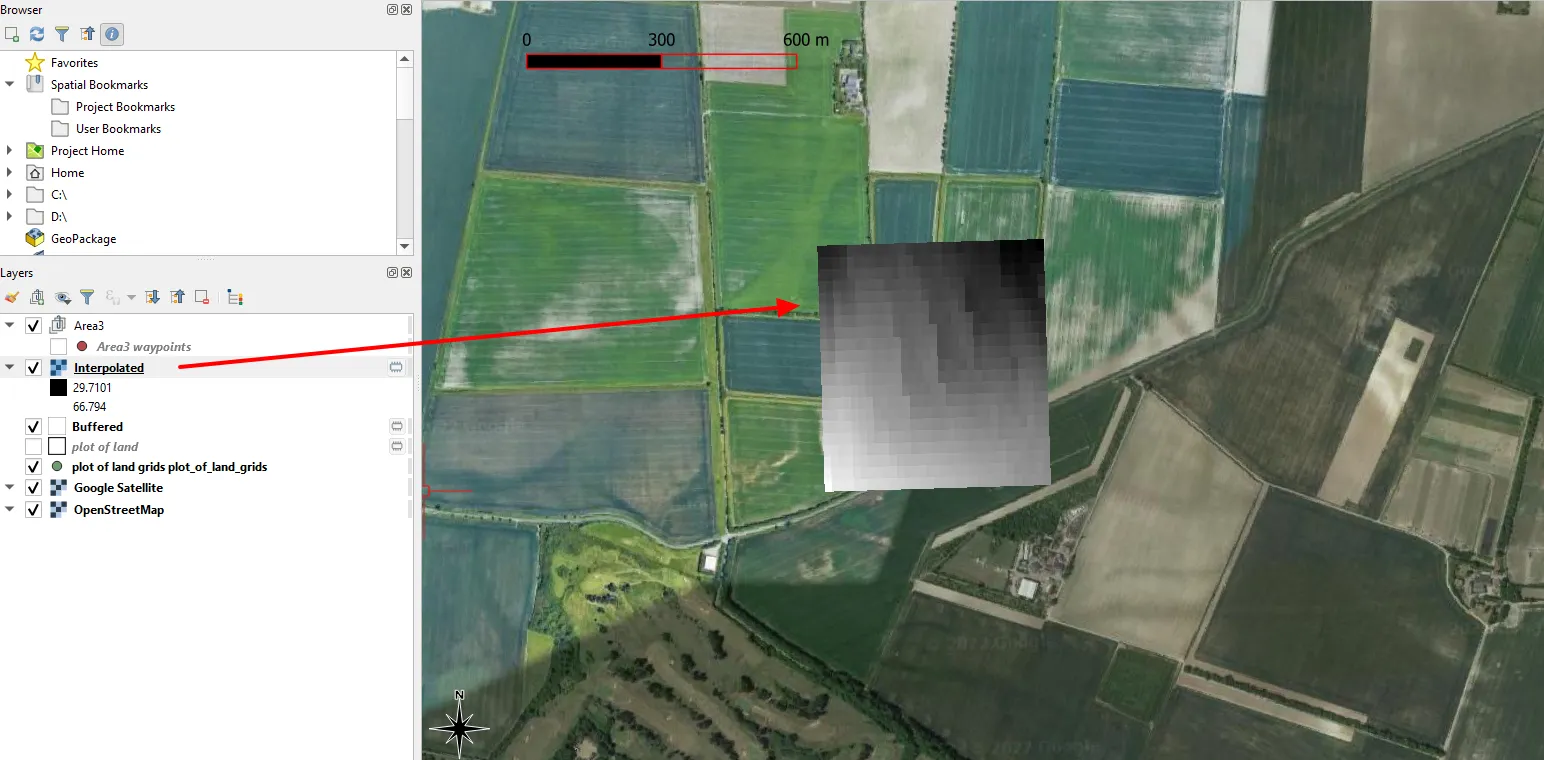
When you are sure, that all the options have been picked up correctly, just hit “Run” and wait a while until the algorithm is finished. You should have the raster scratch layer called “Interpolated” emerge in the layer panel (unless you’ve defined its name and path earlier, but it’s not needed that much) and something like DEM appearing instead of our grid box (Pic. 13), which should have been brought beyond this raster layer or switched off for the time being. Otherwise, you might think, that the interpolation wasn’t successful.
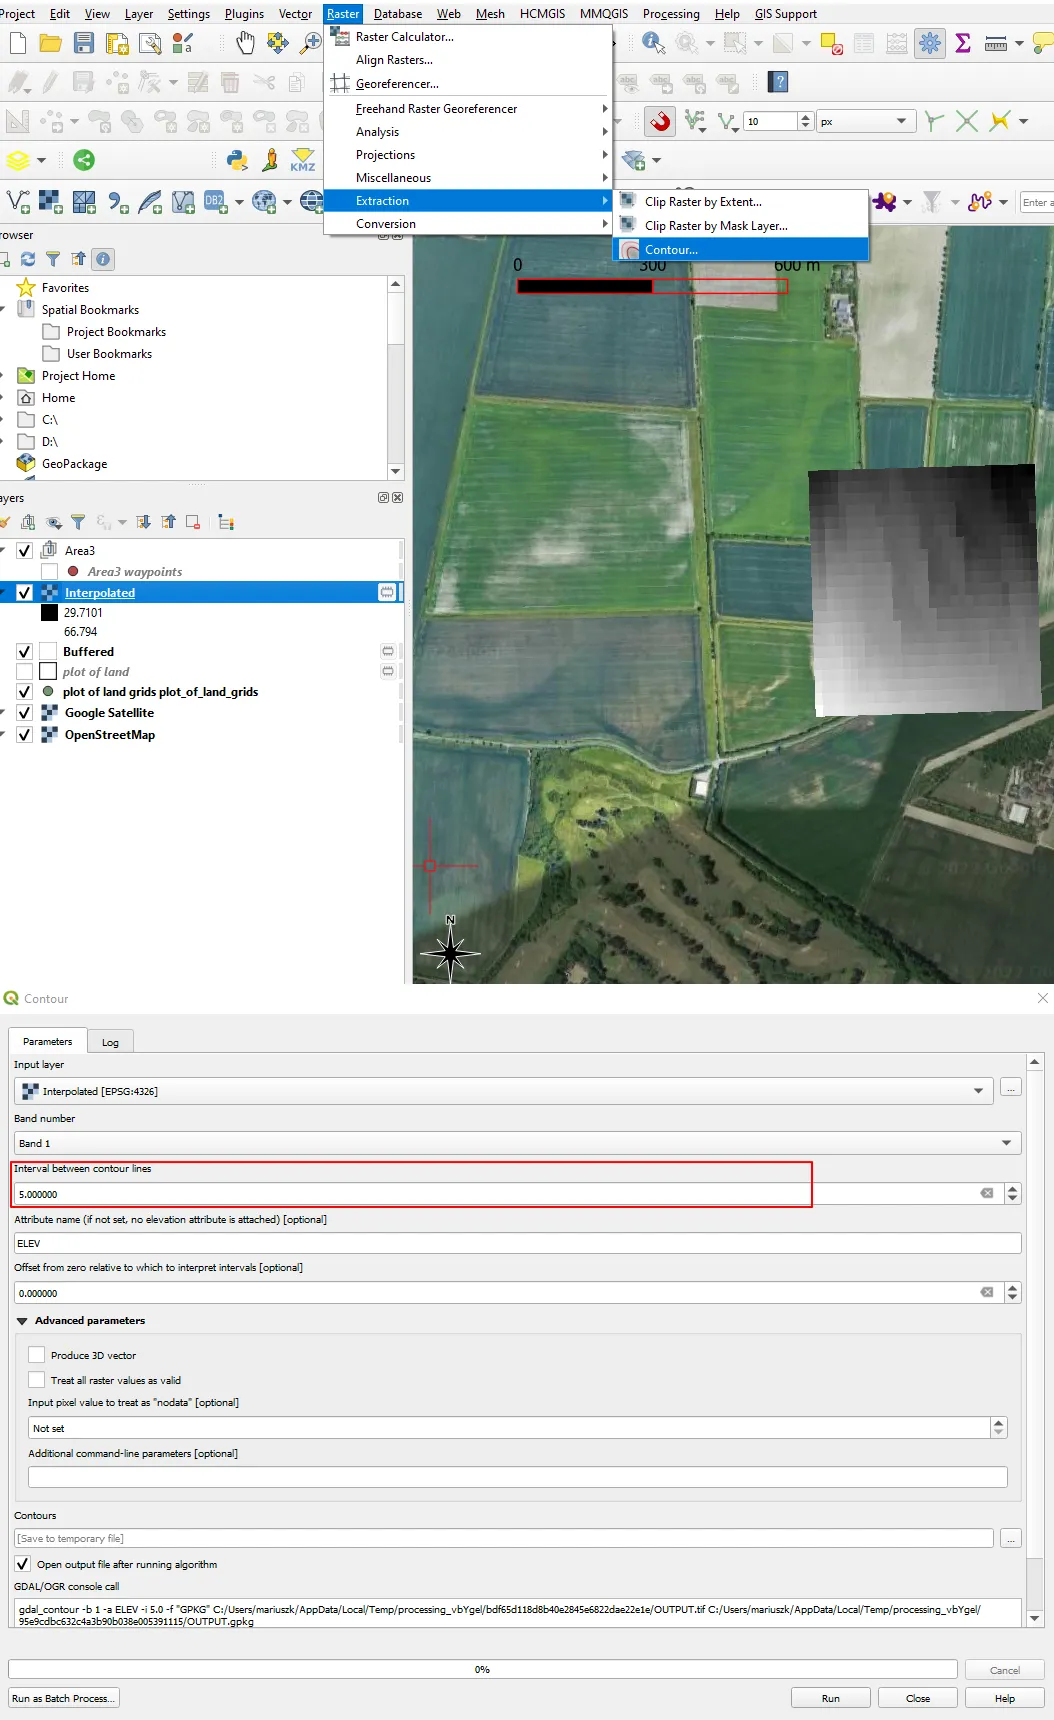
Here is the moment, where you could make some changes with respect to the raster coloration, but it’s not necessary, to be honest. Important is the extraction of contours from our interpolated layer. For this purpose go Raster -> Extraction -> Contour and specify the contour cutting (Pic. 14), which is the only thing to worry about in the panel.
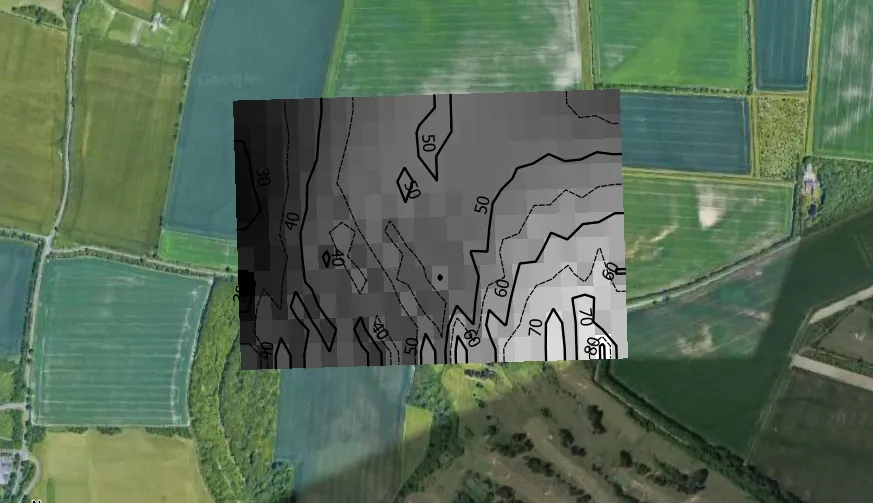
Wait for a moment and you should see the contour lines produced roughly above your raster layer. By playing with styling and labels you can customize them in some approachable manner (Pic. 15).
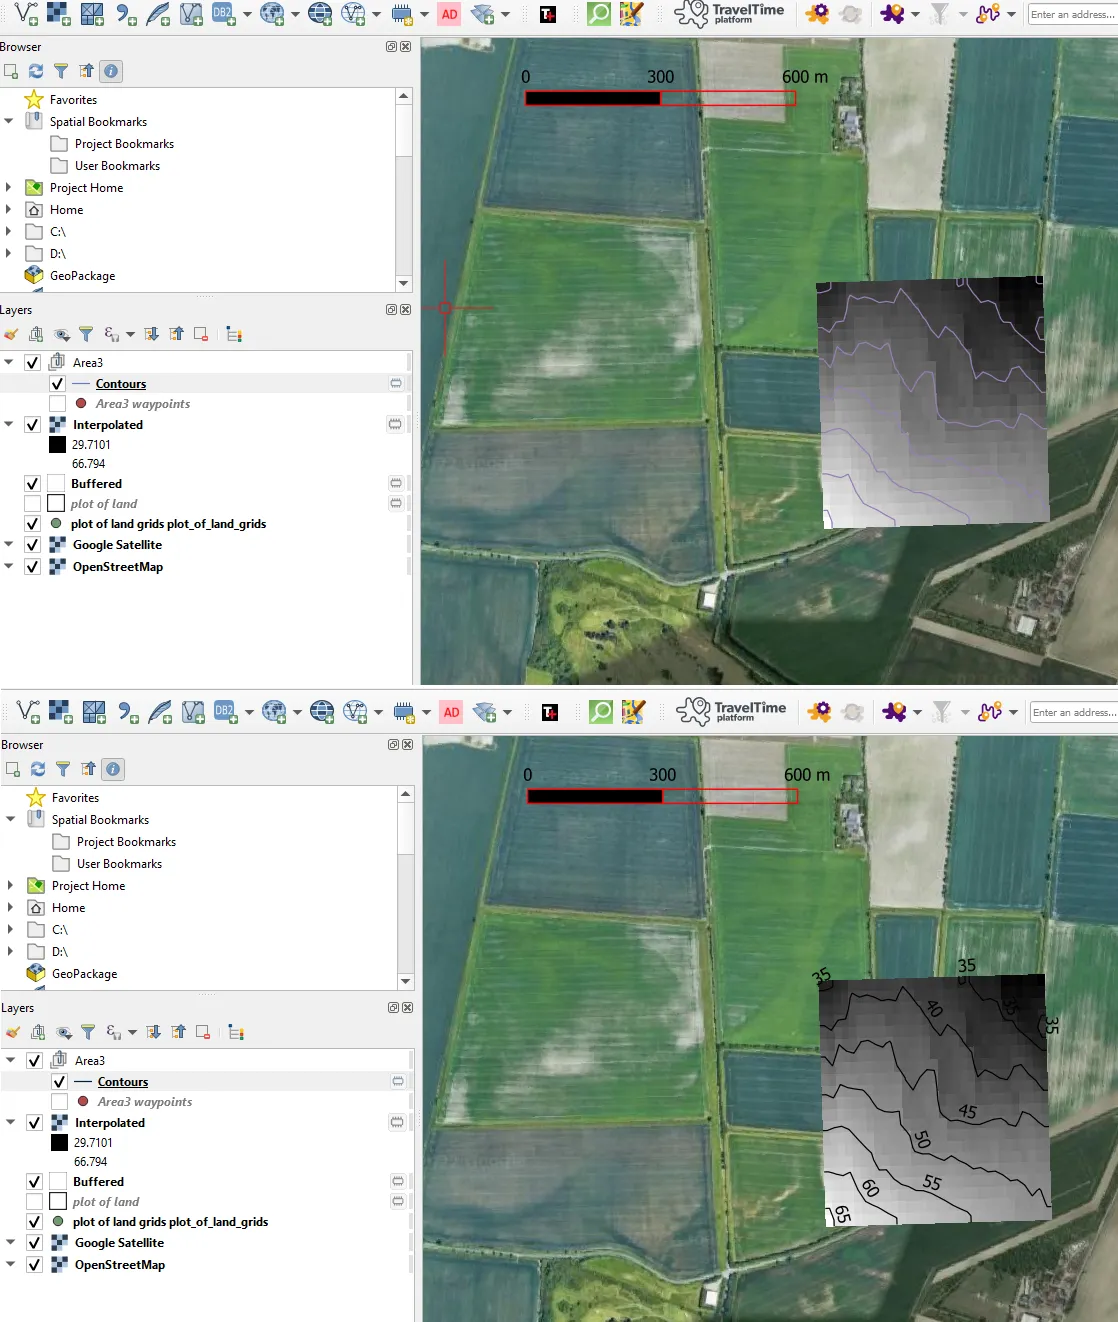
Obviously, if you think, that it’s not enough you can always repeat the Extract Contours algorithm in order to provide another, more general contours cutting to your area as shown in the output below (Pic. 16).
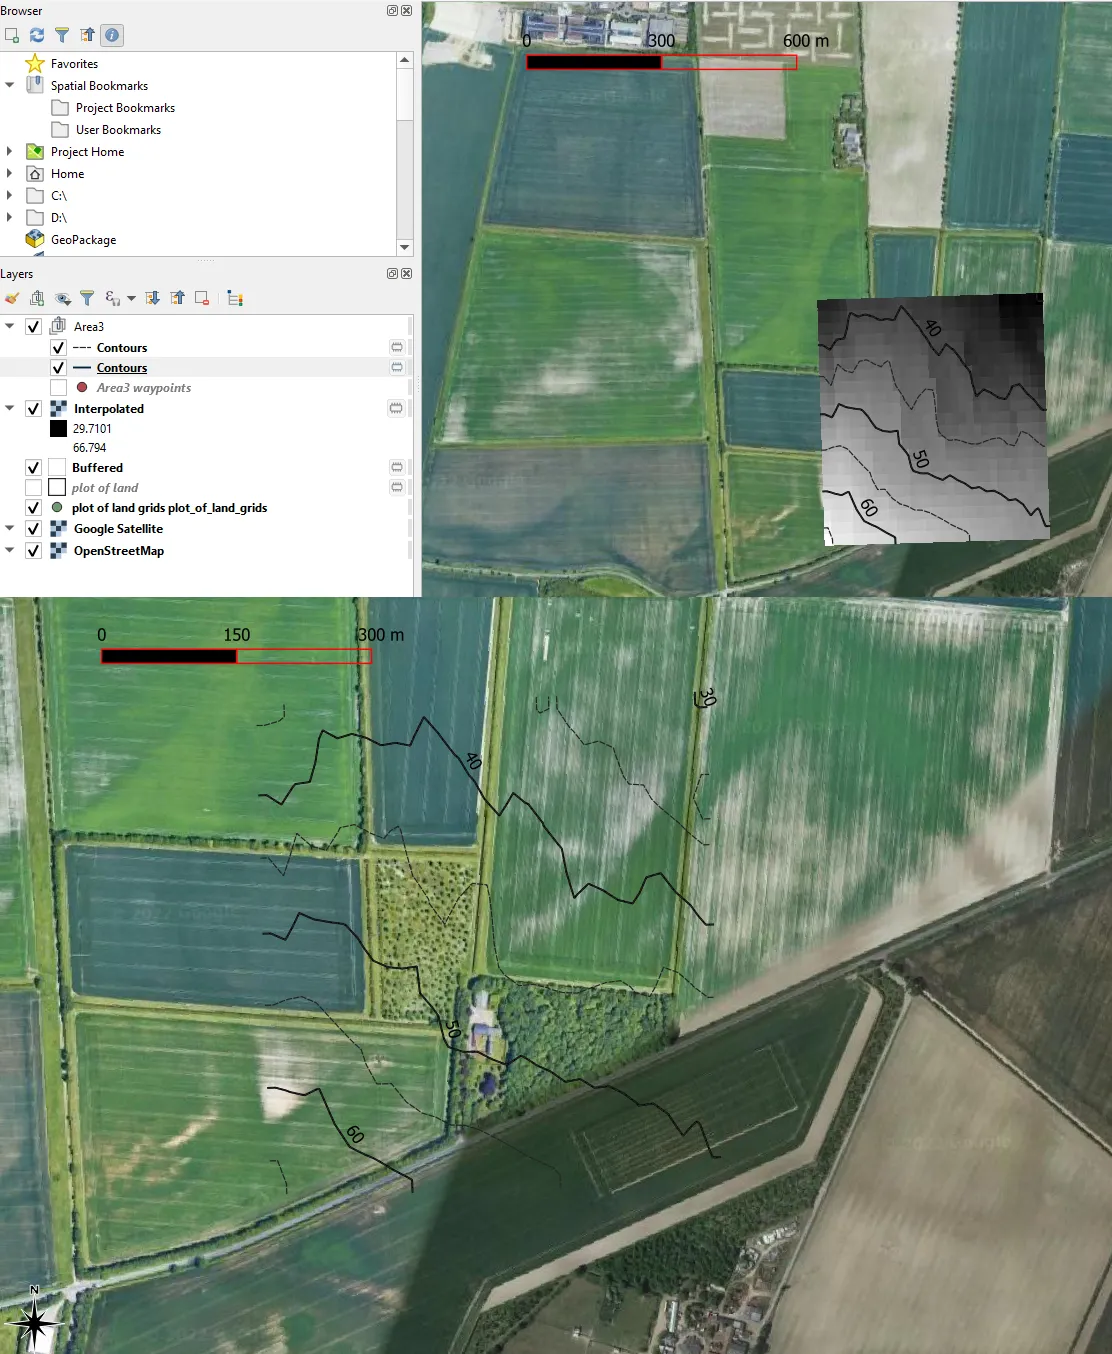
You can also remove the scratch raster layer produced by interpolation and have just the contour lines overlap with your map canvas.
Mariusz Krukar
References:
- Wang Y., et al, 2017, Google Earth elevation data extraction and accurracy assesment for transportation applications, (in:) PLoS ONE 12(4)
Links:
- https://docs.qgis.org/3.22/en/docs/training_manual/rasters/terrain_analysis.html
- https://data.nextgis.com/en/howto/elevation_qgis/
- https://giscrack.com/building-a-qgis-3-digital-elevation-model/
- https://giscrack.com/working-with-elevation-data-in-qgis/
- https://www.alphr.com/show-elevation-in-google-earth/
- https://techplugged.com/how-to-get-the-elevation-on-google-earth/
- https://www.agiratech.com/how-to-generate-digital-elevation-model-using-google-earth-pro
- https://www.esurveycad.com/online/extract-elevation-from-google-earth
- https://mapscaping.com/5-websites-that-find-elevation-for-any-point-on-earth/
- https://www.lifewire.com/find-elevation-on-google-maps-5198524
- https://mathgis.blogspot.com/2009/07/extract-elevation-data-from-google.html
- https://www.gpsvisualizer.com/elevation
- https://www.gpsvisualizer.com/DEM_coverage.php
Forums:
- https://gis.stackexchange.com/questions/238372/extracting-elevation-data-from-dem-files-using-qgis
- https://www.researchgate.net/post/How-to-make-an-accurate-Digital-Elevation-Model-DEM-using-QGIS
- https://gis.stackexchange.com/questions/317534/how-do-i-add-elevation-data-to-my-layer
- https://gis.stackexchange.com/questions/28190/extracting-google-earth-elevation-data-to-excel
- researchgate.net/post/How_can_we_extract_digital_elevation_data_from_Google_Earth
- https://superuser.com/questions/272460/is-there-a-way-to-extract-elevation-data-from-google-earth/
- https://www.rockware.com/forum/index.php?/topic/2542-extract-elevation-from-google-earth/
- https://groups.google.com/g/kml-support-getting-started/c/NouM02EsCvY
- https://asksawal.com/how-to-extract-elevation-from-google-earth-31020
- https://www.quora.com/How-accurate-is-Google-Earth%E2%80%99s-elevation
- https://gis.stackexchange.com/questions/20259/what-datum-reference-ellipsoid-does-google-earth-use
Wiki:
Youtube: