
The AutoCAD LT version is restricted to many fields. It impacts also the option of total calculation of the lines and polylines comprised of the given layer. Since our layer is not big, we can handle it manually by for instance the sum of separate calculations in the table or just simply by applying the LIST function for every single item. It’s certainly not a way forward when we are facing some huge layer. Because the tool doesn’t provide a direct opportunity for calculating the total length of all lines & polylines in our layer, we have to use the QGIS eventually. On the other hand, I can assure you, that all the steps explained here won’t take longer than 10 minutes. Let’s crack on then!
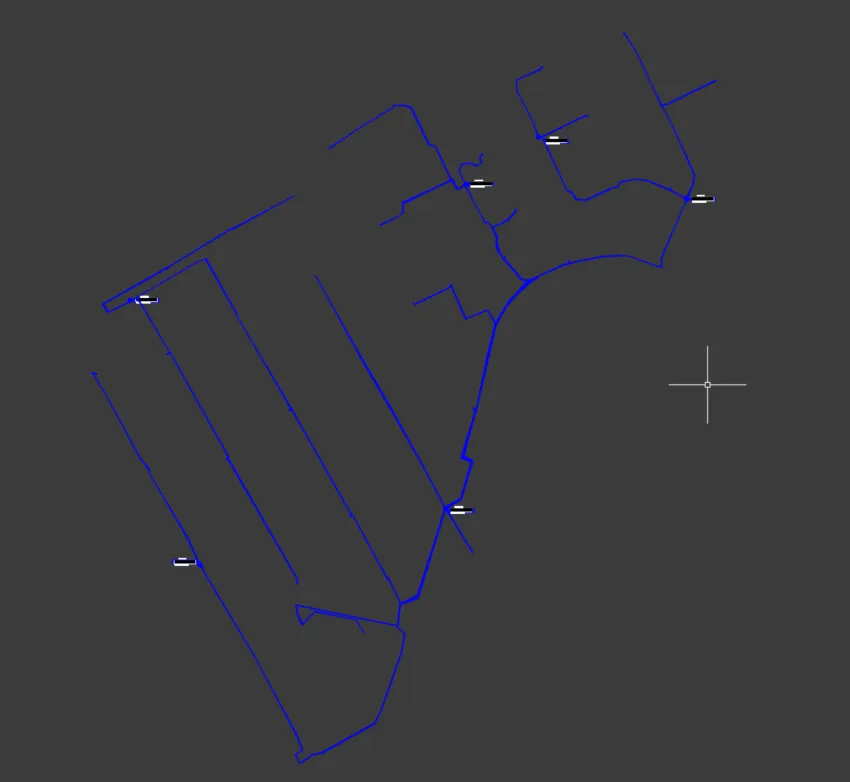
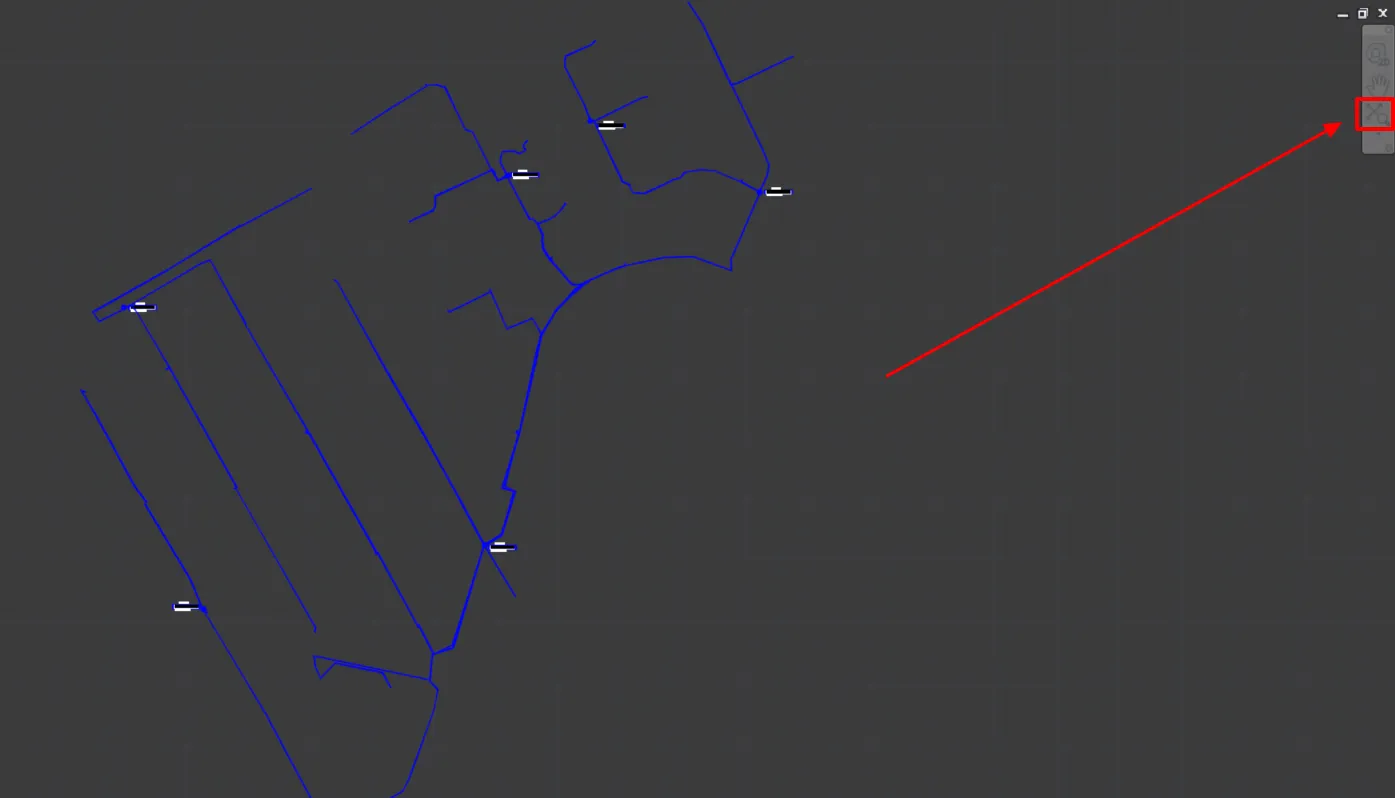
Our test project contains several layers, from which we are going to calculate just one, which is blue (Pic. 1).
This is not just a pure linear layer. It’s built up from some labels and point items (circles) also.
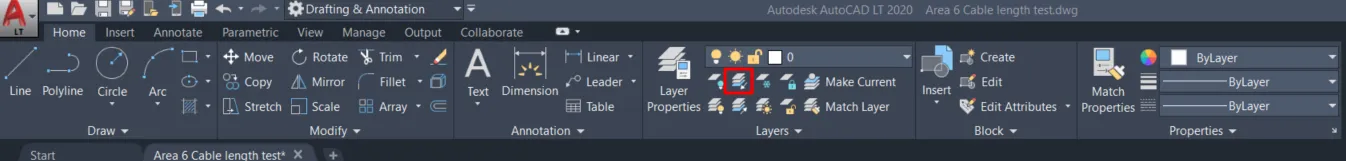
1. Isolate the layer we want to calculate – we can do it by selecting the proper icon from the panel (Pic. 2) or typing the LAYISO command.
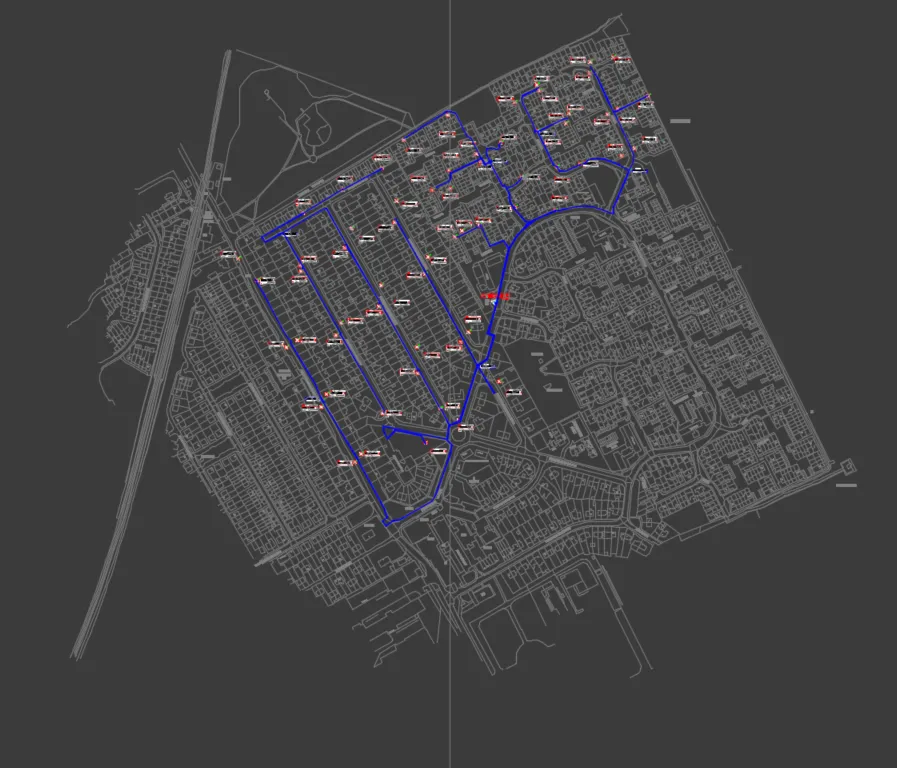
When typed, select at least one item belonging to the layer and press Settings before confirming it. The reason behind it is switching off completely other layers. As default, all the other layers are just faded out, but still visible. We don’t want that. That’s why for the further action “Enter settings for layers not isolated” you should select Off instead of Lock and fade. Finally, your general steps should be LAYISO -> S (Settings) -> O (Off). Don’t worry about the paper space viewport. It’s not important this time. After the appropriate selection just hit Enter and you should see just one layer – the blue one, which is going to be calculated (Pic. 3).

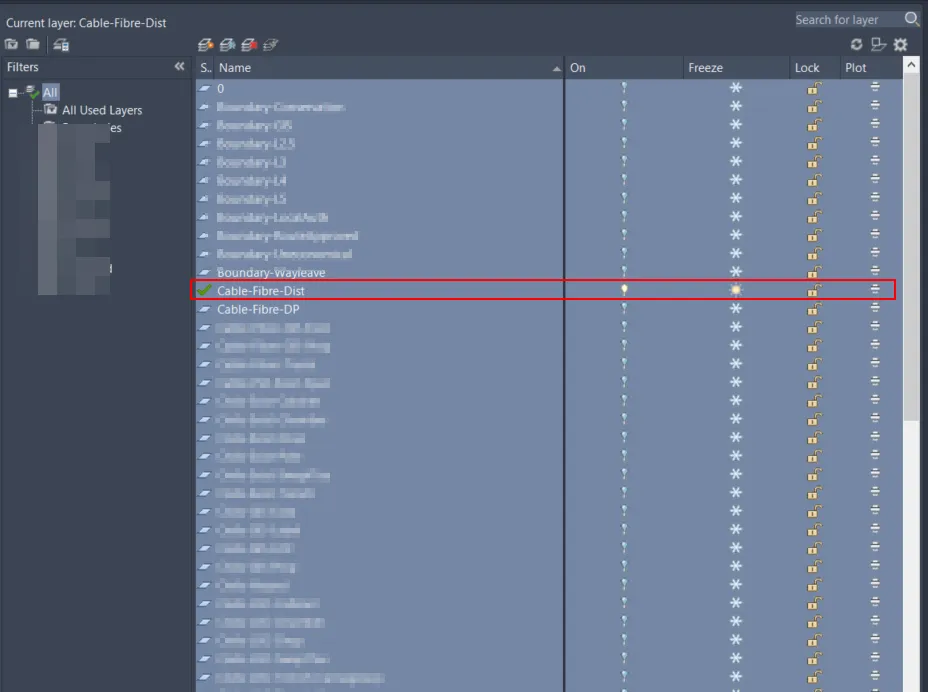
In fact, there is an alternative method for reaching this stage. Namely, we should set this particular layer current in your Layer Properties panel. Next by selecting all the layers, we can freeze them or switch them off. At this moment AutoCAD will inform us, that the Current layer cannot be frozen & switched off. That’s exactly what we need so far (Pic. 4).
2. Extract the layer – which can be done simply by copying and pasting it into the new file. Firstly, make sure that a whole layer is selected (Pic. 5). Next, use the COPYCLIP command or simply press the Ctrl + C button in order to copy the selected items.

Next, create a new drawing by clicking the paper icon next to the AutoCAD LT logo in your top bar or by typing the QNEW command. The drawing template can be the default.
In your new drawing paste the copied layer by using the PASTEORIG function. Alternatively, you can right-click anywhere on your drawing and choose -> Clipboard -> Paste to Original Coordinates option. It does exactly the same. Important is to retain the CRS system, which has been used in our AutoCAD environment.
Next, you can bring the drawing to the front of your screen by using the Zoom Extents option from your floating Navigation Bar on the right (Pic. 6).
This step admittedly is just optional for making sure, that the isolated and selected layer has been extracted successfully. Moreover, you can notice, that this isolated layer includes some inherent items like labels or circle points, which won’t be taken into account in our calculations. In the new drawing, your layer list should show just layer 0, which is the default, and the layer copied from the main drawing. Since this layer has some integrated items, they might be displayed as separate layers in the panel. Don’t worry about it.
3. Save the layer as the .dxf file – it’s the next step. Type SAVEAS in the command bar or use the AutoCAD LT icon -> Save As in order to open the dialog window with a selection of your target directory (Pic. 7).

4. Launch QGIS and import the .dxf file – simply go to the Project -> Import/Export -> Import layers from DWG/DXF…
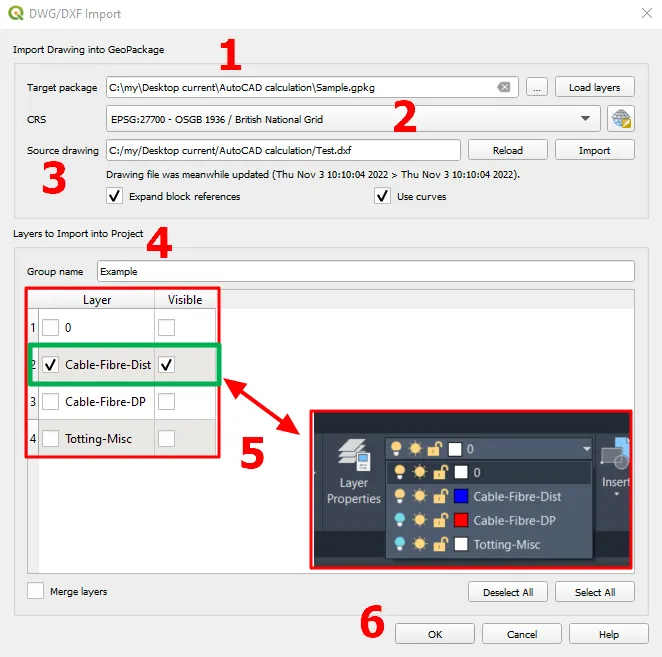
When the dialog window is opened, make sure, that all fields are filled up correctly. First of all, define the Target package, which will be represented as the .gpkg file including your imported drawing (Pic.8, 1). Next, make sure, that the CRS is suitable for your QGIS and AutoCAD LT project (2). Once the Source drawing is provided (3), the bottom box should display the list of all layers included. It’s easy to see, that this list roughly reflects the list from our AutoCAD LT drawing (5). Because we just need to calculate the lines, we need only one layer (marked green), whereas the remaining ones can be simply unticked. If not, we might get the extra lines as an outcome of conversion and face difficulties with the total calculation. Finally, provide the Group name (4) and hit OK (6).
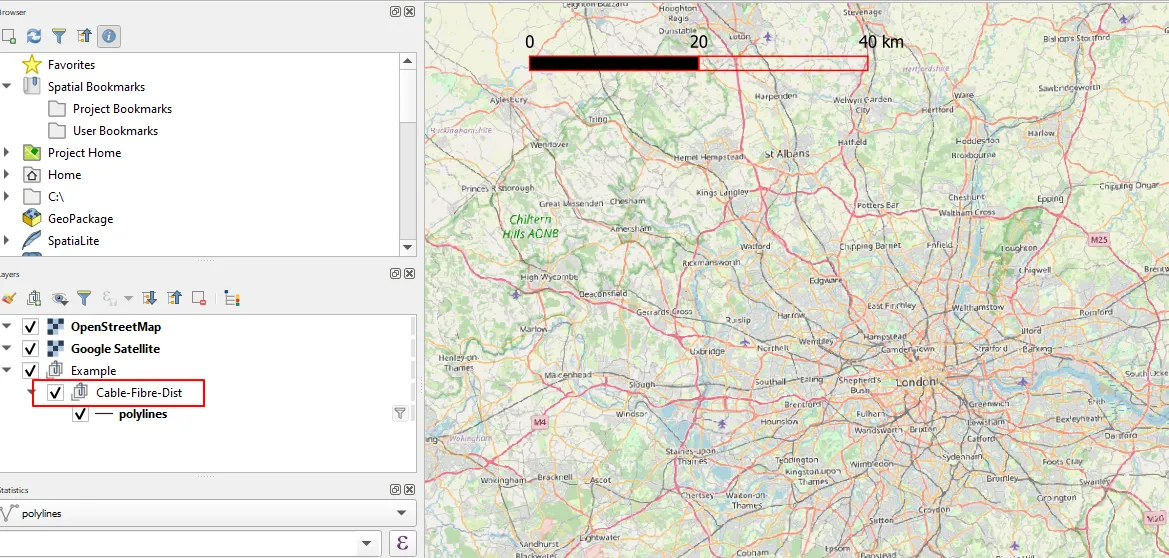
Wait a few seconds and your group should appear in the Layers panel on the left (Pic. 9).
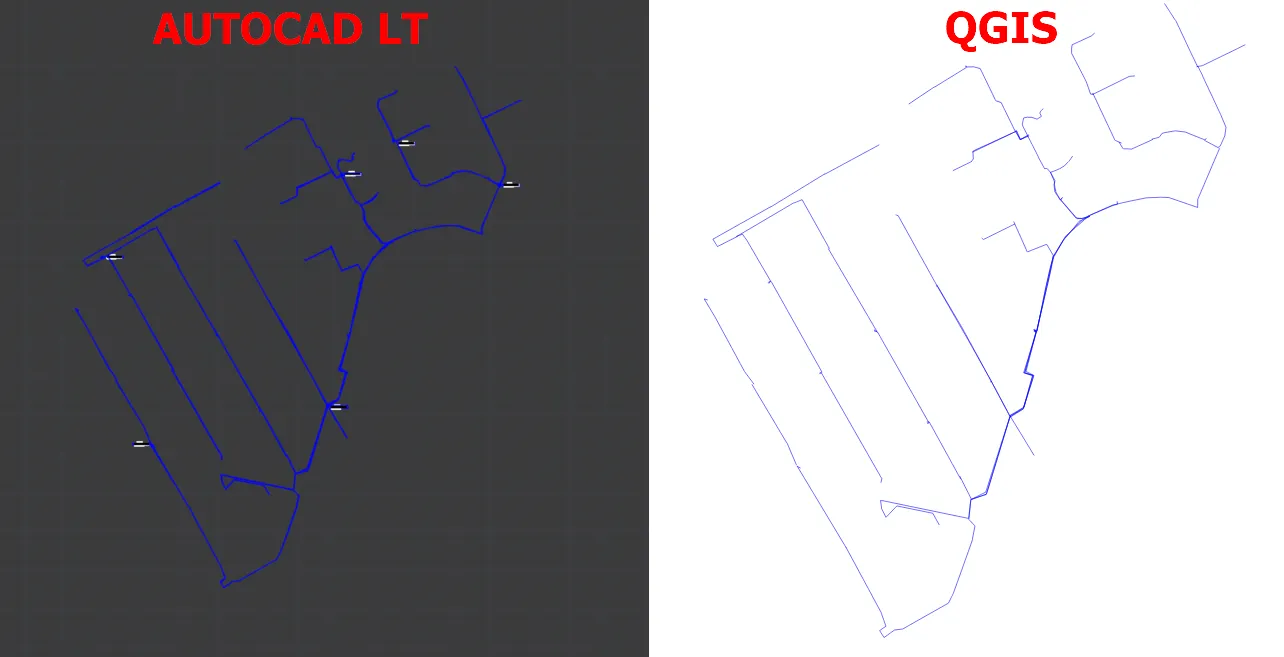
To be sure, that the .dxf file layer reflects the same drawing pattern as made in AutoCAD LT, we can right-click on the layer and select the Zoom to layer option. Sometimes the map tiles might overlap our layer making it still invisible. It’s easy to switch the map off or drag it to the bottom. The .dxf layer looks exactly the same as in the AutoCAD LT drawing, which is perfect! (Pic. 10).
5. Auto calculates the length of polylines & lines in your layer – without any further hassle, you just need to right-click on the layer and open the Open Attribute Table option. Next, the first thing is to make it editable ( Pic. 11, 1). By the way, you can see all the attributes assigned to the typical .dxf file, which in the AutoCAD environment act as properties. In the meantime, you can spot that the overall number of items slightly decreased (top left). It’s a result of the removal of the other layers, which came through as the inherent ones along with isolation and export (labels and some points). This is the information just out of interest.

When our data attribute table is in editable mode, we can create a new column (2), where the length calculations will be placed (3).

Next, fire up the field calculator and provide the following formula round($length,n), where n means the number of decimals after the comma. To be honest you can set the column type to Integer instead of Decimal when creating the column and your expression will be just $length then.
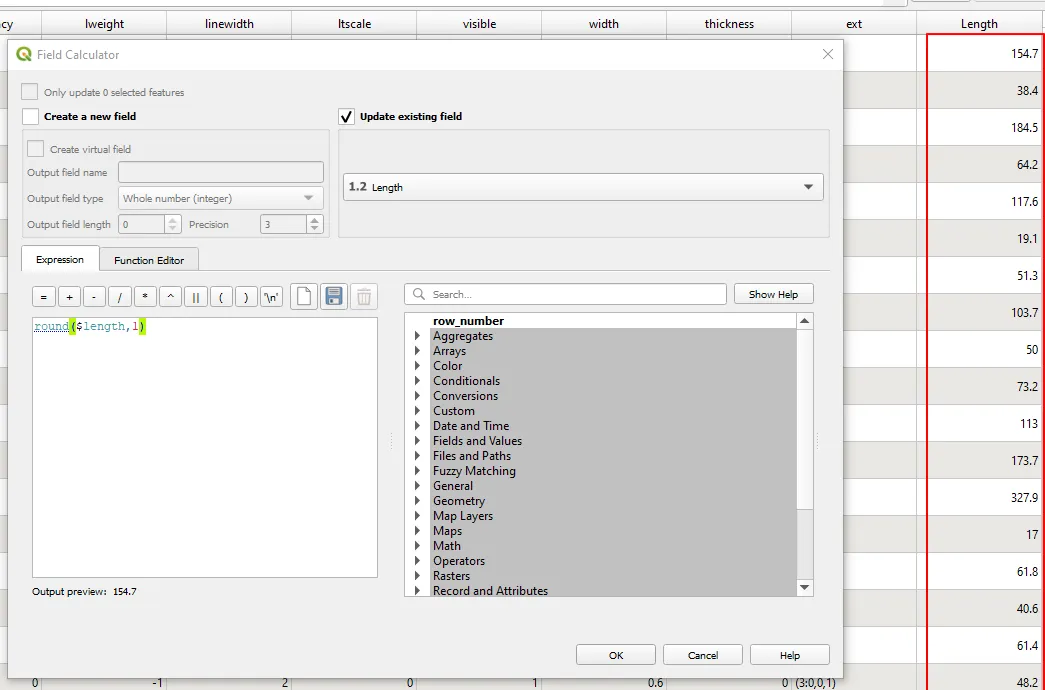
The estimated length for the very first item is shown in the Output preview, which is the best place to check if our expression provided is correct.
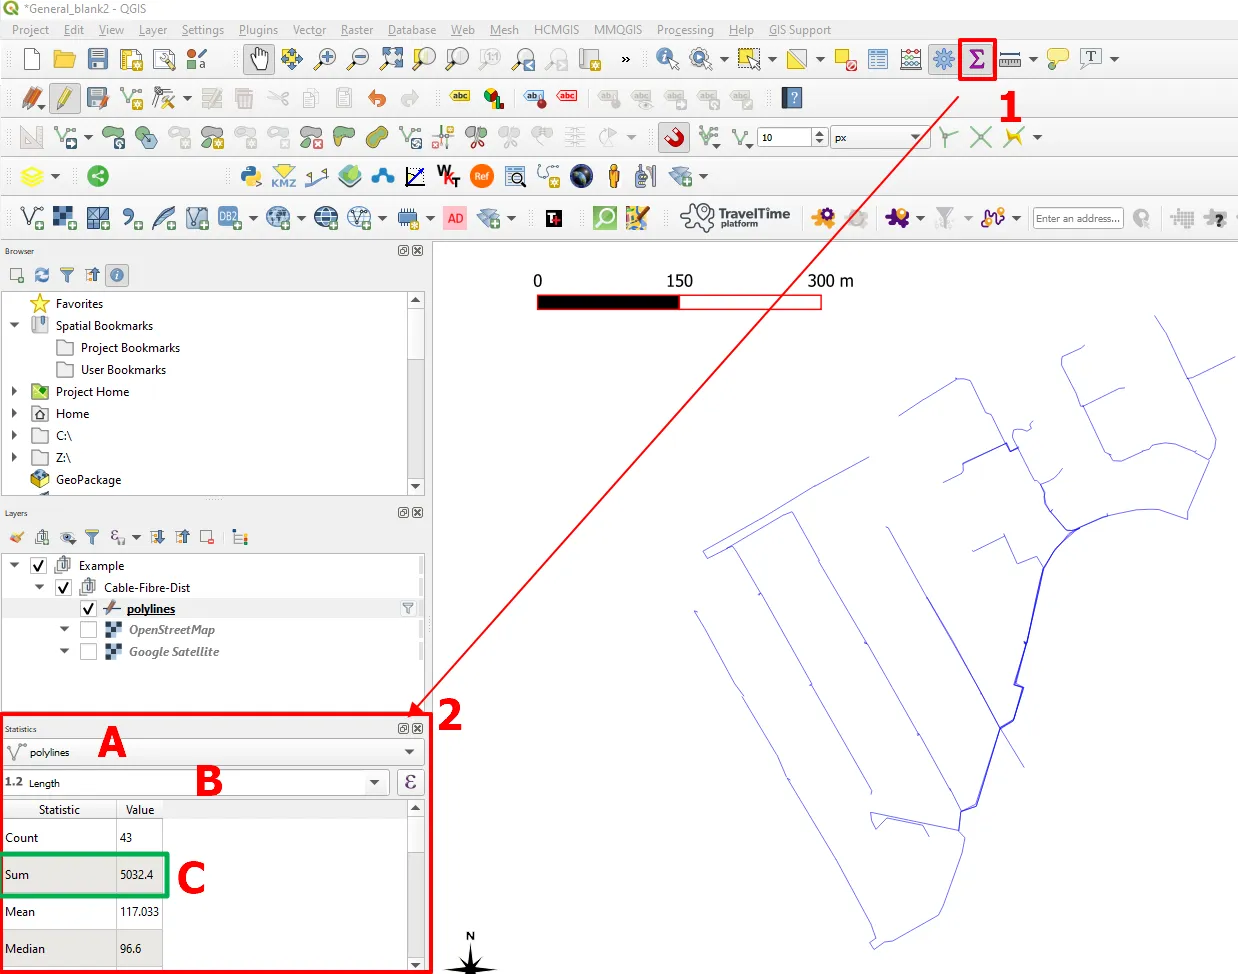
6. Sum up all lines & polylines – since the calculations have been done it’s an easy step. It’s just launching the statistical summary tool. Make sure, that you have it in the bar somewhere. If not, go to View -> Toolbars -> Attributes Toolbar (switch it on).
The Show statistical summary tool can be recognized by the purple Epsilon letter (Pic. 14, 1). Press it in order to open the Statistics panel, which should appear instantly below the Layers panel (2). Next, select the correct layer from the top dropdown (A) and the correct column (value) from another dropdown below (B). The statistical summary should emerge in the table below. We just need to know the total value of all lines & polylines, which is to be found as Sum (C). Finally, we can get to know, that the total length of all lines & polylines in our AutoCAD LT drawing was over 5km.
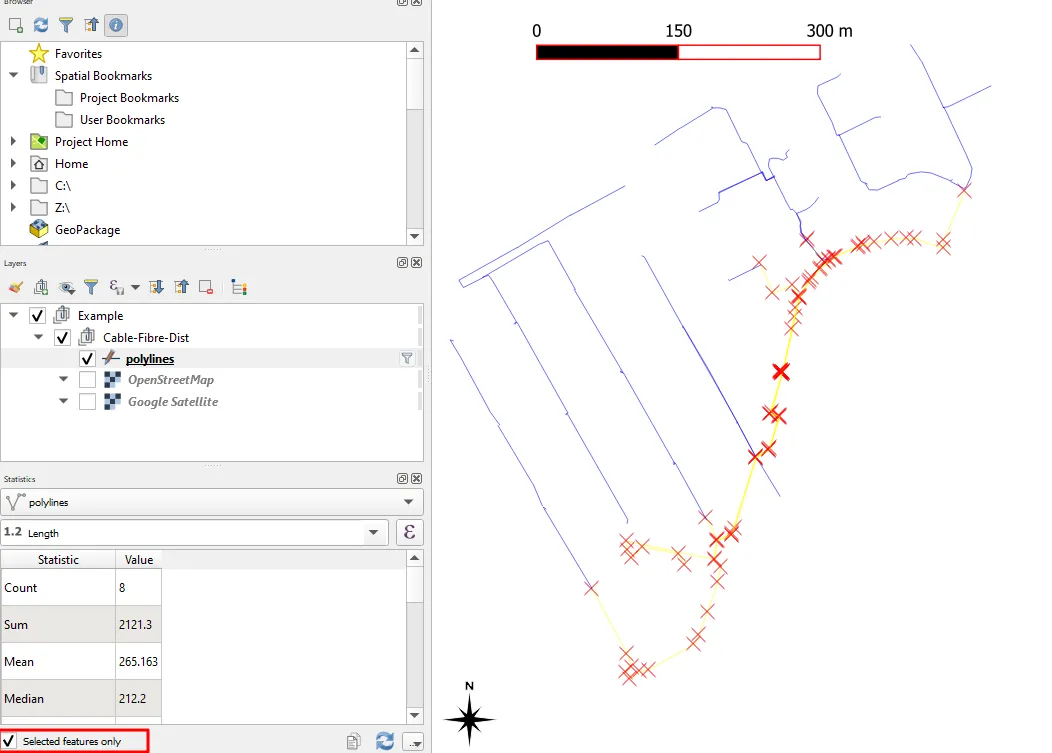
It’s not the end. It’s worth looking at the option available at the bottom of the Statistics panel. Namely, we are able to make the calculations for selected items only. Unlike AutoCAD LT, where we have to add all lengths up manually i.e. in the table, here we can just select just the ones, which you need to use in particular (Pic. 15).
In the finish, it’s worth flagging up the possibility of extracting this data outside of the Statistics panel. In the bottom-right corner, you can find the duplicate-sheets icon, which represents the Copy Statistics to Clipboard option. It’s just a one-click feature, which collects all the data for us, which next can be pasted to other bodies like Notepad or Excel (Pic. 16).
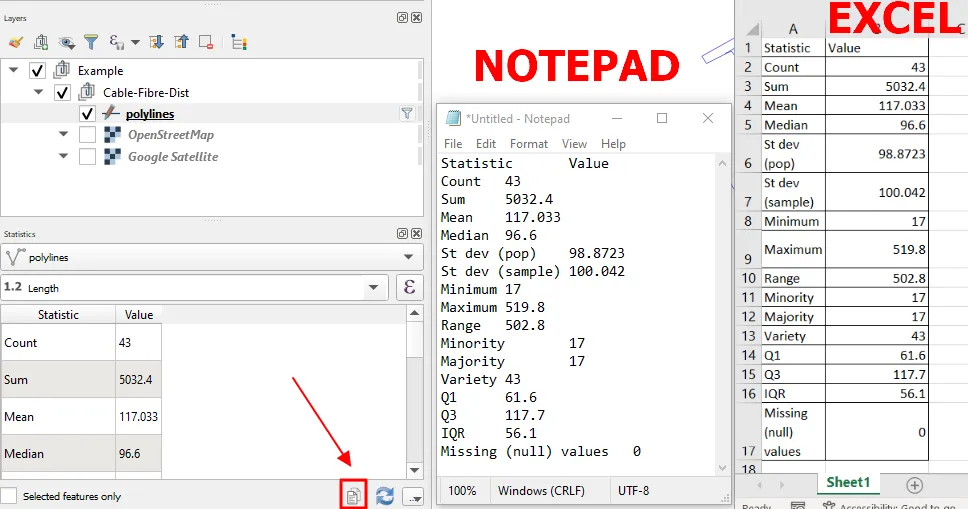
Frankly speaking pasting this data in Excel results in a nice tabulation desired for further purposes.
Mariusz Krukar
Links:
Forums: