This short tutorial will show you how to load and customize Excel data in ArcGIS Online map. I assume you already know how to get around with the ArcGIS plugin for Excel. If not, you can watch the first YouTube video directly underneath this text or visit this link.
1. I guess you have your Excel data prepared and the blank ArcGIS Online map opened (Pic. 1)

2. Loading Excel data to ArcGIS Online is very simple (Pic. 2). You need to choose the Layers icon (1A), where the layer to your map can come from Excel (1A) or ArcGIS (1B). By loading data from ArcGIS, we can display a lot of layers from AGOL, both default and our projects. The Excel data can be displayed along with the ArcGIS layers that were loaded previously. However, our case only deals with Excel data. When the Excel icon is selected, you can see the Data box (2A) and make sure that the icon on the right (2B) is not grey. It cannot be inactive because we won’t be able to pull our selection to the box. Once clicked, it becomes green, which means it’s active. The icon “Select cells(s) directly on the sheet” lets you do the next step once any cell range with data is selected. At this stage, make sure that you are not choosing empty cells. After making the selection (3), our Add Layer box changes. In the Data box, our range of selection appears (3A); just below important is the box “First row contains headers” (3B), which is selected by default. I think it is essential to keep it because the name of the headers will be helpful later in customizing popups in ArcGIS Online. Our Location types are coordinates (3C), although we might select them from address, ESRI JSON Geometry, or geographical data in other situations. Finally, the columns representing our coordinates (3D) are presented. Our Excel data must have columns, which will define the geographical data if we want to map them on ArcGIS Online. These columns must fit the option specified earlier (3C), which are coordinates as default. Next, the Spatial reference (3E) should be provided, where initially, the standard one WGS 84 is selected. When everything is correct, we need to click Add (3F). The data will be plotted on our new map instantly (4), where the range of our selection will take the name of the layer (4A), and the map will be zoomed to the data spatial range (4B).

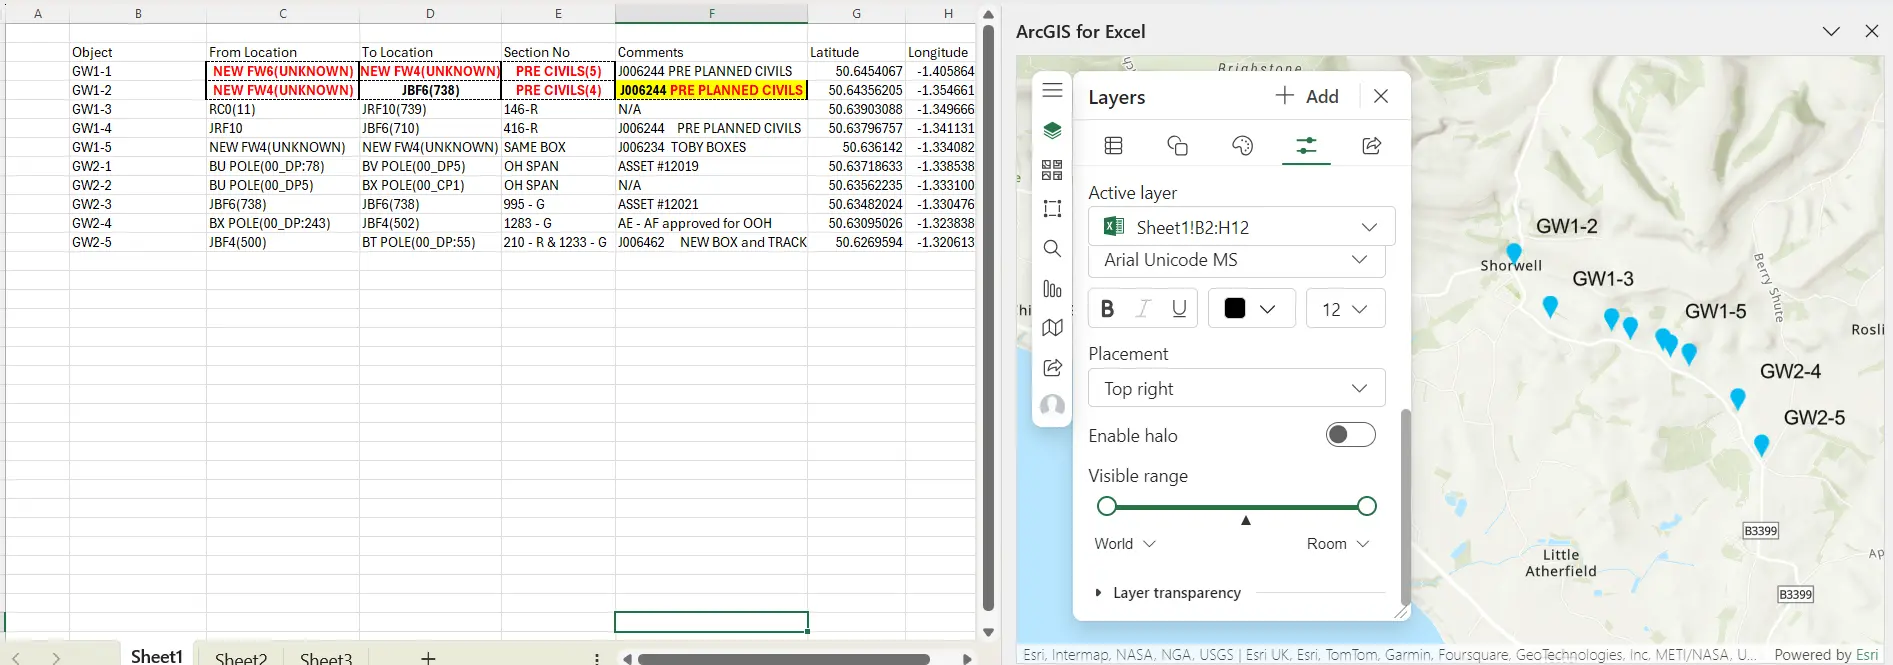
At this stage, you can change the styling if you want (Pic. 3), although it can be done (even better) later in ArcGIS Online. The same can be done with labels (Pic. 4). Things like popups, layer visibility, and layer transparency are also doable at this stage.

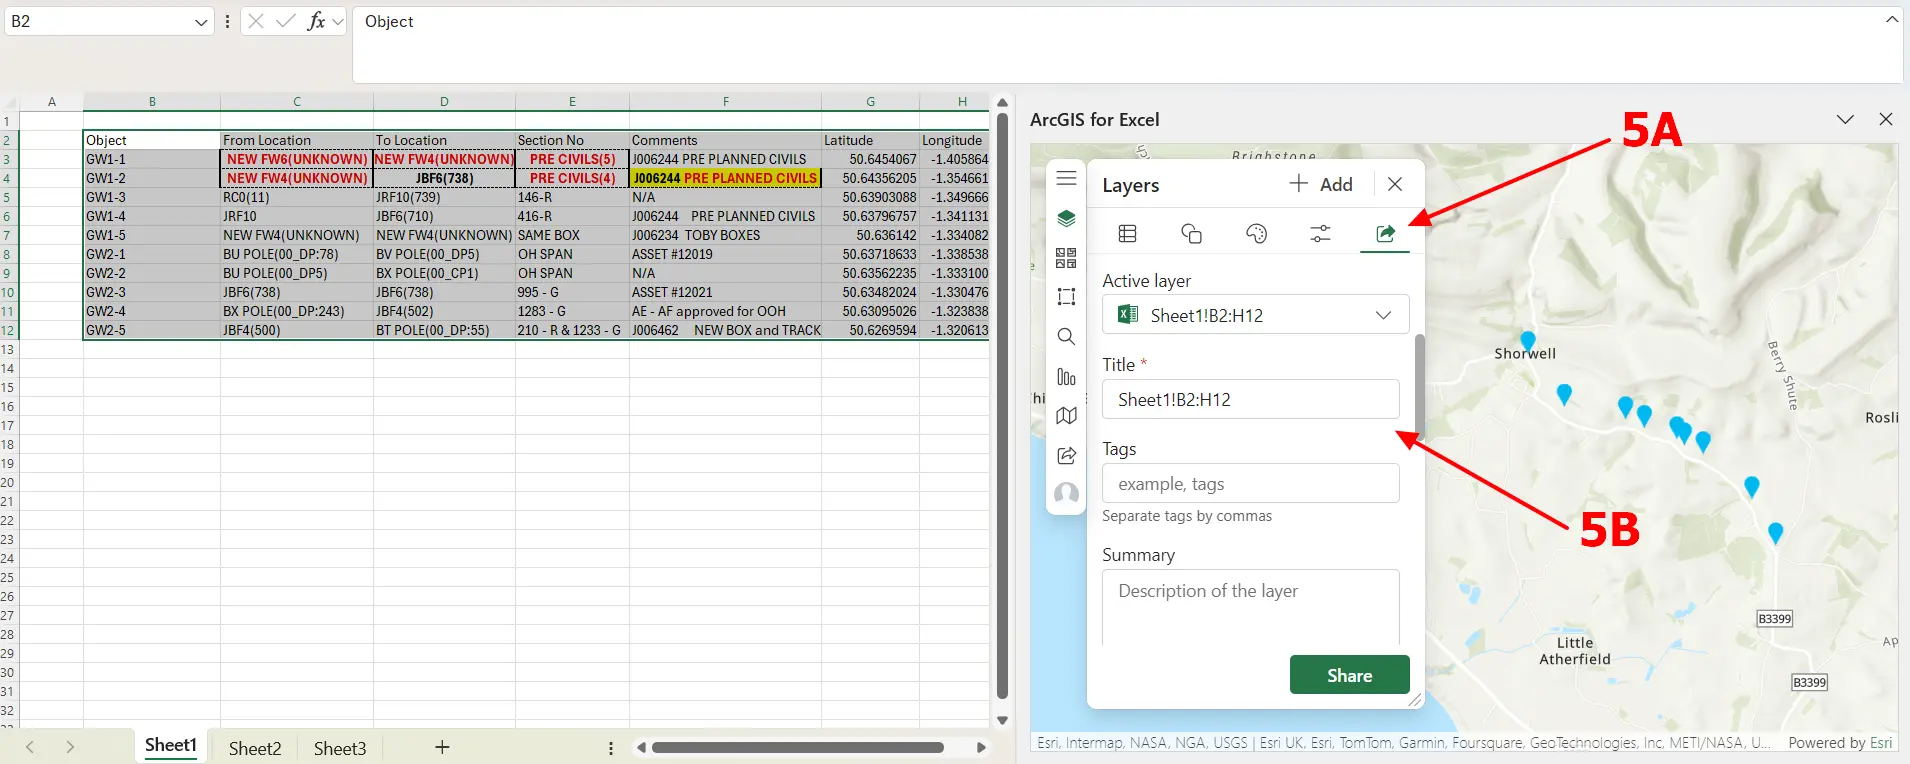
3. Share your layer (Pic. 5) using the Share icon on the top right (5A). Next, when the new interface appears, you can determine the name of your new layer, which is initially the same as your active layer (5B). Even if you forget to do it, the chance for it will be later.
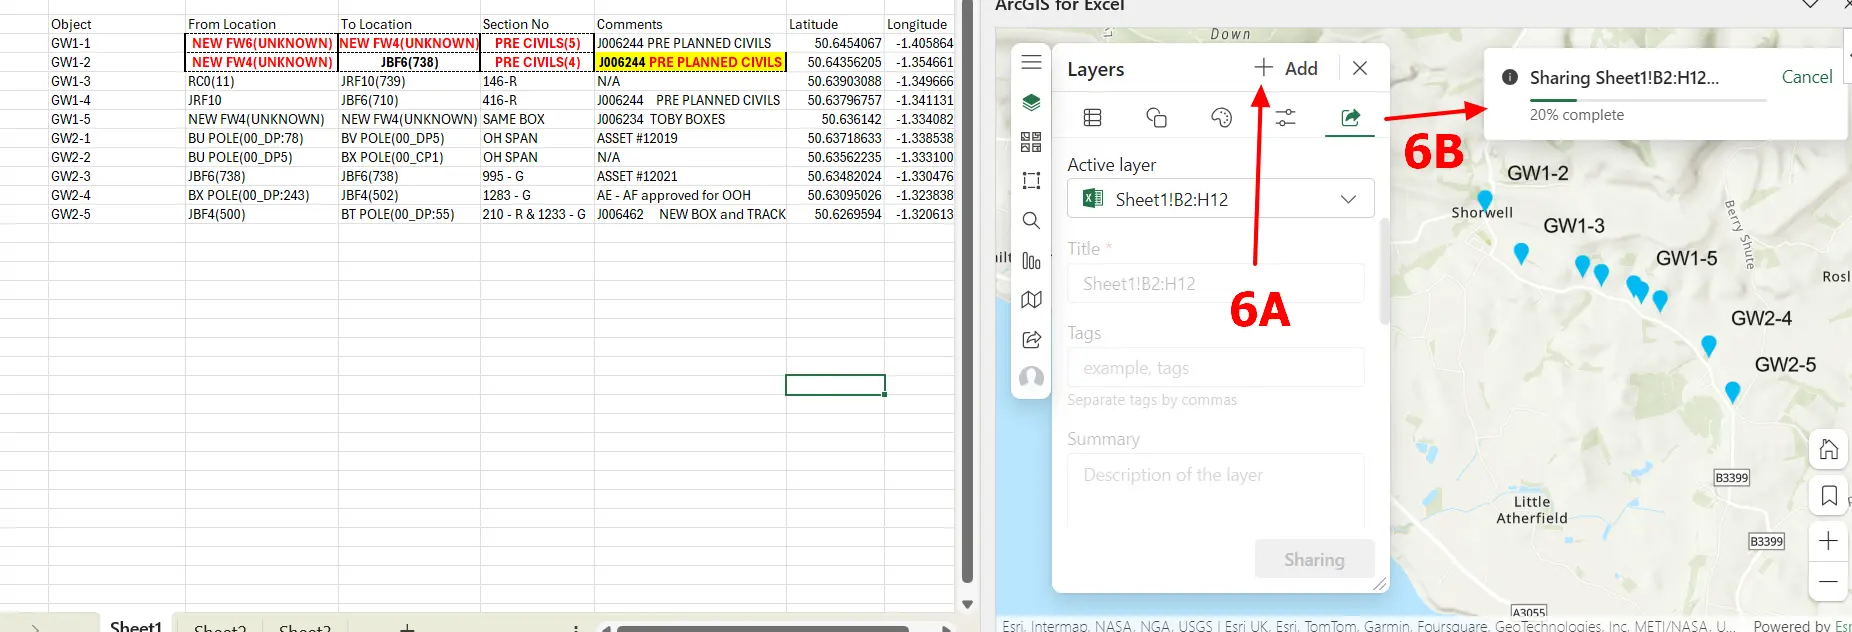
As an output, you will have the new Feature hosted layer, including your Excel data. If you have a few layers added this way, you can export all of them as an entire map (Pic. 7)

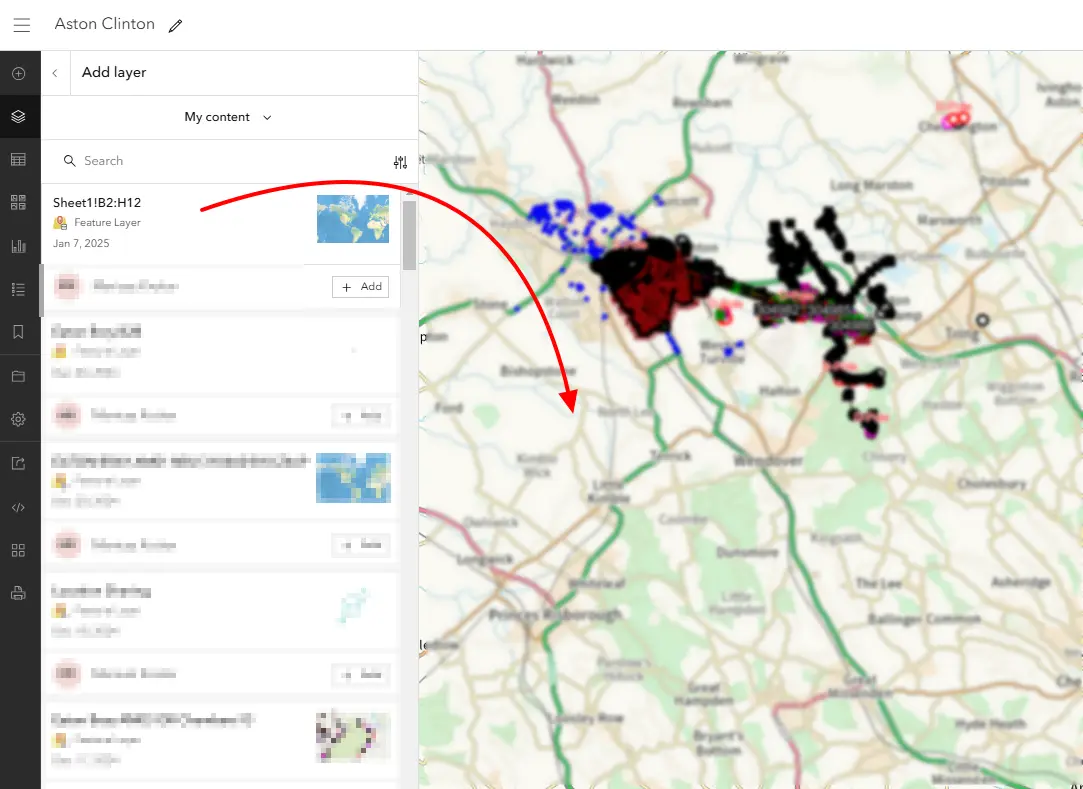
Since our layer is feature-hosted, we can optimize it however we want. Read more in other sections on how to do it. However, some crucial parts are essential to explain right here. Earlier in this text is the information about the Excel column headers. They’re reflected accurately in Popups and editing mode, as you can see below (Pic. 9, 10).
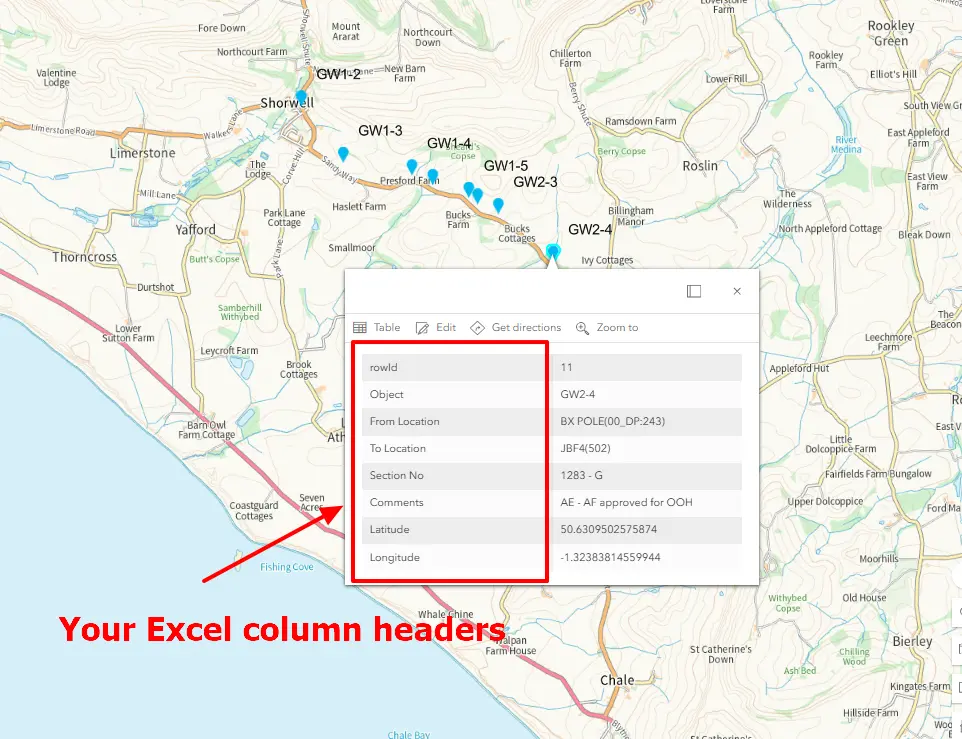
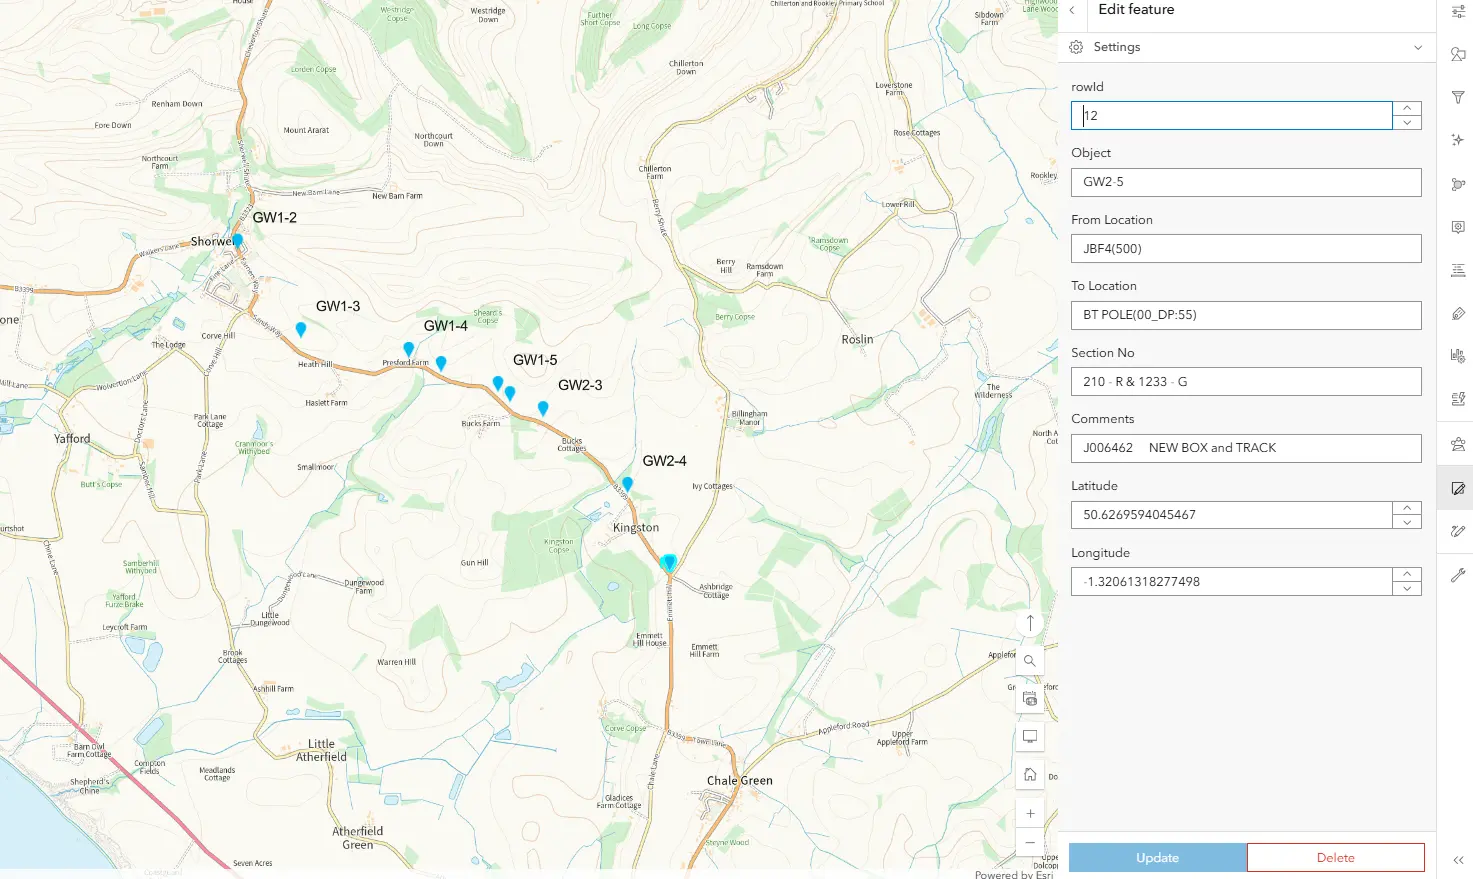
The behavior of our feature-hosted layer is the same as others!
Mariusz Krukar
Links:
- Doc.arcgis.com: Get started with arcgis for excel
- ArcGIS for Excel
- ESRI: ArcGIS for Excel – an overview
- Introduction to ArcGIS for Excel
- Esri.com:introducing-arcgis-for-excel/
- Learn.arcgis.com: Get started with arcgis for excel/
- Resource.esriuk.com: Mapping-your-spreadsheets-with-arcgis-for-excel/
Youtube:
