
A data attribute table is a pivot thing in QGIS. This is the core element of each layer, which stores all the databases. Every user must remember that layer is not just the geometry visible on the map. The layer is also a database on which most of our QGIS operations are based. We can use the various styling, labeling, and selections, which are based on the attribute data. Each formulation requires some data to stick to, therefore having something apart just from the geometry is mandatory!
The image below shows the visual components of the data attribute table window, which will be described further down (Pic. 1).
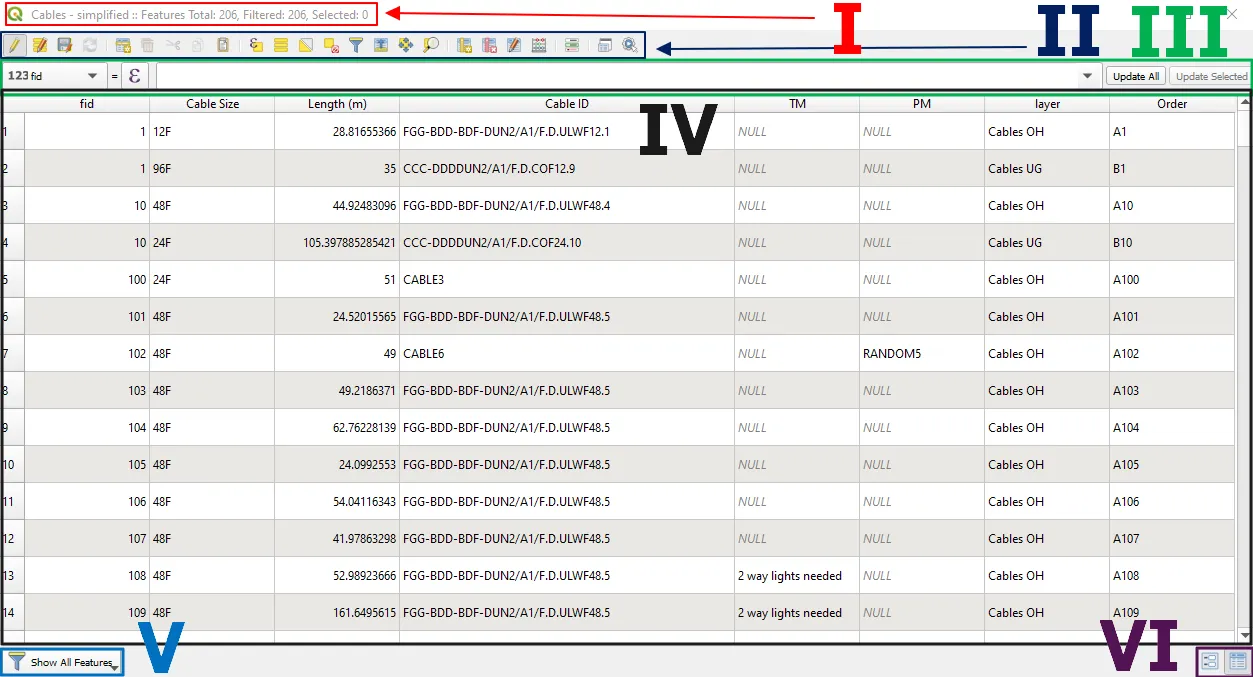
Pic. 1 The major components of the QGIS attribute table.
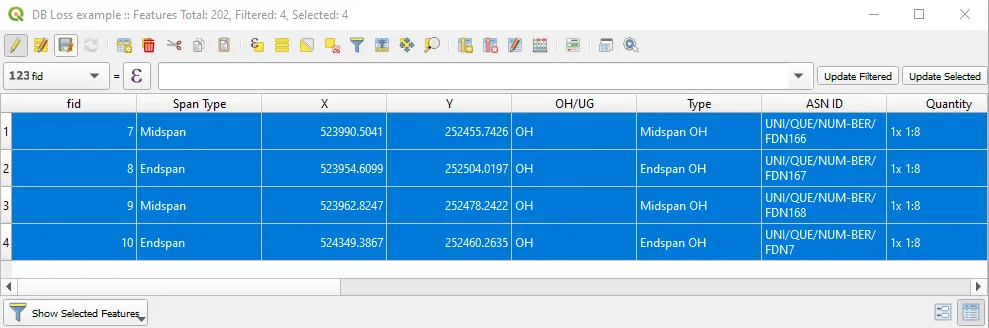
I – Total features count – user can calculate how many items are included in the layer. It’s a quick method, but better for use when some random features are selected. Every time when our attribute table dock is opened in the top left corner, we can see how many features we have in total, and how many of them have been filtered (Pic. 2).
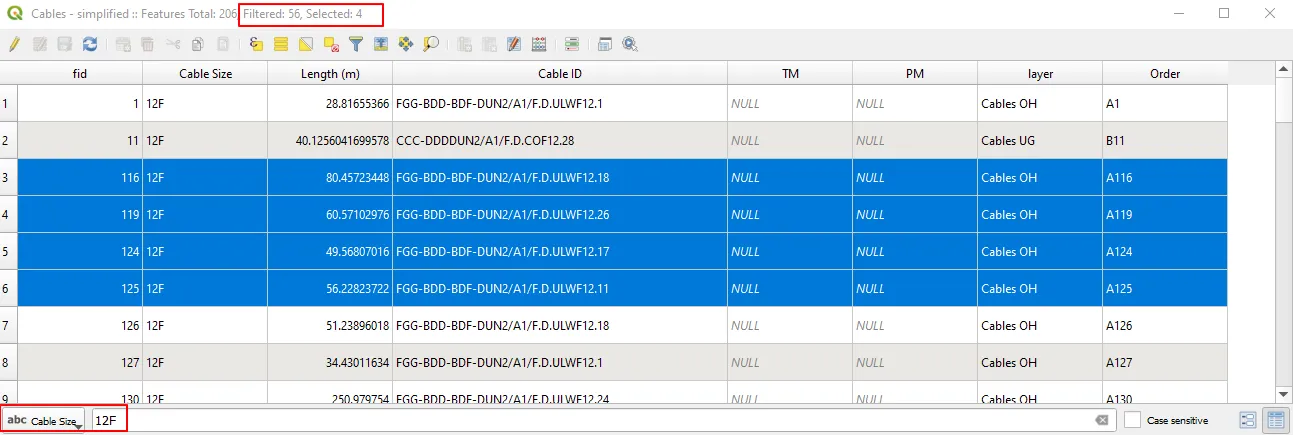
Pic. 2 Filtered and selected data in the attribute table.
This is surely not the only way how we can filter our attribute table data. Similar filtration can be done by categorized or rule-based styling and next displaying the “Show feature count” in the right-click layer properties.
Another value corresponds to the selected items. When you select any items within the given layer both in your QGIS map or in the attribute table, then the number of selected features will appear in the top-left attribute table dock calculation.
II – Data attribute table toolbar – the main toolbar, where a user can find a bunch of various options (Pic. 3). All of them have been deliberately described below:
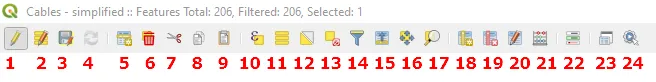
Pic. 3 The main toolbar of the QGIS data attribute table.
1 – Toggle editing mode – makes the data attribute table editable or not. Once toggled we have the attribute table content editable and most of the other options active. It works on the same basis as in the case of layers. By toggling the editing mode off QGIS will ask us about saving the current changes.
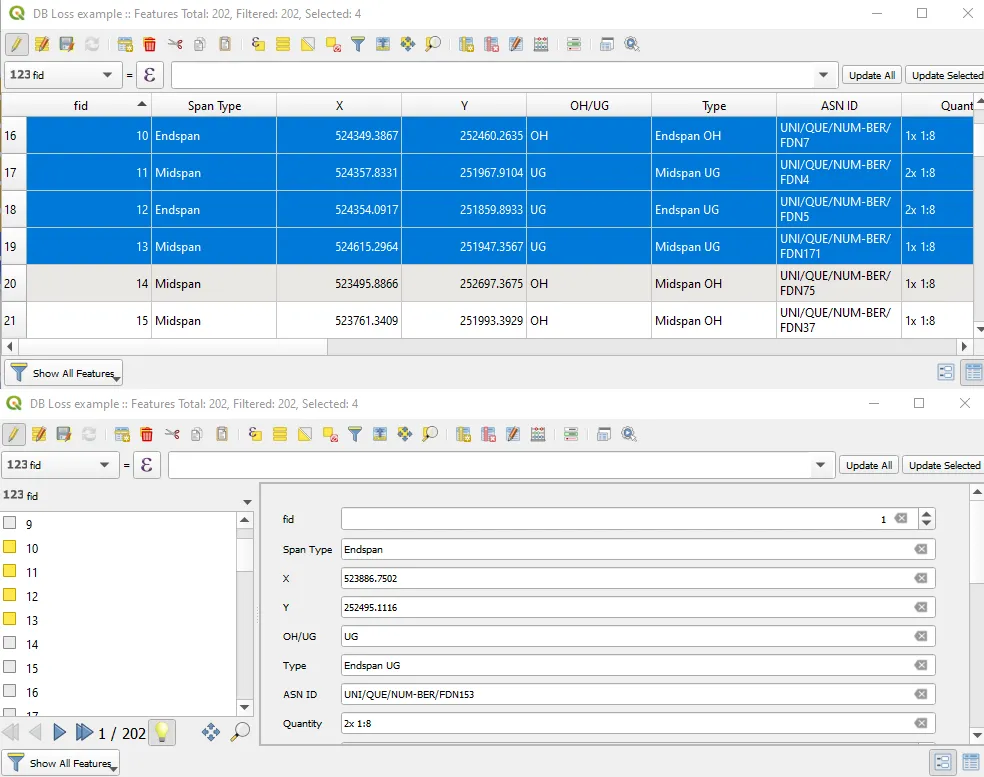
2 – Toggle multi-edit mode – works for many features. The basic workplace here is the form view instead of the table view (Pic. 4). When something is selected, it appears as the yellow box on the left, which corresponds to the highlighted blue line in the table view as shown above (Pic. 2).
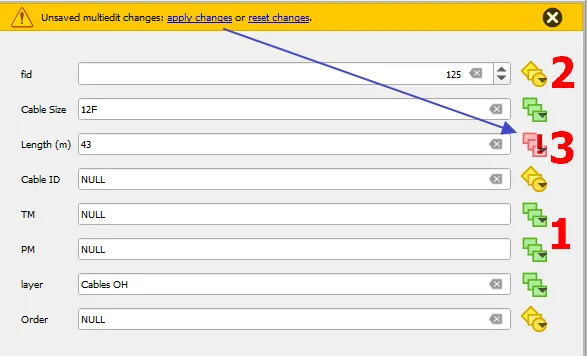
Pic. 4 Multi-edit mode in the QGIS attribute table form view, where important are the colored shapes allocated to each value (column): 1 – All features in the selection have equal value; 2 – Some features in the selection have different values; 3 – Changes to selection have been applied and not saved.
Important is the symbology here, which can be seen on the right. Green shapes mean, that the value provided is the same for all selected features. Yellow shapes forewarn us, that the values vary across the selected features. The red signatures state as an alert, that some changes have been made and not saved. Users must bear it in mind before making some edits. This multi-edit mode can be somewhat replaced by using the appropriate expressions across the data attribute table. Some expressions for all selected features can be still provided in the “formula bar” placed at the top, which will be discussed later.
3 – Save edits – Saves all changes. When edits are saved this way, switching off editing mode won’t run the pop-up save changes alert.
4 – Reload the table – simply refresh the attribute table content.
5 – Add feature – a completely new feature is added to our attribute table. Don’t expect it on the map because the geometry is not provided. By zooming into the feature, you should expect an error saying, that our “feature has no geometry” (Pic. 5). A problem such as this can be fixed by using the “Add Part” option in the Advanced Digitizing Toolbar.
Pic. 5 The new feature added in the attribute table has no geometry and therefore cannot be displayed on the map.
6 – Delete selected features – by clicking this option we are removing everything, that was selected previously.
7 – Cut selected rows to clipboard – cut selected rows to clipboard as the name of this option says.
8 – Copy selected rows to the clipboard
9 – Paste features from the clipboard
10 – Select feature by the expression – a nice way of choosing the essential features by typing some expression, which can be very simple or advanced depending on the purpose (Pic. 6). Since our “Output preview” doesn’t throw an error, we can make sure, that the formula is good. Sometimes despite a lack of error, the expression cannot execute the result properly. It means, that the value under the given criteria provided doesn’t exist in this collection.
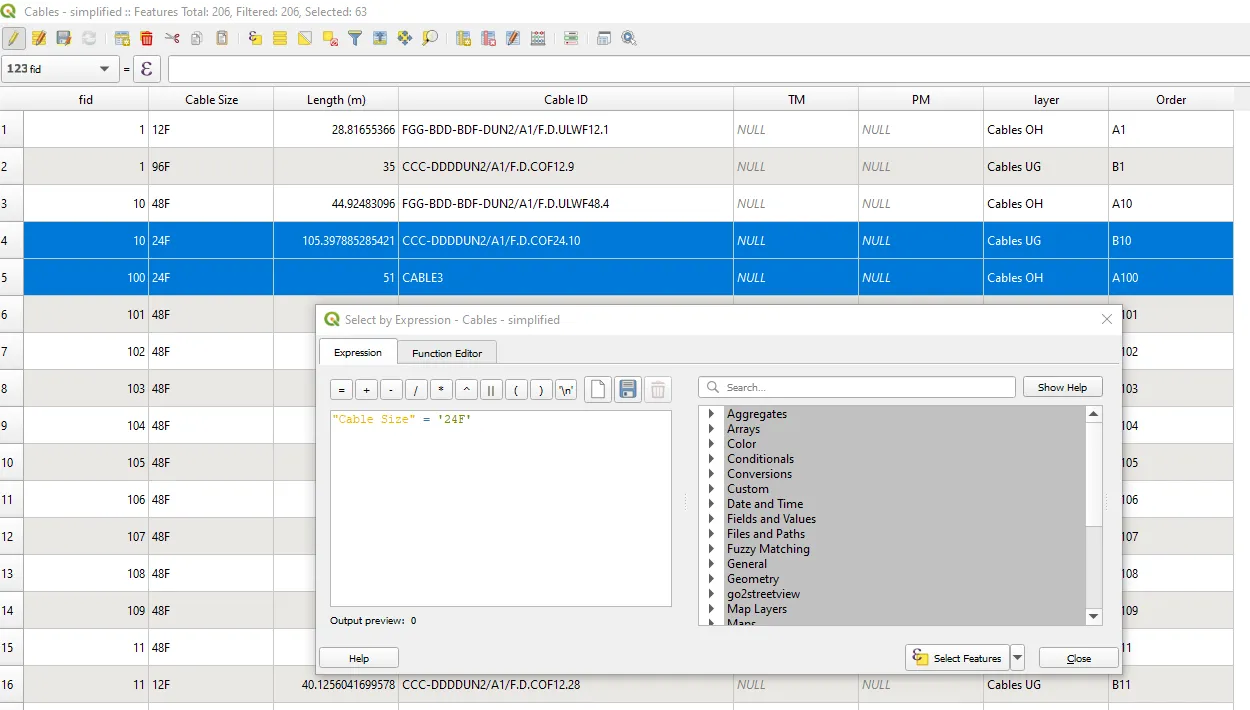
Pic. 6 Selection by expression in QGIS attribute table.
11 – Select All – Select all the items belonging to our layer.
12 – Invert Selection – overturn the previous selection of features.
13 – Deselect All – removes selection from the attribute table.
14 – Select/Filter features using form – pretty much analogous approach to selection features by expression. In this case instead of expressions we have a nice alternative for someone, who is not savvy enough. Thereby anyone, who starts using QGIS can play with it (Pic. 7).
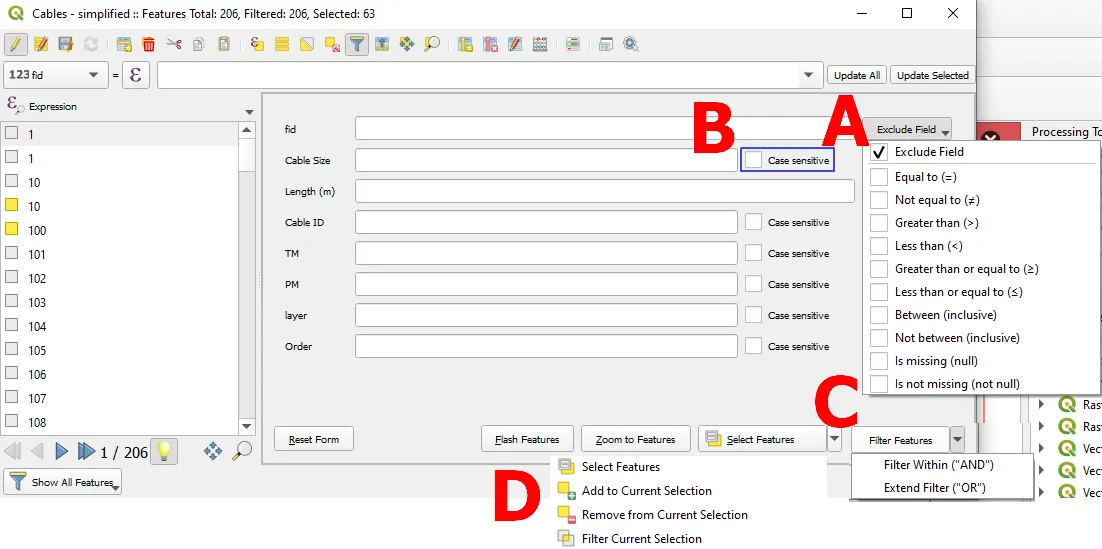
Pic. 6 Filtering attribute features in QGIS where: A – basic filter features; B – Case sensitive option; C – Extended filter features (OR/AND); D – Manual selections.
Each column has its own options to choose from, which you can see above. By default “Exclude Field” is toggled, but we can provide our own value, which appears across the attributes, and define the proper condition to it. Each condition can be “Case sensitive”, which means that our records are differentiated between capital and lower-case letters. Now let’s go through the options at the bottom (Pic. 6):
-> Reset form – clears all conditions applied.
-> Flash Features – just a brief blazing of the layer content (watch the video below), which has been filtered.
-> Zoom to features – when clicked QGIS will redirect us to the given object or group of objects selected.
-> Select Features – as you can see there’s not only one option there (Pic. 7, ), because we can add them to a current existing selection, remove them from the existing selection, or filter the current selection. The last option is just reducing the number of selected features by adding an additional condition. We might as well use the “Select Features” instead.
-> Filter Features -> by two options, within and outside. By using one of them the QGIS we are building an expression automatically and using it via Advanced Filter (Pic. 7).
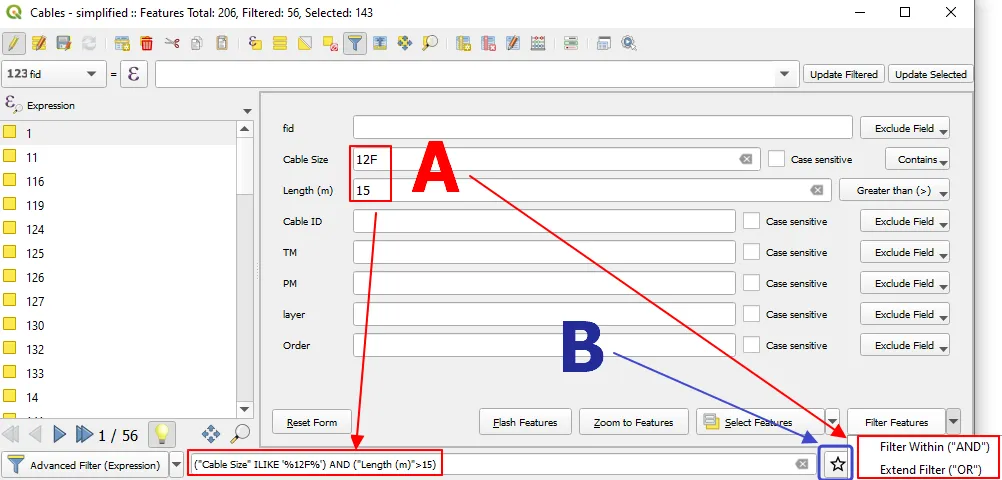
Pic. 7 Filter features with autogenerated expression in QGIS attribute table, where A – criteria applied; B – option for saving the expression.
This expression can be saved (stored) in the “Star” button. The best thing here is, that QGIS generates the expressions for you when you set the filtering criteria.
15 – Move selection to the top – takes our records to the very beginning of our table. When switched on every other selected feature will be brought at the very beginning of our layer instantly.
16 – Pan map to the selected rows – centers our map canvas to the selected layer items, which act as rows in the data attribute table.
17 – Zoom map to the selected rows – adjusts zoom level to selected features and pans it automatically as well.
18 – New Field – We can append our data attribute table by creating a new column (field) (Pic. 8). The column for all the features will be empty (NULL) as default.
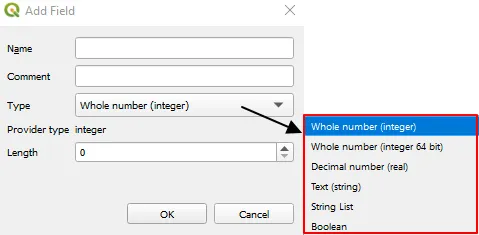
Pic. 8 Adding a new column to the attribute table with available options.
19 – Delete field – when we are sure, that the given column is not needed anymore, we can delete it.
20 – Organize columns – we can change their order. It’s just a temporary thing, which doesn’t work all the time. After saving our layer to some formats the order might be forgotten, therefore better is better to refactor our attribute fields.
21 – Open Field calculator – it’s an option for advanced users. Basically, we can shape our layer content by executing some formulas.
22 – Conditional formatting – is also an option for more advanced QGIS users, because it requires using formulas.
23 – Dock attribute table – a nice option allowing users to have both map canvas and attribute table in one working panel (Pic. 9).
Pic. 9 Attribute table docked in the map view in QGIS.
We can easily undock this attribute table dialog by clicking the double-box just next to the escape “cross” sign on the top right.
25 – Actions – Applying actions to our attribute table when available. The new “Action” column is created and the action is assigned to each feature separately.
III – Formula bar – analog input to Microsoft Excel where you can provide the formula (expression) and execute it in the data attribute table (the layer you are working on). It’s visible just when the layer is editable! At the end of this bar, you have two options. By clicking the first one, the provided expression will update everything in our layer regardless of the selection or filtering applied. The second option will update just selected records (Pic. 1, 9).
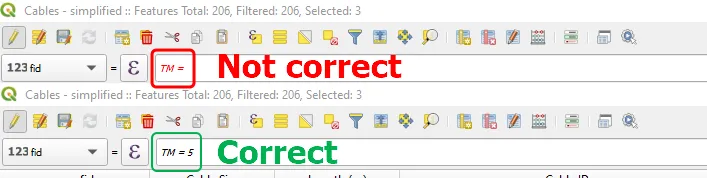
Pic. 10 The way we can type the expression in the attribute table formula bar correctly.
Important is to write the expression correctly. Since the text is red it means, that something is wrong with our formula and it can’t be executed. Black text means, that the provided formula is correct.
IV – Data attribute table – the most important content of the whole dock, where we have all information about every single item included in our layer. Depending on the amount of data we can have this content as wealth or poor. If you have more than shown in the image above (Pic. 1), you should see the horizontal slider at the bottom of this table.
V – Display options – as default we have the “Show All Features” toggled so a user can see everything, that belongs to the given layer. In fact, it’s not the only option here, other ones are shown and listed below (Pic. 10).
Pic. 10 Selecting criteria in the QGIS data attribute table.
-> Show Selected Features – displays only the stuff, which has been selected both on the map and in the attribute table. Remember, that everything that has been selected on the map will be selected in the data attribute table as well. It works the same way in an opposite direction and vice versa!
-> Show Features Visible on Map – a cool option, which displays only the stuff visible on the map at the current zoom level. It works analogically to the Box selection, where even a piece of item falling inside is enough to be selected.
-> Show Edited and New Features – displays only the features, which have been changed or added recently. It’s a good approach in the situation when we want to double-check what has happened with the layer items during our work process. The option is valid only when the layer is editable. Its pivot role is making sure, that everything is alright before we switch off the editing mode and save changes!
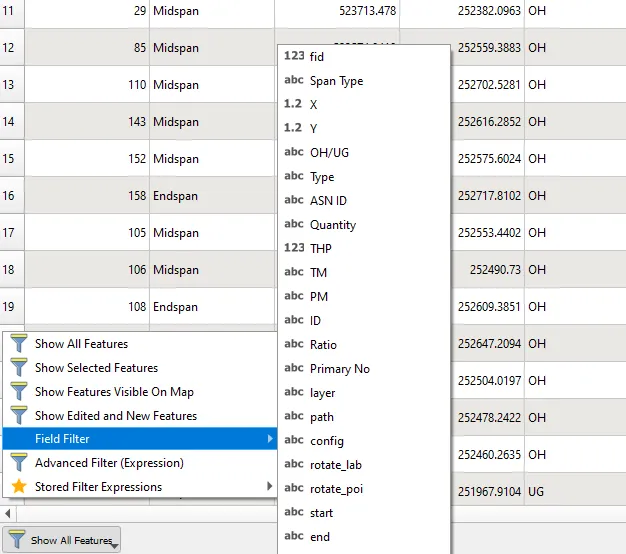
-> Field filter – classifying the features by a certain field (column), although an accurate value is required here.
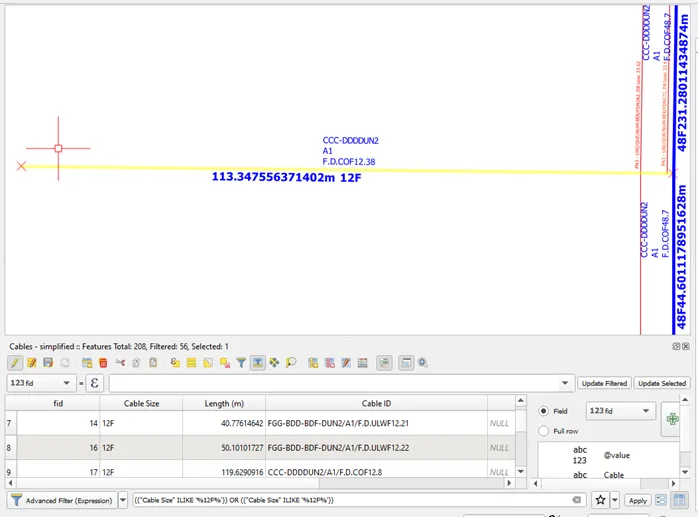
-> Advanced Filter (Expression) – filters features by expression applied (Pic. 11). QGIS will open the Expression builder for you, although next you just need to alter the expression at the bottom formula bar (Pic. 11).
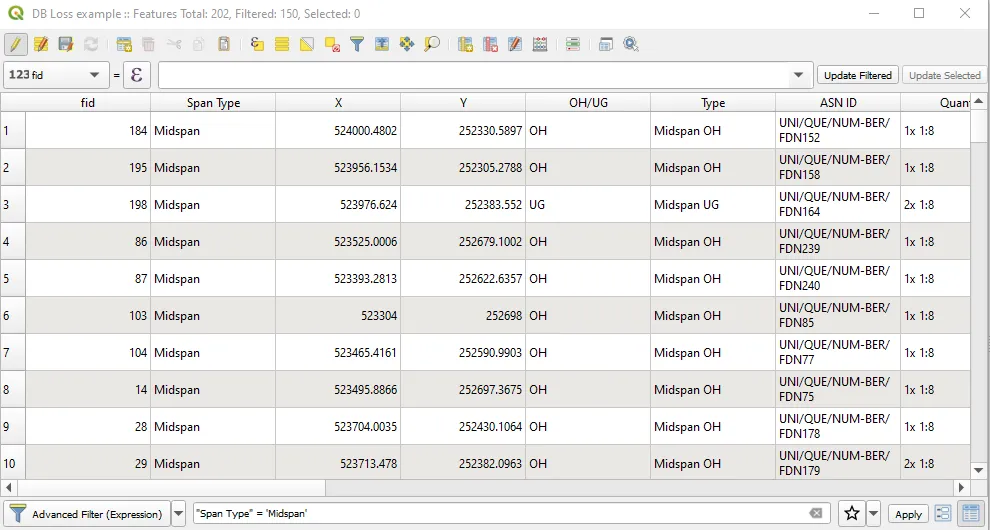
Pic. 11 QGIS attribute table filter by expression.
This expression can be stored for later purposes (Pic. 12).
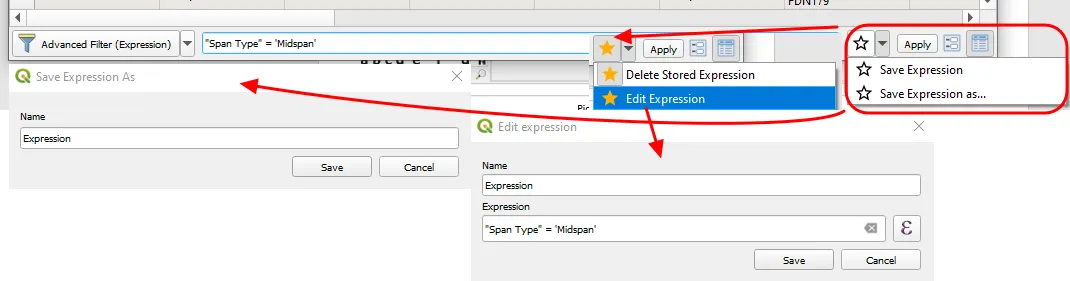
Pic. 12 Further working with expressions in QGIS attribute table.
-> Stored Filter Expressions – in the case when we have applied some expressions recently, they will appear in this option, facilitating us to use them in the future without typing them again. This is what is shown above (Pic. 12), it’s just another way of accessing previously saved expressions.
-> Current criterion – displays on which conditions we are making the current selection (Pic. 13).
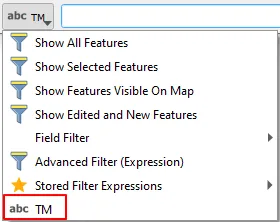
Pic. 13 Current criteria applied in the data attribute table.
It’s visible only in the case when using the “Field filter” option. Our current field, in which selection is based is visible below the whole list of options. Other criteria applied are visible in the filter button, which changes as some of the options from this list are applied (Pic. 14).
Pic. 14 Filtering selected features in the QGIS attribute table. Look at the filter button, which displays the “Show Selected Features” text.
VI – Switching Mode – we can toggle between the form view and table view. In the form view, we have a slightly different layout, which includes a few more options to manage the layer features.
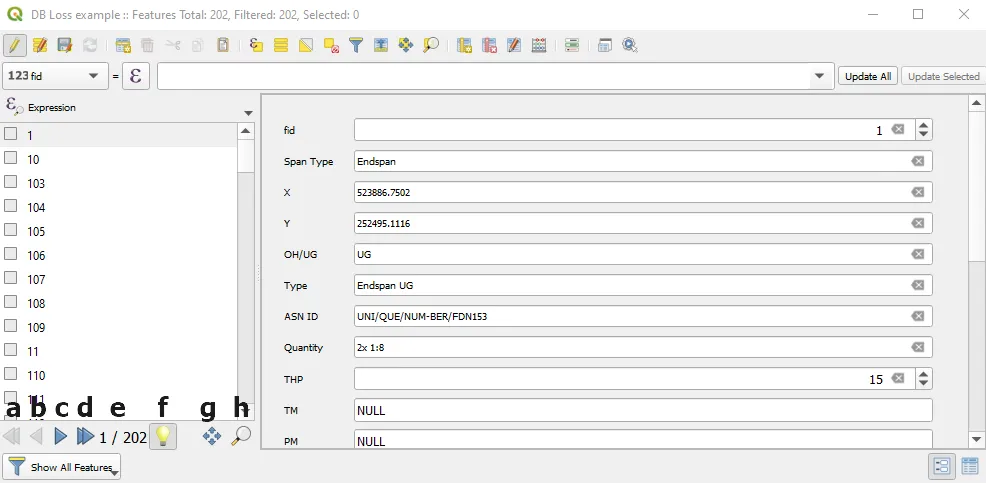
Pic. 15 The form view in the QGIS attribute table.
We have all layer features visible in the left sidebar, which can be displayed by scrolling up & down. When selected they are highlighted in yellow instead of blue used in the table view (Pic. 16).
Pic. 16 Comparison of selected features between two types of attribute table view – table view (top) and form view (bottom).
Moreover, a user can order all these features by some available criteria (Pic. 17).
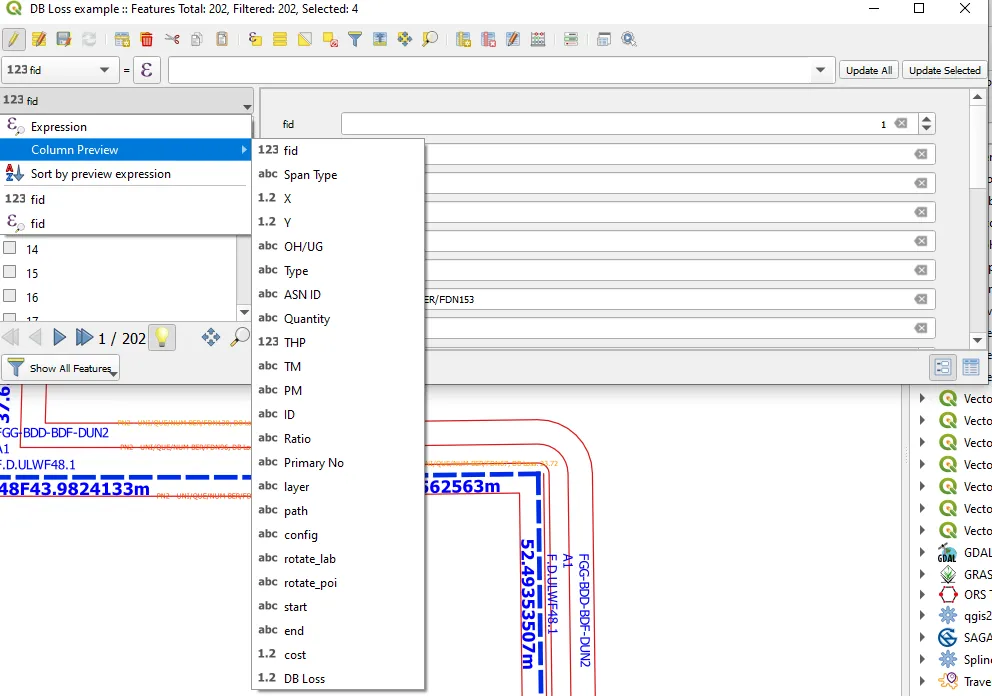
Pic. 17 QGIS attribute table – feature preview criteria.
Once some option is selected, the order of items presented in the form view left sidebar changes. These changes can be also applied to previously selected expressions. At the bottom of this sidebar, you can find a few symbols, which correspond to the following:
a – move to the very first item (very top of the list),
b – move to the previous,
c – move to the next,
d – move to the last (very bottom of the table),
e – order of the item (currently active 1st out of 200 included in the layer),
f – highlight the current feature on the map – by having it active we can take a look at where the feature is located (selected on the map),
g – automatically pan to current feature – when highlighted on the map, the user might not know its certain location, therefore clicking this icon QGIS will place the map area where the feature is located,
h – automatically zoom to the current feature – panning the map might be not enough when the zoom level is inappropriate. Clicking this icon QGIS will both pan and zoom to the location of the item at once.
Mariusz Krukar
Links:
- https://docs.qgis.org/2.18/en/docs/user_manual/working_with_vector/attribute_table.html
- http://www.qgistutorials.com/en/docs/3/working_with_attributes.html
- https://www.collinsdictionary.com/dictionary/english/case-sensitive
Forums:
- https://gis.stackexchange.com/questions/39365/qgis-attribute-table-not-displaying-data
- https://gis.stackexchange.com/questions/195646/attribute-field-name-is-not-case-sensitive-anymore-after-creating-new-layer
- Turning Multi edit mode off does not go back to table view
- https://gis.stackexchange.com/questions/233981/mapping-a-feature-from-the-attribute-table-in-qgis
- https://gis.stackexchange.com/questions/87871/qgis-select-features-from-attribute-table-using-the-like-operator
Youtube: