
Light surrounds us everywhere. This is an electromagnetic wave, which is the fastest in the environment. For Earth, the main source of light is the Sun. Another source is artificial lightning, created by humankind. In this article, I would like to bring a piece of relevant information about the essence of light surrounding us and the ways to measure it. This article doesn’t cover all issues and phenomena related to light, thus you will find a lot of links at the bottom of this reading.
- LIGHT PHENOMENA AND DIFFERENCES BETWEEN THEM
Before I describe the methods of light level measurements I would like to say something about the light phenomena in general. There are at least a few, knowing for us light phenomena, which are all around us in day-to-day life. Some of them are confused with others. That’s why I decided to clarify them for everyone.
Illuminance and luminous flux
Illuminance is a total luminous flux incident on the surface, per unit area. The luminous flux (called also luminous power) is the measure of the perceived power of light. The important thing is, that luminous flux is adjusted to reflect the varying sensitivity of the human eye to different wavelengths of light. Thus luminous flux is a quantitative expression, which refers to visible light only. Luminous flux is used as an objective measure of the useful light emitted by a light source. The measurement essence points out how bright is the beam in a particular direction. The luminous flux determines the illuminance value.
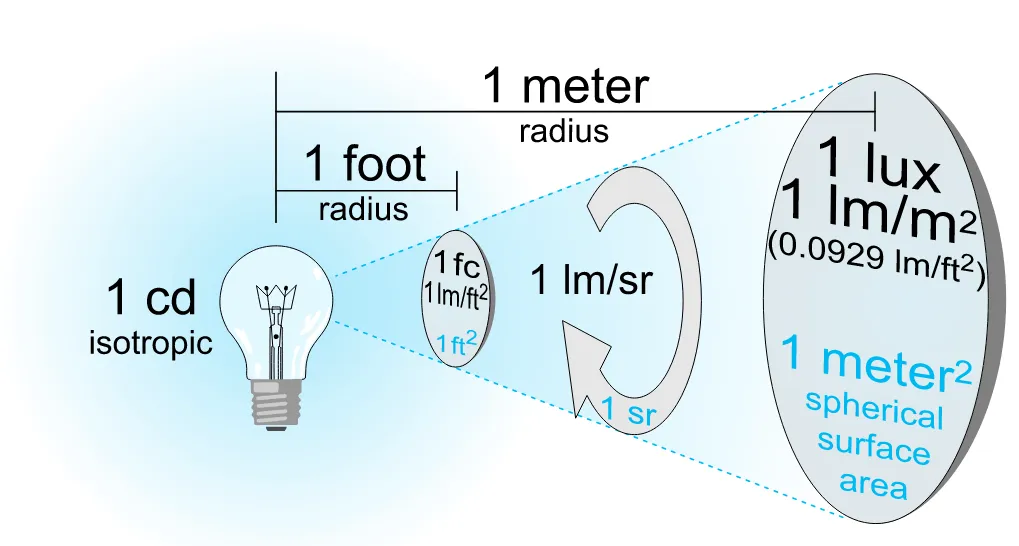
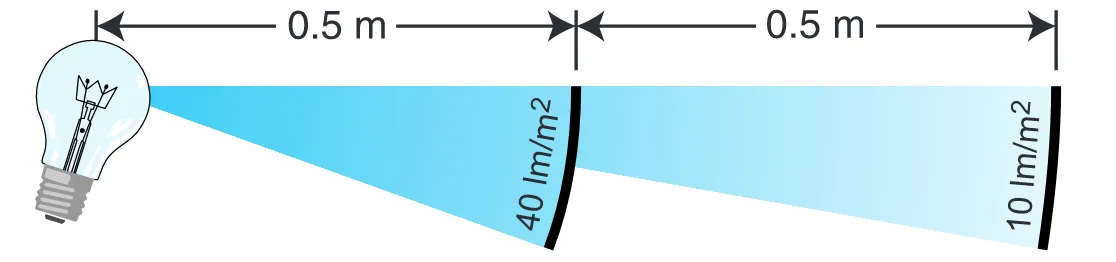
Illuminance is a measure of how much luminous flux is spread over a given area. It refers to the total “amount” of visible light present and the total surface, which is also important. A given amount of light will illuminate a surface more dimly if it is spread over a larger area, so illuminance is inversely proportional to the area when the luminous flux is held constant. This is analog to the inverse-square law (Pic. 2). The basic illuminance unit is lumen, measuring the total quantity of visible light emitted by a source. The lumen is comprised of candela – the base unit of luminous intensity and steradian – the solid angle being a ratio between the area subtended and the square of its distance from the center.
The most important point is, that illuminance is never directly visible as a quantity of light. We only see its reflected image as the luminance of physical surfaces. Our judgment that areas are brightly or dimly lit is actually based on our perception of the light reflected from familiar surfaces, such as white walls.
We have to also know, that illuminance does not specify light sources. Illuminance describes the light power incident on a specific surface at a specific location in space. From an illuminance measurement alone we cannot infer the power, size, or number of light sources. It is analogous to the “blind” skin sensation of heat on our body that can be induced by the distant Sun or by a nearby light bulb: the sensation of heat tells you nothing about the source. These examples show the ambiguous way to measure the illumination level. Firstly if we want to describe the light provided by a specific light source, then we must exclude all other light sources from the measurement. If we want to determine the light incident on a specific physical surface, then we must sum the illuminance of all the light sources illuminating it. We can describe illumination in the Lux unit.
Illuminance vs luminance
It is good to explain the difference between illuminance and luminance because these 2 terms cannot be used interchangeably. Illuminance describes the measurement of the amount of light falling onto and spreading over a given surface area. Illuminance refers to a specific kind of light measurement then. Luminance describes the measurement of the amount of light-emitting, passing through or reflected from a particular surface from a solid angle. It also indicates how much luminous power can be perceived by the human eye. This means, that luminance indicates the brightness of light emitted or reflected off of a surface. Luminance is thus an indicator of how bright the surface will appear.
Illuminance vs irradiance
The irradiance is a measure of radiometric flux per unit area or flux density. The SI unit of irradiance is the watt per square meter (W/m2). In astronomy often the CGS unit erg per square centimeter per second (erg.cm-2.s-1) is used. The irradiance has the same physical dimensions as intensity so is often called intensity, however, this usage can lead to confusion with radiant intensity. A watt is a unit of power, which is a measure of radiant flux. Power indicates how much energy the bulb will use. Basically the 1/683 watt or 555 nanometres green light provides one lumen. This dependency tells us, that 1 watt of pure green 555 nm light includes 683 lumens. The relationship between lumens to watts depends on the wavelength according to how visible the wavelength is. For example, infrared and ultraviolet radiation are visible and do not count. More information about this you will find in the next section below.
Illumination
Illumination is the deliberate use of light to achieve a practical or aesthetic effect. Illumination includes the use of both artificial light sources and daylight. Daylight is sometimes the main source of light during the daytime in buildings. Through daylighting practice, we can effectively adjust our internal lighting to maximize visual comfort or reduce energy use.
Luminosity and brightness
Luminosity is the rate of emitting energy in the form of light by the object. We can measure the luminosity in Watts. Brightness is the amount of light that we detect from an object. The detection of this energy does depend on the distance to the light source. This light detector can be our eye, a digital detector inside a camera, or any other device, that records the reception of light. Remember, that every light detector receives light in a given area, over which it collects and detects light.
2. BASIC MEASUREMENT UNITS
The basic, SI-derived unit for illuminance and luminous emittance measurements is Lux (lx). The Lux is used as a measure of the intensity of light, as it is perceived by the human eye. Furthermore, the Lux measures the luminous flux per unit area.
1 lx = 1 lm/m2 ; where: lx – Lux, lm – Lumen, m2 – square meter
Lumen – is an SI-derived unit of luminous flux. Lumen measures the total quantity of light emitted by a source. The Lumen is defined in relation to the candela as
1 lm = 1 cd * sr; where: lm – Lumen, cd – Candela, sr – Steradian
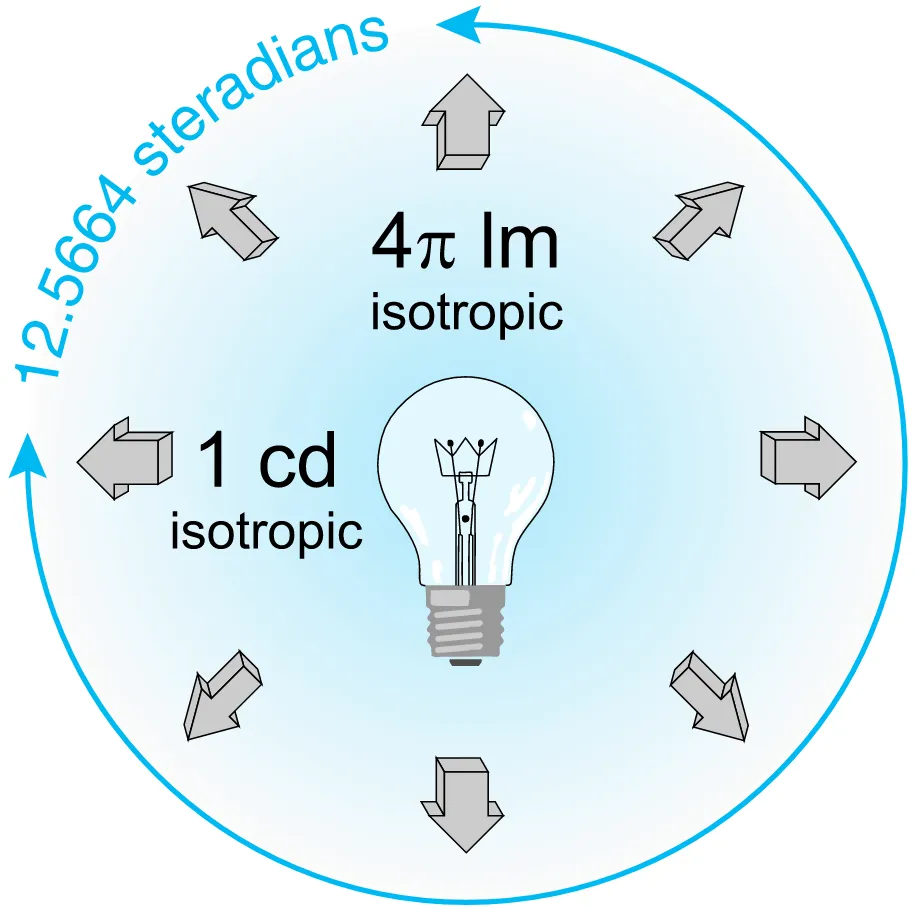
As we know one steradian is just one solid angle on a sphere. Considering a whole sphere then (Pic. 3) we have a 4π steradians. Light source uniformly radiates one candela in all directions according to the formula below:
1 cd * 4π sr = 4π cd * sr ≈ 12, 57 lm; where: cd – Candela, sr – Steradian, lm – Lumen
Candela is a basic SI unit of luminous intensity in a given direction and also a base unit of light measurement. Candela emits 1 lumen per steradian in all directions.
1 cd = 1 lm/ 1 sr; where: cd – Candela, lm – Lumen, sr – Steradian
A basic SI unit of luminance is candela per square meter (cd/m2), which can be replaced by the non-SI unit – the Nit.
1 nt = 1 cd / m2 ; where: nt – Nit, cd – Candela
The last important SI unit, described in this article will be Watt, which is the unit of power, and the basic SI unit of irradiance. Irradiance is expressed with Watt per square meter.
Watt is a unit of 1 joule per second.
1 W = 1 j/ 1 s; where: W – Watt, j – Joul
For us now the most important is to know what is the difference between 1 watt and 1 lumen. Lumen represents at least 1/683 watts of visible light power depending on the spectral distribution. However, the luminous efficacy varies depending on the source of light. For example:
1 halogen lamp – 20 lumens/watt
1 LED lamp – 90 lumens/watt
1 fluorescent lamp – 60 lumens/watt
1 light bulb – 17 lumens/watt
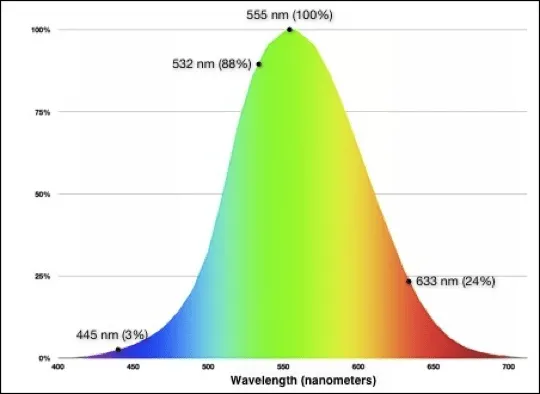
The maximum value of lumens per watt is 683 and occurs at 555 nm wavelength, which is green. For other monochromatic wavelengths, the lightning efficacy is reduced by a factor according to the sensitivity curve of an eye (Pic. 4). For instance, at the wavelength of the helium-neon laser at 633nm, the sensitivity of the eye is only 23,5% (Murphy, 2011). In this case, the peak will be at 160 lm/W.
Knowing these all values we can calculate the luminous efficiency, knowing more like an electrical efficiency. Luminous efficacy and luminous efficiency cannot be used interchangeably. The difference between luminous efficacy and luminous efficiency is that luminous efficacy indicates the ability of the light source to emit visible light using a given amount of power. We can see how well the light source turns input power into the desired output in lumens. Electrical efficiency is a useful power output divided by the total electric power consumed. The electrical efficiency is expressed in percentage. Typical examples of electrical efficiency are:
– incandescent light bulb – 2%
– white LED – 4-18%
3. HUMAN VISION OF LIGHT
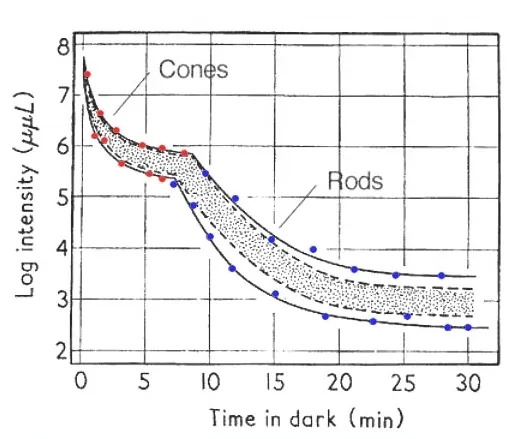
Illuminance correlates with how humans perceive the brightness of an illuminated area. The human visual system is capable of recording images across an enormous range of illumination but in different modes. Due to the level of illumination, human vision is different. The eye operates over a large range of light levels. The sensitivity of our eye can be measured by determining the absolute intensity threshold, which is the minimum luminance of a test spot required to produce a visual sensation (Kalloniatis, Luu, 1995). This can be measured by placing a subject in the darkroom and increasing the luminance of the test spot until its presence is reported by the subject. Consequently, dark adaptation refers to how the eye recovers its sensitivity in the dark after exposure to bright light. The dark adaptation curve (Pic. 5) has a duplex nature, where, in the first part cones play the main role and in the second part – the rods. Cones are able to adapt for up to 10 minutes. Rods in a longer time, up to 30 min.
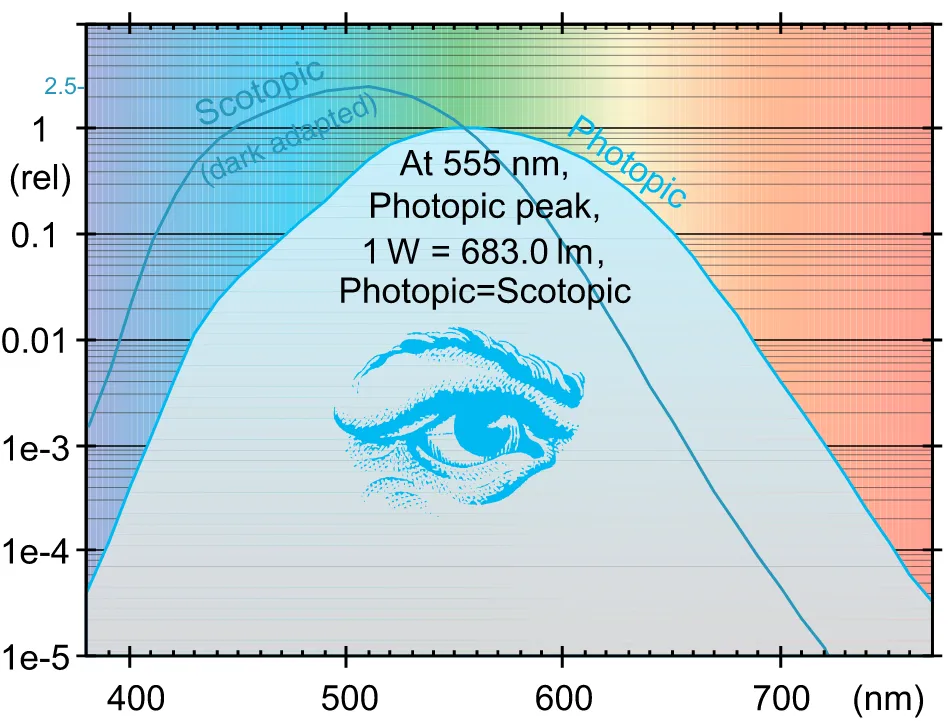
In the previous article about the light behavior in Earth’s atmosphere, I mentioned the wavelength spectrum visible to the human eye, however, it differs due to the illumination level as I wrote previously. Basically, human vision is enabled by three primary modes:
Photopic vision – the vision of the human eye under well-lit conditions with at least 10 lx with color perception allowance. The human eye is capable of distinguishing objects based on the wavelengths of the light they reflect, emit, or transmit. The main role plays cone cells, which sense light in three bands of colors. The biological pigments of the cones have maximum absorption values at wavelengths of about 420 nm (blue), 534 nm (bluish-green), and 564 nm (yellowish-green). Their sensitivity ranges overlap to provide vision throughout the visible spectrum, where the maximum efficacy is 683 lm/W at a wavelength of 555 nm (green) (Stroebel, Zakia, 1993). Photopic vision features also the fastest eye adaptation, up to 5 min whereas the transition from photopic to scotopic vision can take even 30 min.
Mesopic vision – is a combination of photopic and scotopic vision in low but not quite dark situations (Stockman, Sharpe, 2006). Mesopic light level ranges from 0.001 to 3 lx and it corresponds to most night-time outdoor and traffic lighting scenarios. In these vision conditions, human eyes use mainly rods to process light or both cones and rods. The effect of switching from cones to rods in processing light is called the Purkinje Effect. The Purkinje Effect is the tendency for the peak luminance sensitivity of the human eye to shift toward the blue end of the color spectrum at low illumination levels as part of dark adaptation (Frisby, 1980)(Purkinje, 1825). Practically this is a difference in color contrast under different levels of illumination.
Scopic vision – the vision of the eye under low-light vision. In the human eye, cone cells remain nonfunctional in low-light conditions. Scopic vision is produced exclusively through rod cells being much more sensitive to wavelengths around 498 nm (green-blue).
The Sun provides a quantity of illumination equivalent to 500 million bright planets or 400000 full Moons, yet our vision can adapt to light environments anywhere within this range.
4. LIGHT MEASUREMENT INSTRUMENTS AND APPS
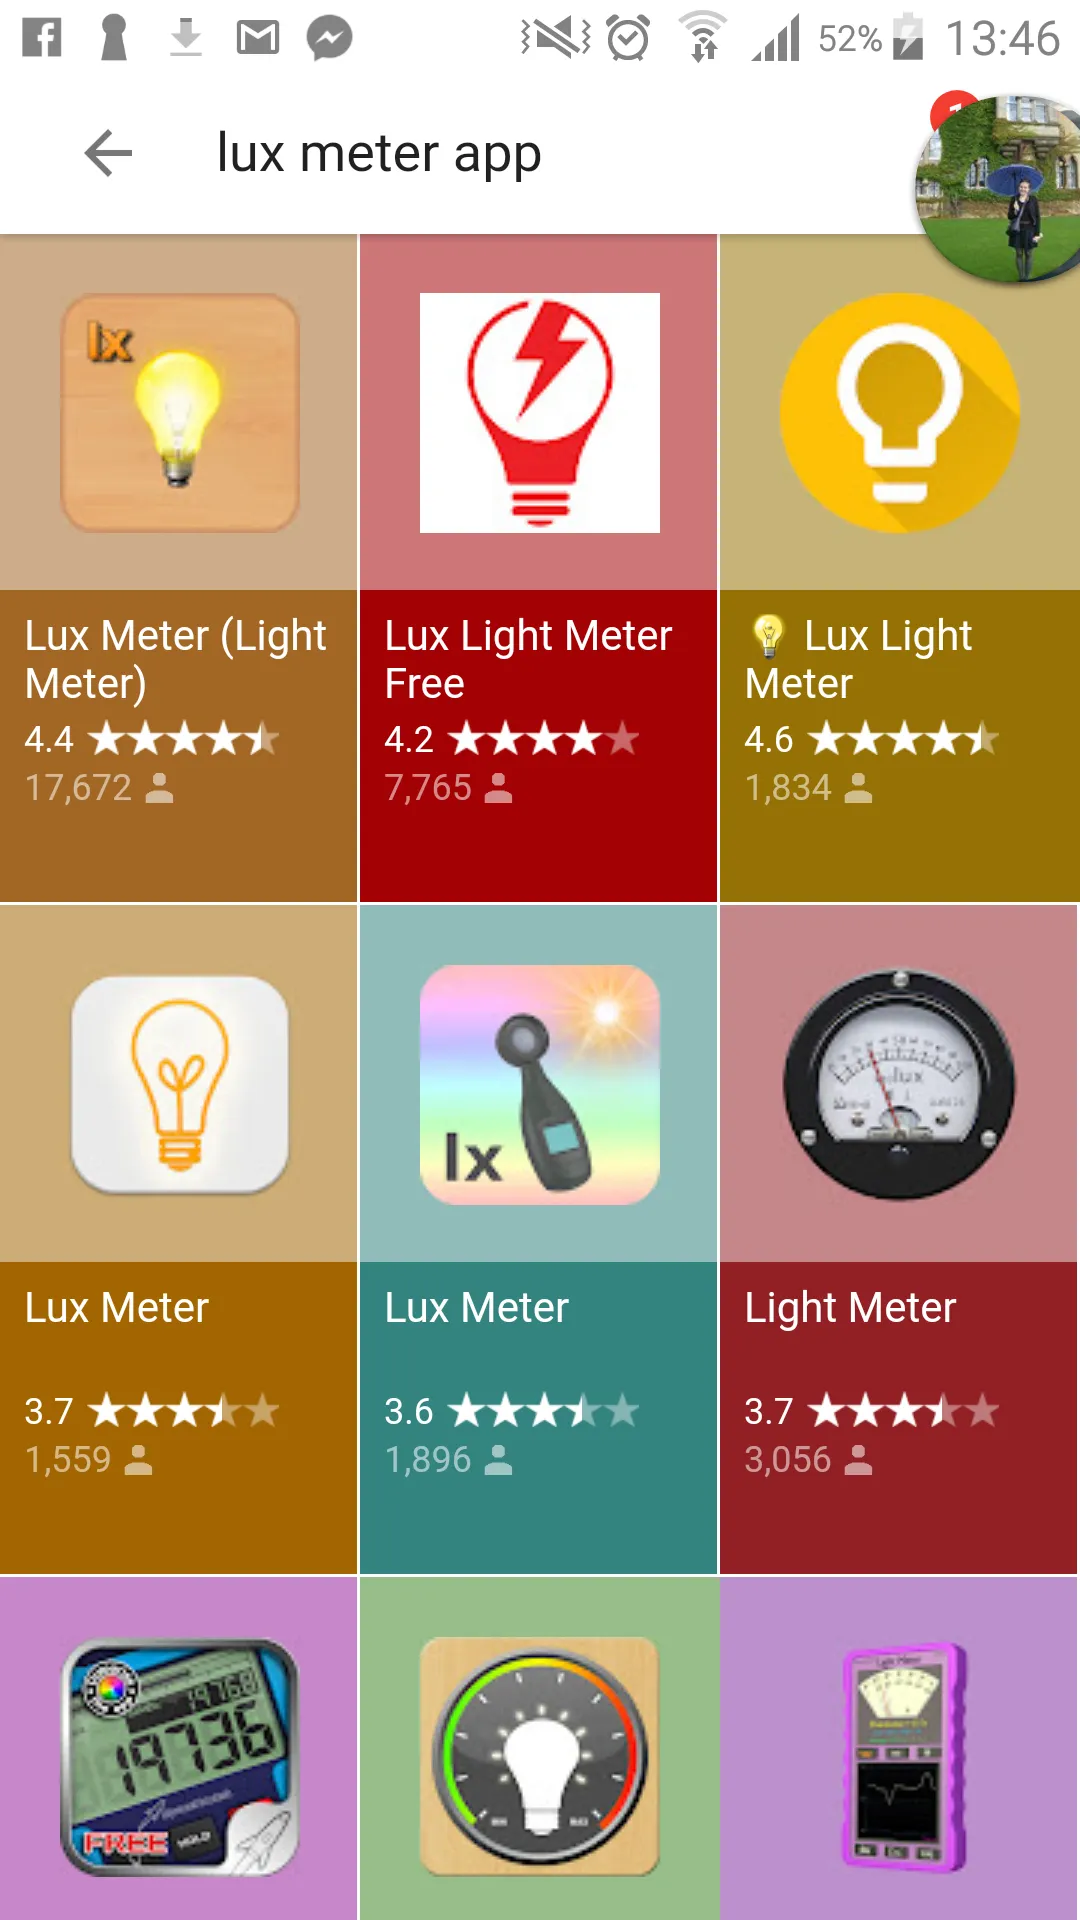
The simplest way to measure light is to buy a light meter (called also a Lux meter) or install Light measurement Android apps, most of which are free. Before I start to wonder how Lux meter apps work versus traditional measuring devices I bring a bit of information about the typical instruments.
A typical instrument, which measures the light level is the light meter. This instrument contains a sensor, that converts the light energy into an electrical charge, that can give the user a reading. The light meter is usually small enough to be hand-held and easily carried about.
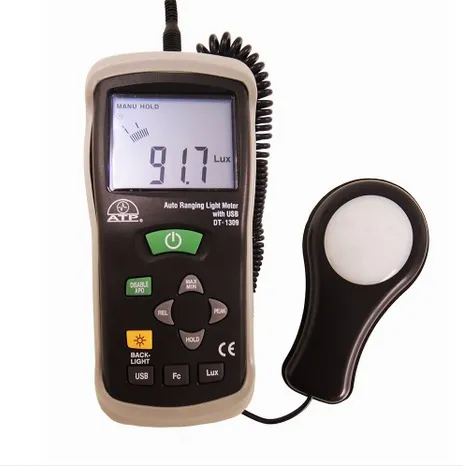
The light meter is simple to use. After taking a cap off the sensor, we should simply place it on a surface where a task is carried out such as the ground. It is important the sensor is placed on the surface as this is where the light is reflected into the user’s eye and represents the true level of light they receive. The Lux reading should be displayed on the screen. There is a lot of light meters with different scale and resolution. Remember, that the Lux meter only responds to visible light.
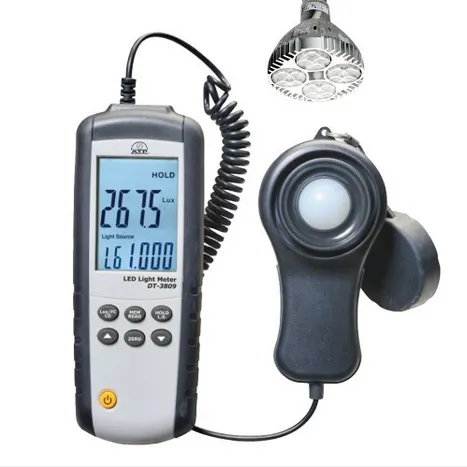
Another instrument is an LED light meter designated for LED lightning (Pic. 8).

LED lights produce white light very differently from incandescent lights. Incandescent lights come from the classic light bulb, where Light is produced by heating a wire filament to the proper temperature. Incandescent lights are omnidirectional unlike LED, which emits light in a particular direction. LED consists of two electrodes (an anode and a cathode) through which electricity flows in only one direction. Diodes are generally made from semiconductive materials such as silicon or selenium, which conduct electricity in some circumstances and not in others. When current passes through the semiconductor material the device emits visible light. LED light meter is useful for measuring and optimizing environmental light levels in a wide range of environments including a rich amount of anthropogenic objects.
Now Let’s consider the light measurement Android apps. There are at least a few light measurement software, that you can install on your mobile phone. The question is: Are they the same accuracy as their traditional counterparts? It depends on the hardware and software. The best software depends on the hardware. It is mainly Galactica and LightMeter. For older mobile phones the deviations from the reference luminance were in part extremely high. For newer, the results were better but still insufficient. The best value brought iPhone 5 with max. 3% deviation. The worst is the Samsung Galaxy S5 with a 113% deviation (Pic. 9).
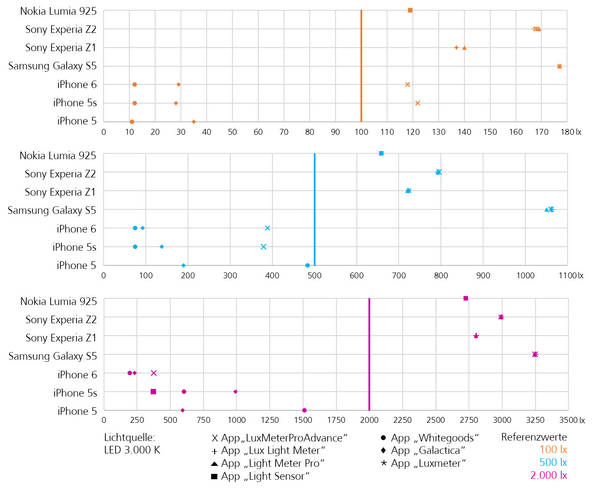
A median deviation from the reference value measured by all the apps on the Android smartphones was on average 60% above the reference value. You can do quite well your measurements only when you use a smartphone with the same app, already knowing the percentage deviation from the reference value. Remember that you still can face some ambiguities, because these percentage deviations can also vary within the illumination level, especially when the reference value is low (eg. 100 lx), as per the references above (Pic. 9).
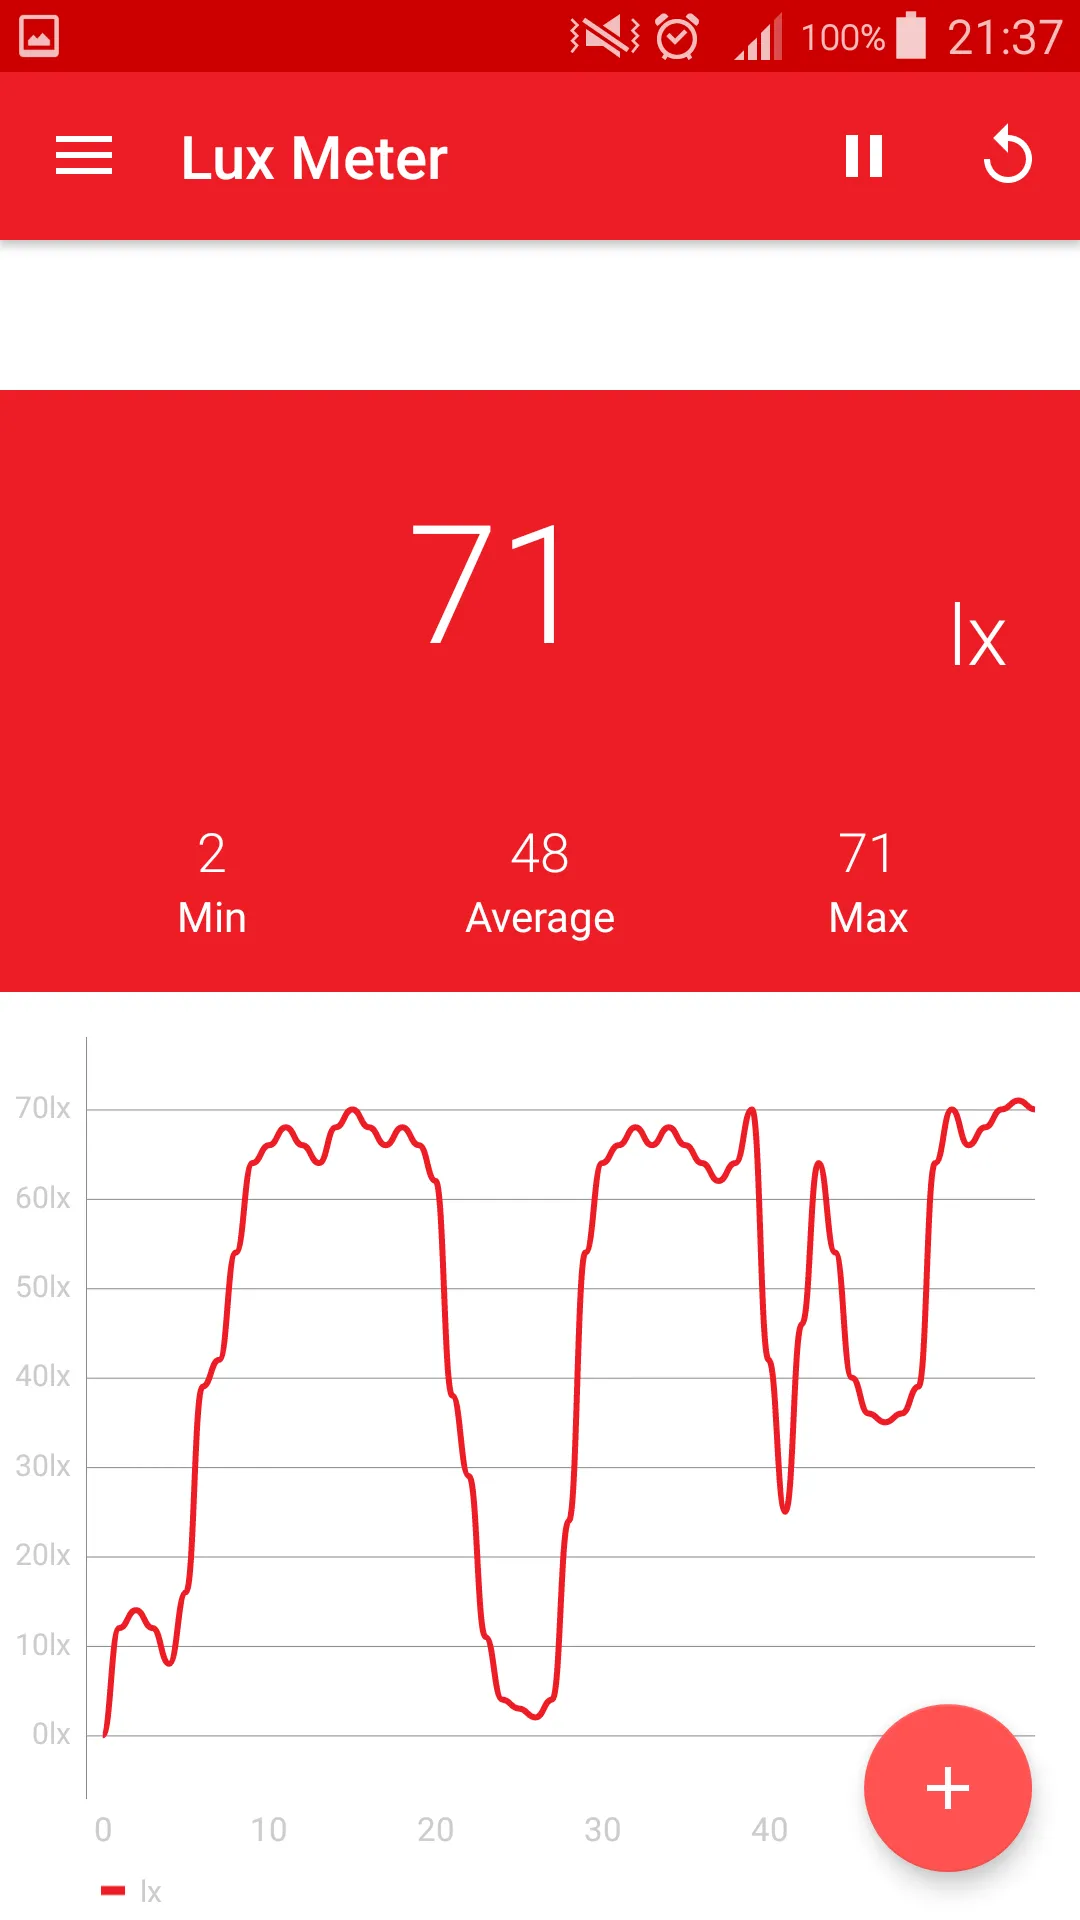
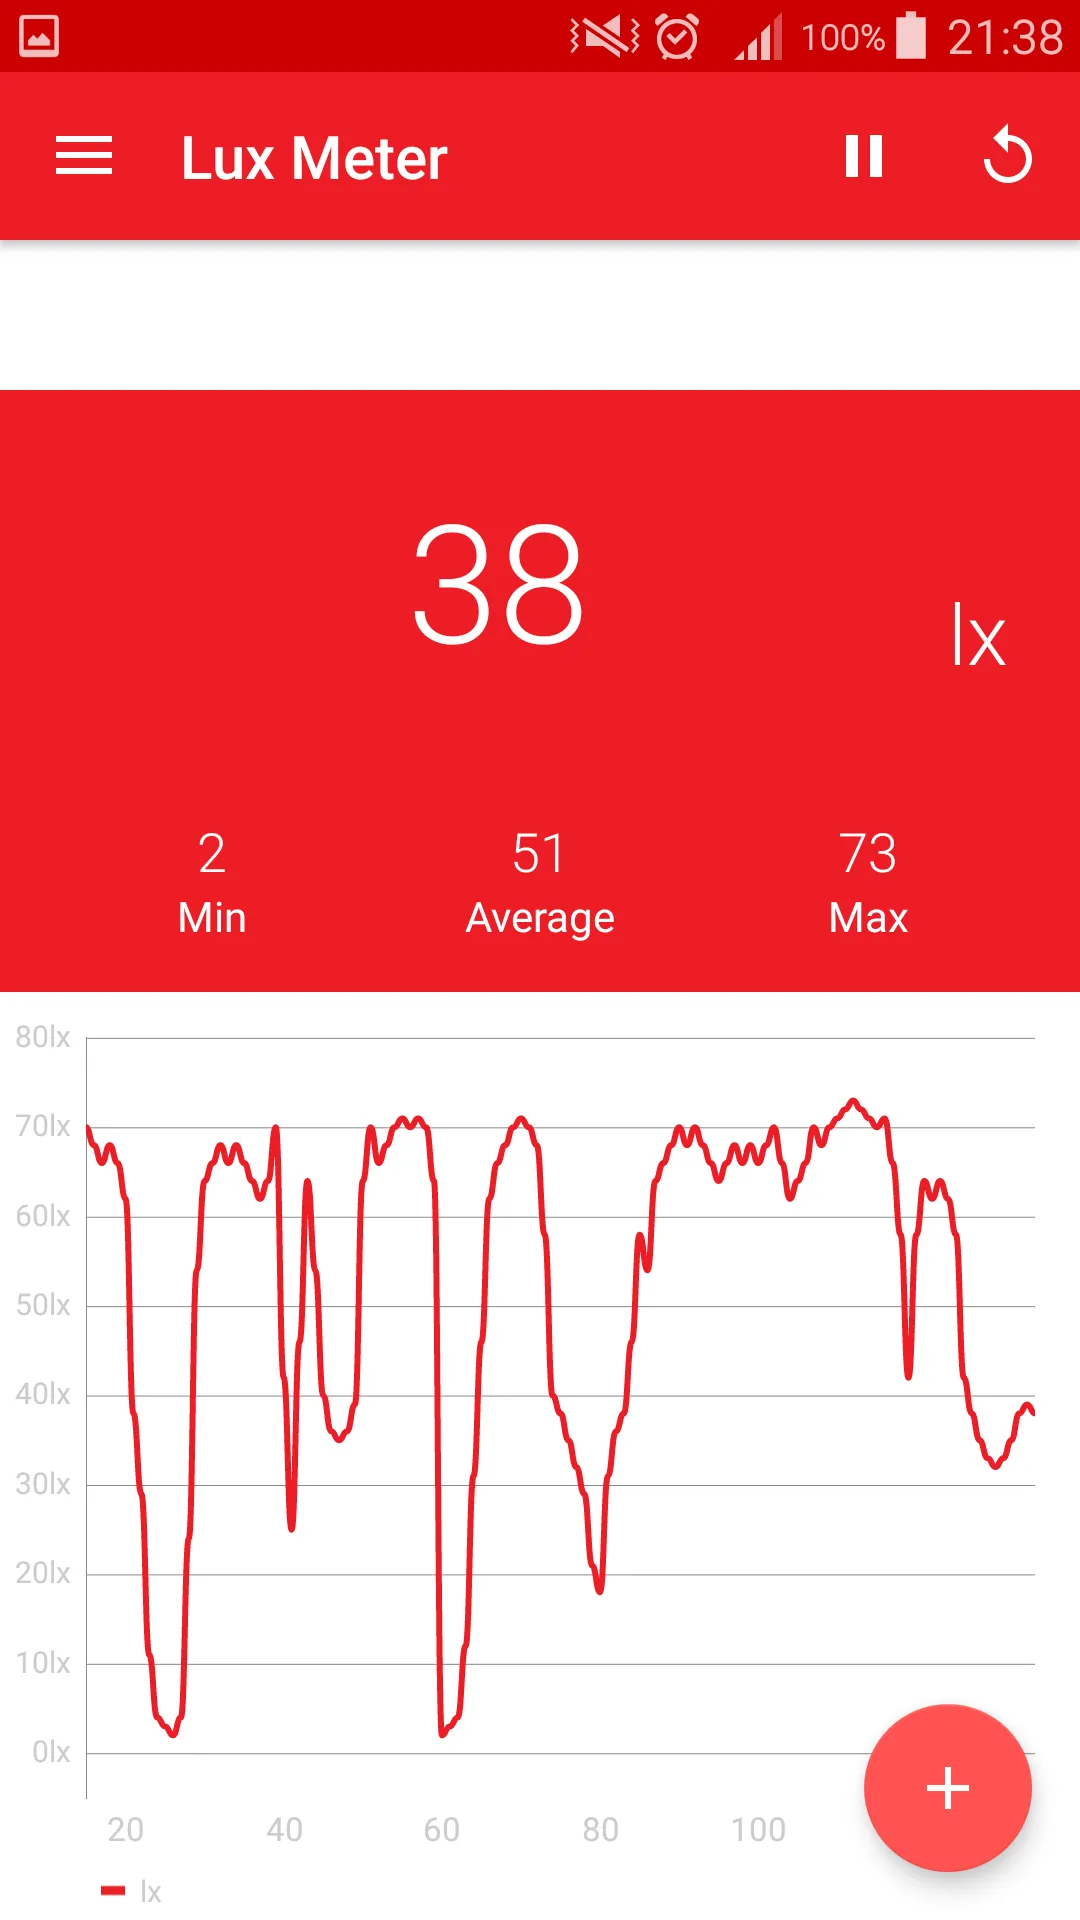
The answer to this question is, that for serious measurements you will need professional hardware, which will ensure, that the evaluation of the incident radiation is performed according to the brightness sensitivity curve of the human eye in daylight. Light measurement done by smartphones can be used as an orientation with light level changes throughout some period of time. Unfortunately, the replacement of a professional Lux meter is not the app manufacturer’s intention. Therefore apps are not really of any great assistance for measuring professional illuminance and are not even of any use to obtaining a general idea of the illuminance value. Anyway, if someone wants to practice some amateur light measurements in different environments I would like to show a few examples of the Android app and how they work (Pic. 9 – 13).
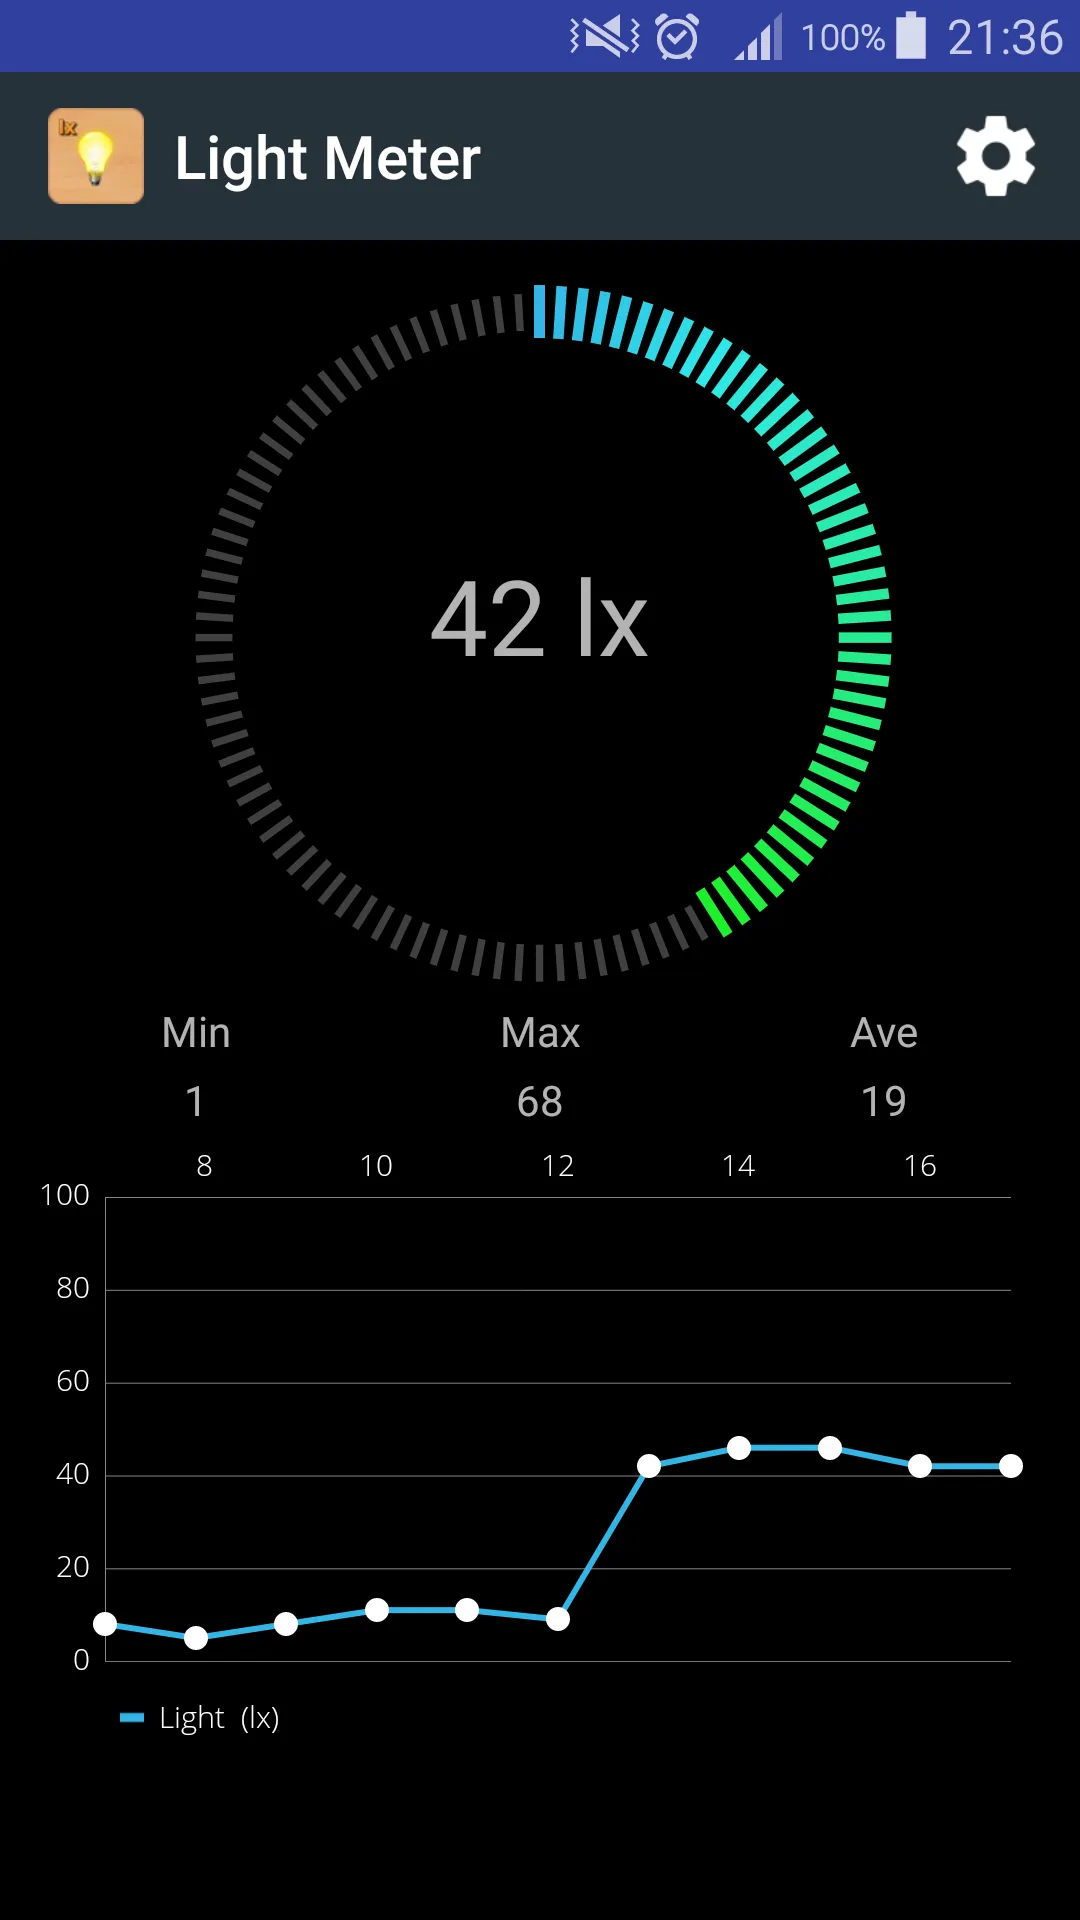
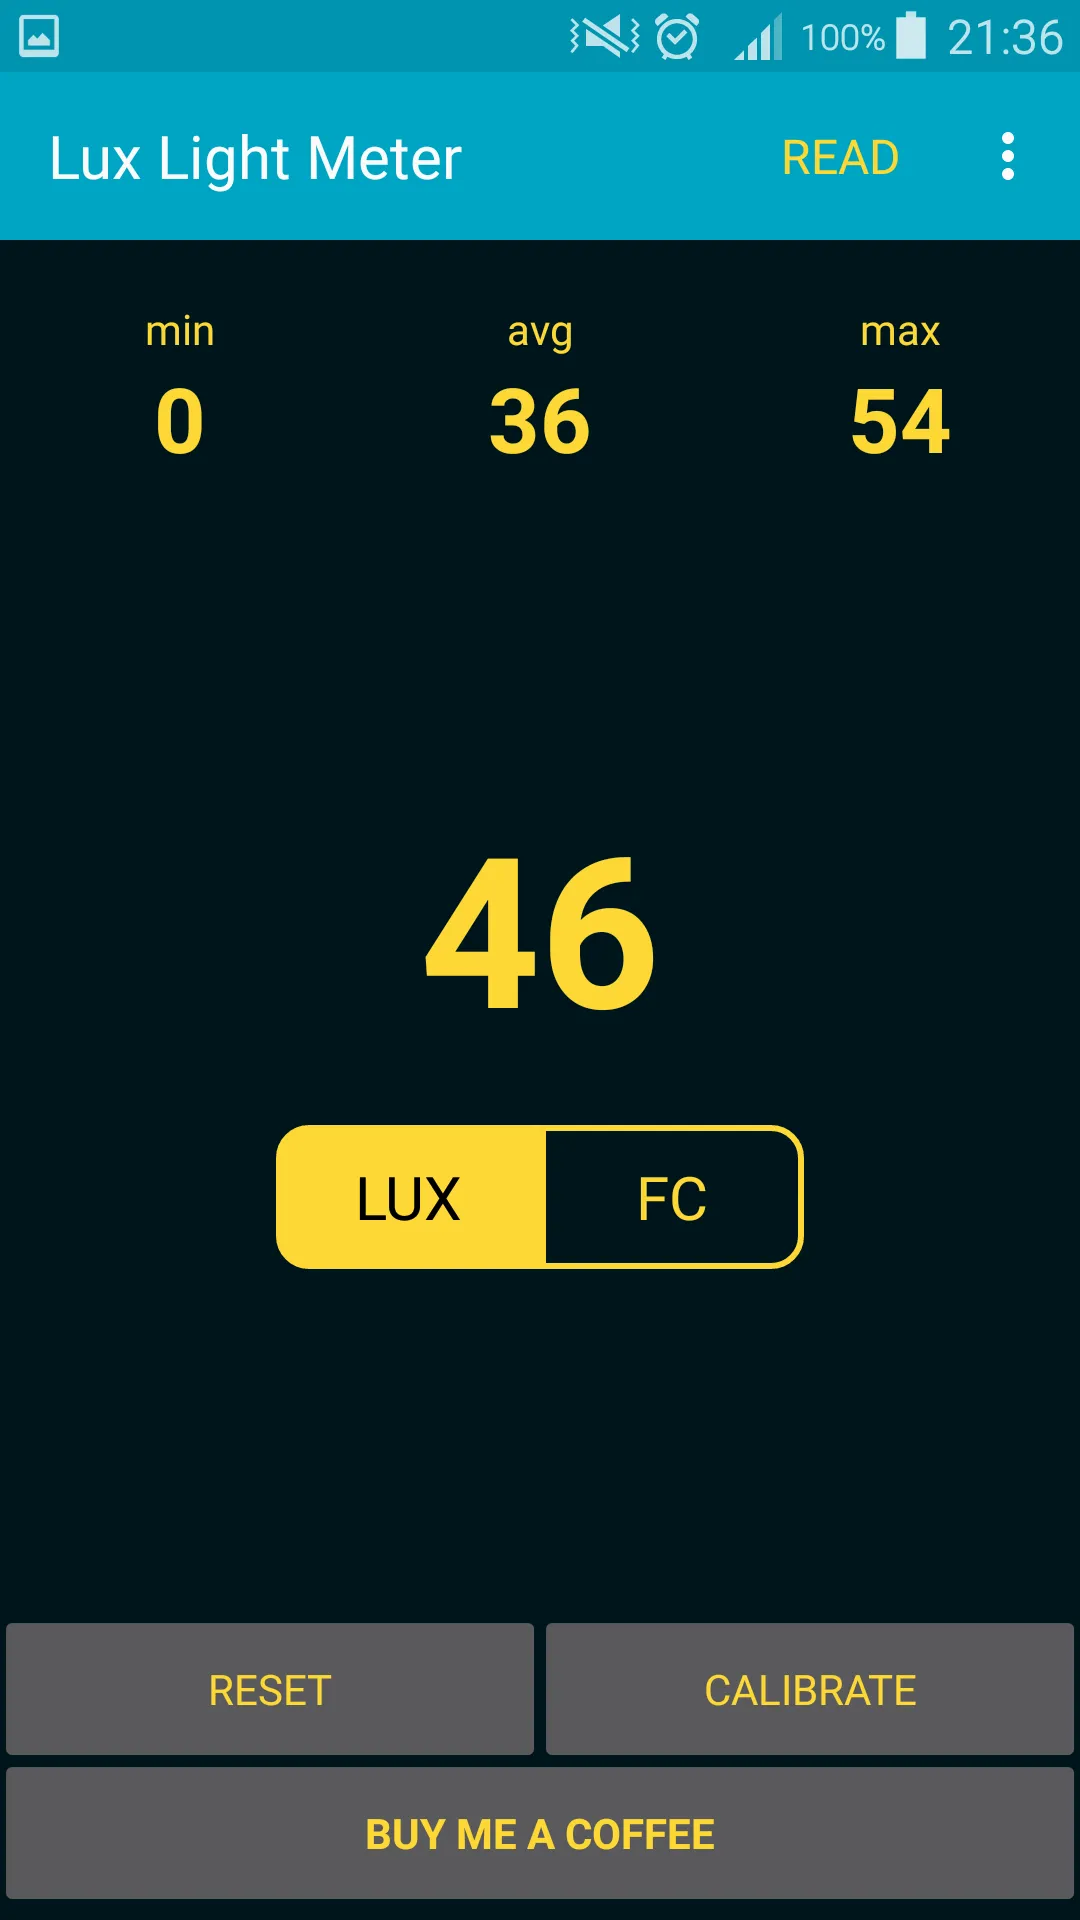
Next to the light meter itself is also a log option. In each Lux Meter app, which I have used so far there was not a decent log option. I had a result of changes in real-time. Only the top middle app “Lux Light Meter Free (The Lux Meter v. 18.08.29)” includes some logs in the free version, where the first 100 measurements are stored in temporary memory (Pic. 12, 13). Every single measurement occurs when the Lx value changes.
5. COMMON LIGHT LEVELS
Knowing the basics of light measurement we can wonder about common light levels as we see in our day-to-day life. I am going to bring only a few example values at least in this article because I would like to describe them widely in the future. Before I do this I would like to show a big plot of the main natural sources of light, as we can see in our day-to-day life (Pic. 14). This plot is based on the Footcandles – a non-SI unit of illuminance, where 1 footcandle is around 10,76 lx.
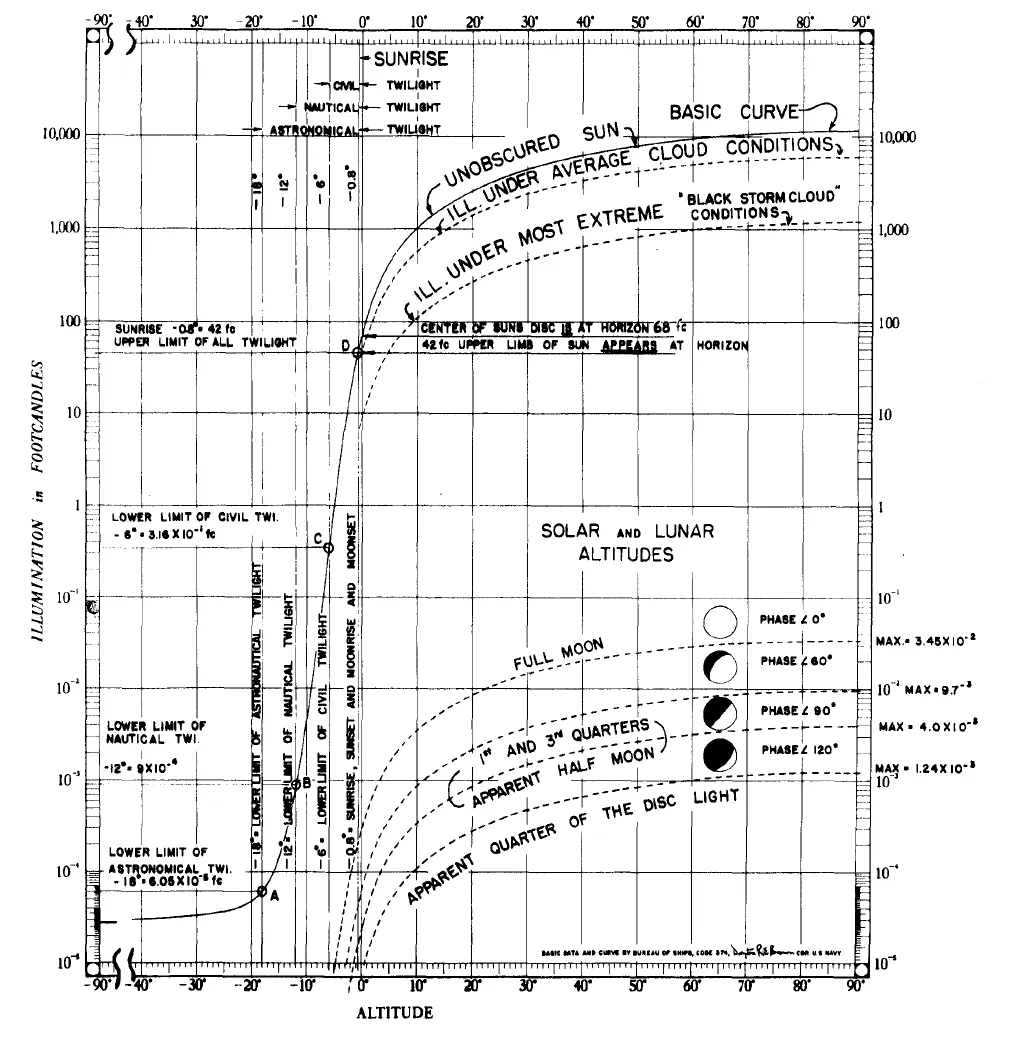
Another natural light that doesn’t cover this plot comes from the brightest planets (e.g. Venus, Jupiter), interstellar dust (zodiacal light), and stars (starlight).
To make things more practical I am bringing some examples of illuminance from day-to-day life:
- Direct sunlight – up to 120000 lx,
- Sunrise or sunset – around 400 lx
- Overcast day – around 1000-1500 lx
- Floodlit areas – around 50 lx
- Full Moon – up to 0.3 lx
The illuminance provided by the light source on a surface perpendicular to the direction of the source is a measure of the strength of that source as perceived from that location. For instance, a star of apparent magnitude 0 provides 2.08 microlux at the Earth’s surface. A barely perceptible magnitude 6 star provides 8 nanolux (Schyler, 2009). Comparing it to the Sun being on the very opposite end of this line the solar illuminance constant is equal to 129000 lx. The real value of solar illuminance varies due to atmospheric conditions, latitude, and period of the year.
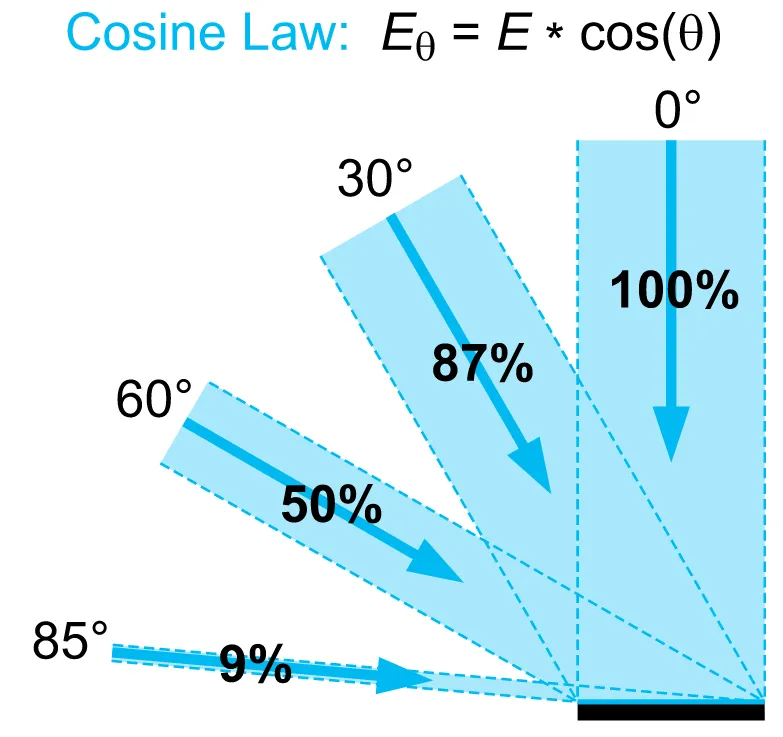
The luminance of the surface depends on how the surface is tilted with respect to the source. For example when you have a flashlight and you aim it perpendicularly at the wall then it will produce a full given level of illumination. When you put your flashlight at an angle to the surface, then Illuminated spots become larger, and therefore it receives less light. It is described by Lambert’s Cosine Law, where the illuminance and irradiance falling on any surface varies as the cosine of the incident angle (Pic. 15).
Anyway, the common light levels we can divide on natural and produced by manufactured sources. For day-to-day life, we have recommended light levels, that we can also divide outdoors (roadways, sidewalks ) and indoors (warehouses, homes, offices, etc.).
The outdoor light level is approximately 10000 lx on a clear day. In the building close to the window the light level may be reduced to approximately 1000 Lux. In the middle area, it may be as low as 25-50 lx. Additional lighting equipment is often necessary to compensate for the low levels. The common light level is in the range of 500-1000 lx depending on the activity. For precision and detailed works, the light level may even approach 1500-2000 lx.
The recommended light level in different workspaces varies according to the needs and it stated as per the examples below:
- Easy offices work – 250 lx
- Supermarkets – 750 lx
- Normal drawing works and detailed mechanical workshops – 1000 lx
- Performance of very prolonged and exacting visual tasks – 5000-10000 lx
There are also other recommended light level indoors examples, but I will describe them in the future.
Mariusz Krukar
References:
- Buser P., Imbert M., 1992, Vision, MIT Press, Massachusets
- Fenn et al., 1985, Optical and infrared properties of the atmosphere, (in:) Jursa A., Handbook of geophysics and the space environment, Air Force
- Frisby J.P., 1980, Seeing, Illusion, Brain and Mind, Oxford University Press, Oxford
- Kalloniatis M., Luu C., 1995, Light and dark adaptation (in:) The organization of the retina and visual system, University of Utah Health Sciences Center
- Murphy T., 2011, Maximum efficiency of white light, UCSan Diego
- Organisation Intergouvernementale de la Convention du Metre, 2006, The International System of Units (SI), Stedi Media, Paris
- Pirenne MH, 1962, Dark adaptation and night vision (in:) Dawson H., The Eye, vol. 2, Academic Press, London.
- Purkinje J.E., 1825, Neue Beiträge zur Kenntniss des Sehens in Subjectiver Hinsicht (in:) Reimer, p.109-110, Berlin
- Ryer A., 1998, Light measurement handbook, International Light Inc., Peabody
- Schyler P., 2009, Radiometry and photometry in astronomy, Interactive Computerized Ephemeris, Stockholm
- Stockman A., Sharpe L.T., 2006, Into the twilight zone: the complexities of mesopic vision and luminous efficiency (in:) Ophthalmic Physiol Optics, vol 26 (3), p.225-239.
- Stroebel L., Zakia R., 1993, The focal encyclopedia of photography, p. 467, Focal Press, Massachusets
Links:
- Candela_lumen.htm
- Lux to Watt calculator
- Light-measurement-glossary
- Luminance vs illuminance
- Photometry – handbook
- Radiometry & Photometry – PDF brochure
- Algebra.com: Introduction to Solid -angles
- What today’s consumers need to know about lumens
- Lumen & luminous flux vs Watt
- Lumen to Watt calculator
- lighting lux lumens watts – guide
- Understanding watts vs lumens for home lighting
- Anylamp.com: Convert lumens to watt, description, explanation
- LED vs incandescent lightning
- Luminous efficacy, color perception, spectral reflectance curve, and many others
- The basic form of colors
- Photopic & scotopic vision
- Brightness, Luminous efficacy, photopic and scotopic vision
- Radiometric and photometric units
- How to measure light levels
- Extech: LED light meter
- IIs measuring LED illuminance with a lux meter accurate?
- LED light meter
- Brightness and surface brightness
- Light Lux meters
- Light meter apps for Android to measure the light
- How smartphones are suitable for light level measurements
- Footcandle to Lux converter
- Interior illuminance levels
- Recommended light levels indoor and outdoor.PDF
Wiki:
- Adaptation_(eye)
- Candela
- Centimetre, gram – second_system_of_units
- Color_vision
- Cone_cell
- Daylighting
- Electrical_efficiency
- Erg
- Foot-candle
- Illuminance
- Intensity_(physics)
- Inverse-square_law
- Irradiance
- Light
- Light_meter
- Lighting
- List_of_light_sources
- Lumen_(unit)
- Luminance
- Luminous_efficacy
- Luminous_flux
- Luminous_intensity
- Lux
- Mesopic_vision
- Photometer
- Photometry_(optics)
- Photopic_vision
- Purkinje_effect
- Radiant_flux
- Radiant_intensity
- Rod_cell
- Standard_illuminant
- Solar_constant
- Scotopic_vision
- Steradian
- Visible_spectrum