
Legend and scale besides the pop-up window and labeling is another important map element, which everyone wants to have clean and tidy. In this shorter (I hope) article I want to explain to you how to customize the legend for your OpenLayers map generated by the QGIS2web plugin and add some relevant elements like a nice scale bar, etc.
Let’s make a start from QGIS like previously. Again, the QGIS is the “place” where we have to define as much as we can, otherworldly use the QGIS2web plugin 100%.
The first thing, we have to know is that the legend generated by the QGIS2web plugin corresponds roughly to the “Layers” panel on our left-hand side in QGIS. It means, that the order of our layers in this panel will be accurately replicated in our OpenLayers map legend (Pic. 1).
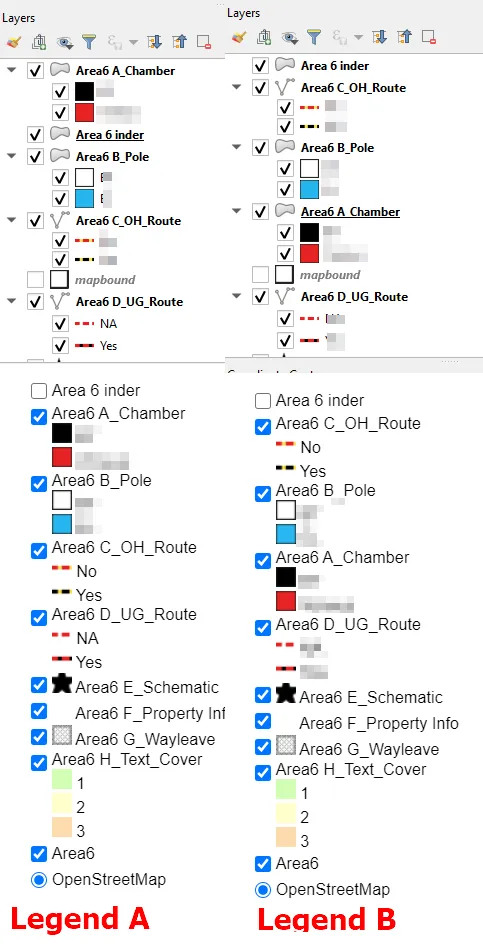
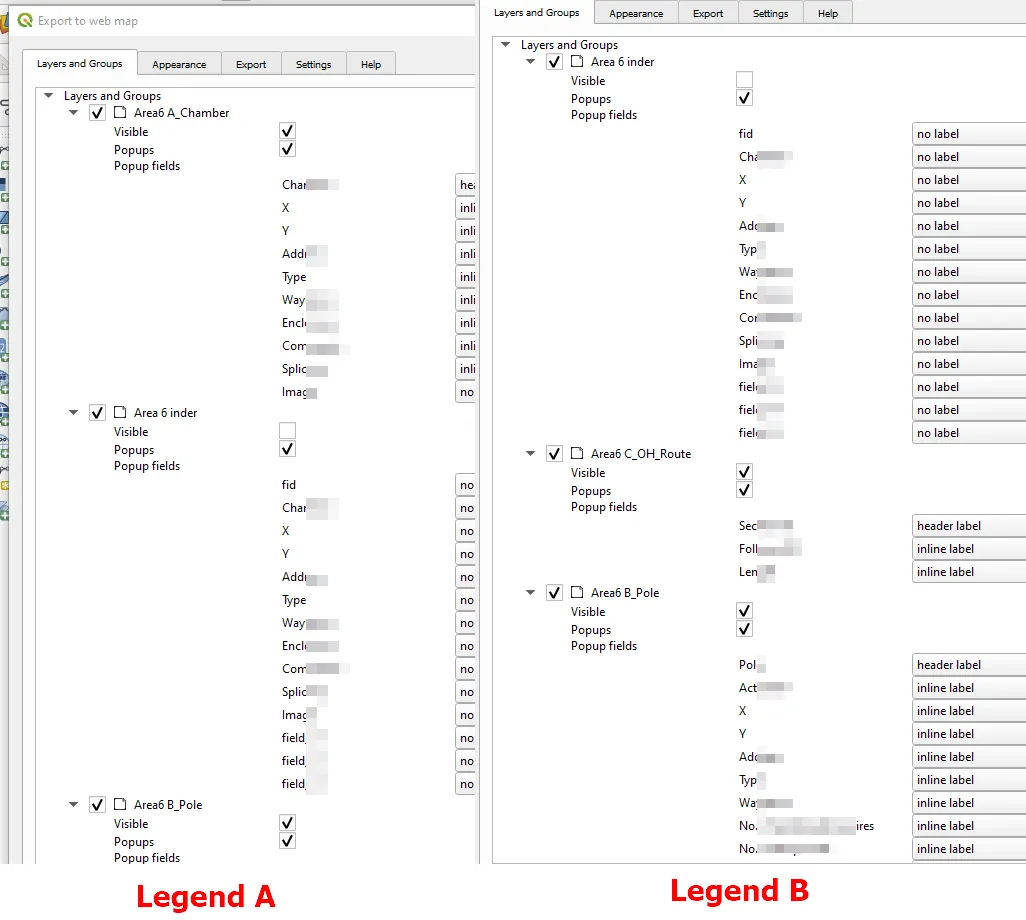
We can be convinced about the order of our legend when we open the QGIS2web plugin and see all our layers listed (Pic. 2).
If we finish our work in QGIS it’s the best moment to cater to the order of our layers, also their names, as well as their styling. The OpenLayers map library allows rendering layer stylization much better than Leaflet does.
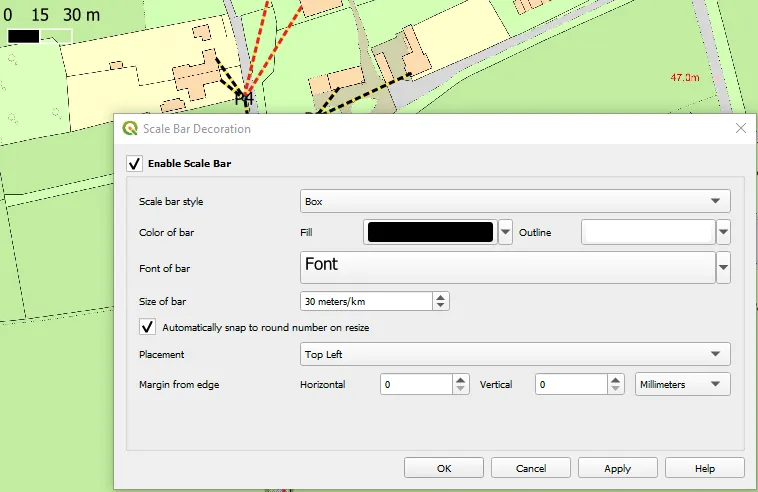
Another thing, which we should solve in QGIS is the map scale matter. To make our map scale visible we should go to the “View” in the top bar and select “Decorations” from where we can pick up the “Scale bar” (Pic. 3).
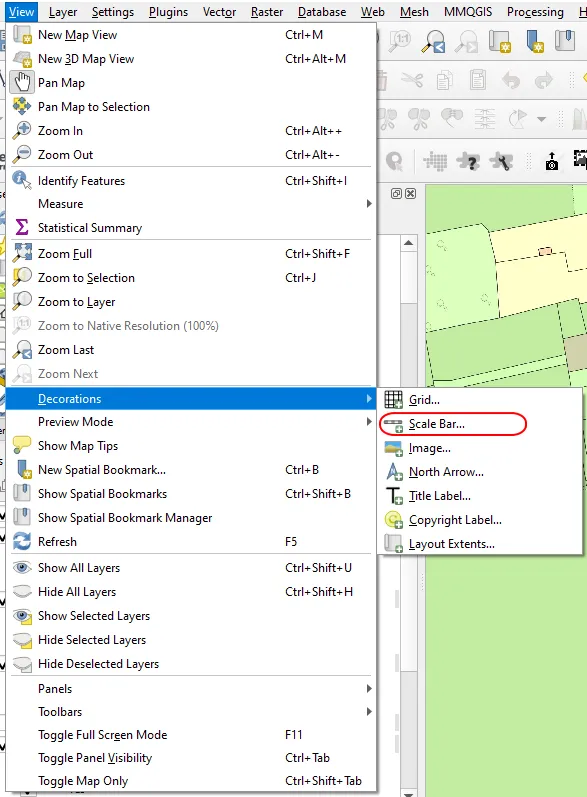
Next, we have a few options to select our scale type. I have picked up the box (Pic. 4). Once applied, the scale becomes visible on our map.
Unlike the order of layers, the scale bar is an easy thing to add further programmatically, when forgotten. This is pretty much all we can do in QGIS regarding our OpenLayers map legend, namely: styling layers, defining their orders (and names), and customizing the scale. Unfortunately, it looks like the north arrow is not supported by OpenLayers and we need to find a different way to get it.
Changing the order of the layers in the layers.js file might be a time-consuming and challenging issue, especially since each layer comes with a number marking its order in the code and on the map. Unlike their order, if you forget to change their names the issue is not much complicated.
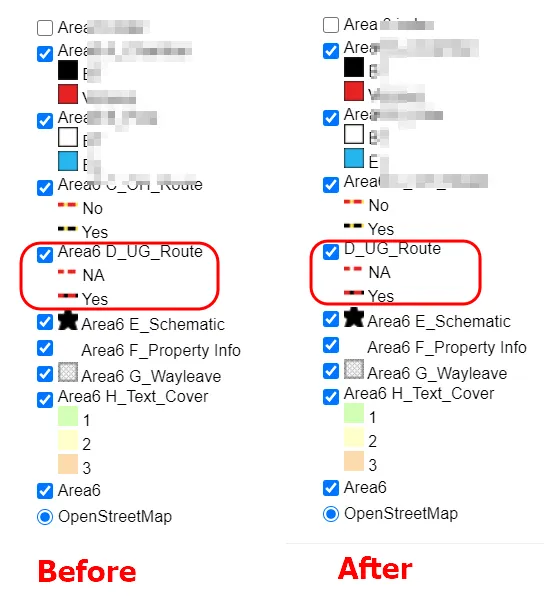
First of all, we should open the layers.js file. If you don’t know where the file is, see my last article about the pop-up customization in the OpenLayers map. Next, we should find the layer, which now we are working on. For instance, let’s edit the following layer (Pic. 5). On the left, you can see how it was before, and on your right the effect of our amendments. The code is below:
var format_Area6D_UG_Route_6 = new ol.format.GeoJSON();
var features_Area6D_UG_Route_6 = format_Area6D_UG_Route_6.readFeatures(json_Area6D_UG_Route_6,
{dataProjection: 'EPSG:4326', featureProjection: 'EPSG:3857'});
var jsonSource_Area6D_UG_Route_6 = new ol.source.Vector({
attributions: ' ',
});
jsonSource_Area6D_UG_Route_6.addFeatures(features_Area6D_UG_Route_6);
var lyr_Area6D_UG_Route_6 = new ol.layer.Vector({
declutter: true,
source:jsonSource_Area6D_UG_Route_6,
style: style_Area6D_UG_Route_6,
interactive: true,
title: 'Area6 D_UG_Route<br />\
<img src="styles/legend/Area6D_UG_Route_6_0.webp" /> NA<br />\
<img src="styles/legend/Area6D_UG_Route_6_1.webp" /> Yes<br />'
});
var format_Area6D_UG_Route_6 = new ol.format.GeoJSON();
var features_Area6D_UG_Route_6 = format_Area6D_UG_Route_6.readFeatures(json_Area6D_UG_Route_6,
{dataProjection: 'EPSG:4326', featureProjection: 'EPSG:3857'});
var jsonSource_Area6D_UG_Route_6 = new ol.source.Vector({
attributions: ' ',
});
jsonSource_Area6D_UG_Route_6.addFeatures(features_Area6D_UG_Route_6);
var lyr_Area6D_UG_Route_6 = new ol.layer.Vector({
declutter: true,
source:jsonSource_Area6D_UG_Route_6,
style: style_Area6D_UG_Route_6,
interactive: true,
title: 'D_UG_Route <br />\
<img src="styles/legend/Area6D_UG_Route_6_0.webp" /> NA<br />\
<img src="styles/legend/Area6D_UG_Route_6_1.webp" /> Yes<br />'
});
Changing the name of our layer in the legend is not a big deal. The key section here is the title:. This option defines both the name of our layer and its true key. The code is comprised of two basic elements: the text string and images attached, which are divided by the break <br> element. Everything is enclosed with the apostrophe. If you wish to remove one of the keys or all of them or change the image path, you can do so here.
title: 'D_UG_Route <br />\
<img src="styles/legend/Area6D_UG_Route_6_0.webp" /> NA<br />\
<img src="styles/legend/Area6D_UG_Route_6_1.webp" /> Yes<br />'
});
The current version of QGIS2web manages well with rendering the styles of our layers both on the map and in legend. However, there might be still objects, which we are not happy with. We can manually supersede the image linked to our code in the director, where it’s stored providing our own shape or line (Pic. 7).

Finally, the last thing applies to the situation when we have the layers on our map, but we don’t need them to be visible in our key. It refers to some obvious layers like roads, hydrology, etc. If there are quite a few of them, our legend might be messy. In this event, we can simply “switch off” the layer from our legend key in the code. We need to edit the title: section again, in other words remove everything from there, leaving the quotes only. (Pic. 8)
var format_Area6D_UG_Route_6 = new ol.format.GeoJSON();
var features_Area6D_UG_Route_6 = format_Area6D_UG_Route_6.readFeatures(json_Area6D_UG_Route_6,
{dataProjection: 'EPSG:4326', featureProjection: 'EPSG:3857'});
var jsonSource_Area6D_UG_Route_6 = new ol.source.Vector({
attributions: ' ',
});
jsonSource_Area6D_UG_Route_6.addFeatures(features_Area6D_UG_Route_6);
var lyr_Area6D_UG_Route_6 = new ol.layer.Vector({
declutter: true,
source:jsonSource_Area6D_UG_Route_6,
style: style_Area6D_UG_Route_6,
interactive: true,
title: 'Area6 D_UG_Route<br />\
<img src="styles/legend/Area6D_UG_Route_6_0.webp" /> NA<br />\
<img src="styles/legend/Area6D_UG_Route_6_1.webp" /> Yes<br />'
});
var format_Area6D_UG_Route_6 = new ol.format.GeoJSON();
var features_Area6D_UG_Route_6 = format_Area6D_UG_Route_6.readFeatures(json_Area6D_UG_Route_6,
{dataProjection: 'EPSG:4326', featureProjection: 'EPSG:3857'});
var jsonSource_Area6D_UG_Route_6 = new ol.source.Vector({
attributions: ' ',
});
jsonSource_Area6D_UG_Route_6.addFeatures(features_Area6D_UG_Route_6);
var lyr_Area6D_UG_Route_6 = new ol.layer.Vector({
declutter: true,
source:jsonSource_Area6D_UG_Route_6,
style: style_Area6D_UG_Route_6,
interactive: true,
title: ''
});
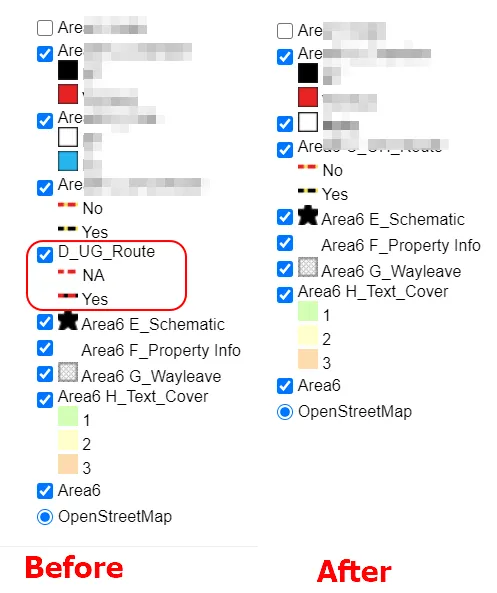
Obviously, the layer is still present on the map, just disappeared with the legend key. I think, that it’s the best way to keep our legend tidy.
Another thing is the scale bar. Unfortunately, the default scale, which comes from the QGIS2web plugin (at least in Openlayers) doesn’t look great. On top of that, from the 4 options available in QGIS (Pic. 4), the Bar option does not work at all. It means, that even in my case when I remembered about the map decoration, I had to do it manually.
In this case, we need to open the qgis2web.js file and find the map variable, which is located in the 94th line of our code.
var map = new ol.Map({
controls: ol.control.defaults({attribution:false}).extend([
expandedAttribution,new measureControl(),new geolocateControl()
]),
target: document.getElementById('map'),
renderer: 'canvas',
overlays: [overlayPopup],
layers: layersList,
view: new ol.View({
maxZoom: 21, minZoom: 14
})
});
The emboldened section includes our tools provided to the map: measureControl and geolocateControl. This is the place, where we should add another one, the ScaleLine. Our code should look as per below then.
var map = new ol.Map({
controls: ol.control.defaults({attribution:false}).extend([
expandedAttribution,new ol.control.ScaleLine({}),new measureControl(),new geolocateControl()
]),
target: document.getElementById('map'),
renderer: 'canvas',
overlays: [overlayPopup],
layers: layersList,
view: new ol.View({
maxZoom: 21, minZoom: 14
})
});
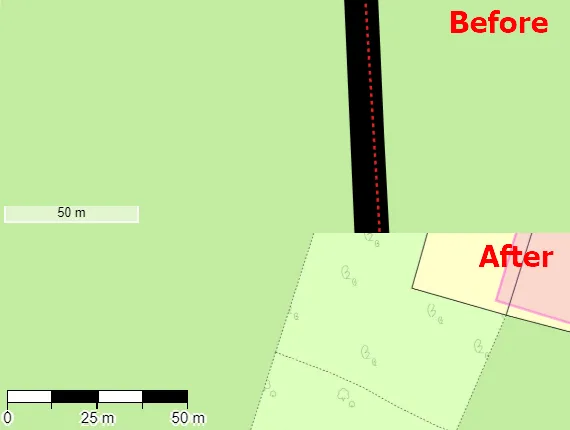
Adding the Scaleline control, we should see the very basic scale bar on the bottom left corner of our map (Pic. 9). To make it a bit customized, we should see what is the OpenLayers library for the ScaleLine control. There are some options to make our scale better visible and neat. I’ve picked up the bar property because I like this type of scale. My code looks like this then:
var map = new ol.Map({
controls: ol.control.defaults({attribution:false}).extend([
expandedAttribution,new ol.control.ScaleLine({bar:true}),new measureControl(),new geolocateControl()
]),
target: document.getElementById('map'),
renderer: 'canvas',
crossOrigin: 'anonymous',
overlays: [overlayPopup],
layers: layersList,
format: 'image/png',
view: new ol.View({
maxZoom: 23, minZoom: 17
})
});
however, you must check what is the type of the given property. In my case, the bar is boolean, so if I want to make a scalebar I must select true. The final effect is below (Pic. 9). Making the scale for our OpenLayers map generated by the QGIS2web plugin is quite straightforward then.
Another element good to include in our map is the crosshair. It defines the rough place of the current center of our map. I assume, that you need only the simple one for your purpose. If so, only the most simple coding is required. We can manage it outside of the JavaScript code. We must be aware, that in this situation, we are considering a whole website area, instead of the map canvas embedded within the <div> section. In practice, if our crosshair is placed in the very middle of the map, it will be in the very middle of our website too. It’s important to define the proportions in the CSS section, which I will tell you about below.
Firstly we should assign the class for our <div>, where our map is embedded.
<div id="map" class="crosshairs">
<div id="popup" class="ol-popup">
<a href="#" id="popup-closer" class="ol-popup-closer"></a>
<div id="popup-content"></div>
</div>
Since the index.html knows about our new class, we can expand our qgis2web.css file, by adding the following example code as per below:
.crosshairs:before, .crosshairs:after {
content: '';
position: absolute;
top: 47.9%;
bottom: 47.9%;
left: 48.5%;
right: 48.5%;
z-index: 999;
pointer-events: none;
}
.crosshairs:before {
bottom: 49.9%;
border-bottom: 2px #000 solid;
}
.crosshairs:after {
right: 49.95%;
border-right: 2px #000 solid;
}
Important is content: which defines our crosshair appearance. It must be empty. Other important elements are i.e. borders, and defining our crosshair visibility. Their location (bottom, right) has to correspond with an overall crosshair position.
In a similar way, we can attach a north arrow or compass rose to our map. Since the OpenLayers library still doesn’t support this option directly, we can again use the HTML/CSS approach by adding an external .webp or .svg image and placing it inside our <div id=”map”> block. There are at least a few free stacks of the cliparts and other graphs possible to use for our current purpose. Moreover, most of them have a transparent background, which is essential for our purpose. When we have got our north arrow or compass rose ready, we can attach it within our <div id=”map”> section.
<div id="map" class="crosshairs">
<img src="resources/north.webp" width="5%" height="10%"></img>
<div id="popup" class="ol-popup">
<a href="#" id="popup-closer" class="ol-popup-closer"></a>
<div id="popup-content"></div>
</div>
Don’t forget about the dimensions. The downloadable .webp image is usually far too big, so we have to define its new dimensions for our map.
Since now, the <img> section can be treated as the inner div.
Next, go to the qgis2web.css file and add the following section, optionally below the #map
#map {
width: 100%;
height: 100%;
}

#map img{
top: 83%;
left: 1%;
position: absolute;
z-index: 1;
}
The key thing to understand here lies in the CSS selectors defining our new image.
The top & left selectors determine the rough location of our image against the whole HTML website likewise, the crosshair explained above.
The position is highly important here because we definitely need the item overlaid instead of located above or below our embedded map.
The z-index property defines the stack order of our element. In practice, it determines whether our object is hidden by another one or placed at the very top. If not included in our CSS code, the order of our elements will be set as the default. In order to make sure, that our object is placed correctly against another one, we should define the value of the z-index selector. In our case, it definitely will be a positive value, since we want to have our north arrow always visible despite the number of layers comprising our map underneath. In this event, the minimum number used for this selector should be 1. If everything is alright, we should have a good-looking north arrow provided.
Our arrow looks fine. This is obviously a very simple method, which won’t work in advanced projects I am afraid. However, as long as it’s not a straight solution offered by the OpenLayers library, we can go with it.
The very last thing, which I would like to explain here is the map title. This is another thing, which remains not feasible with our JavaScript OpenLayers library by far. On the other hand, we are not lost, as at least two other ways lead us to provide the title that we want. Personally, I would make use of the attributionList reference, visible in the bottom right corner of our map.
It’s enough when we replace the reference text inside and provide our description like:
var attributionComplete = false;
map.on("rendercomplete", function(evt) {
if (!attributionComplete) {
var attribution = document.getElementsByClassName('ol-attribution')[0];
var attributionList = attribution.getElementsByTagName('ul')[0];
var firstLayerAttribution = attributionList.getElementsByTagName('li')[0];
var qgis2webAttribution = document.createElement('li');
qgis2webAttribution.innerHTML = '<a href="https://github.com/tomchadwin/qgis2web">qgis2web</a> · ';
var olAttribution = document.createElement('li');
olAttribution.innerHTML = '<a href="https://openlayers.org/">OpenLayers</a> · ';
var qgisAttribution = document.createElement('li');
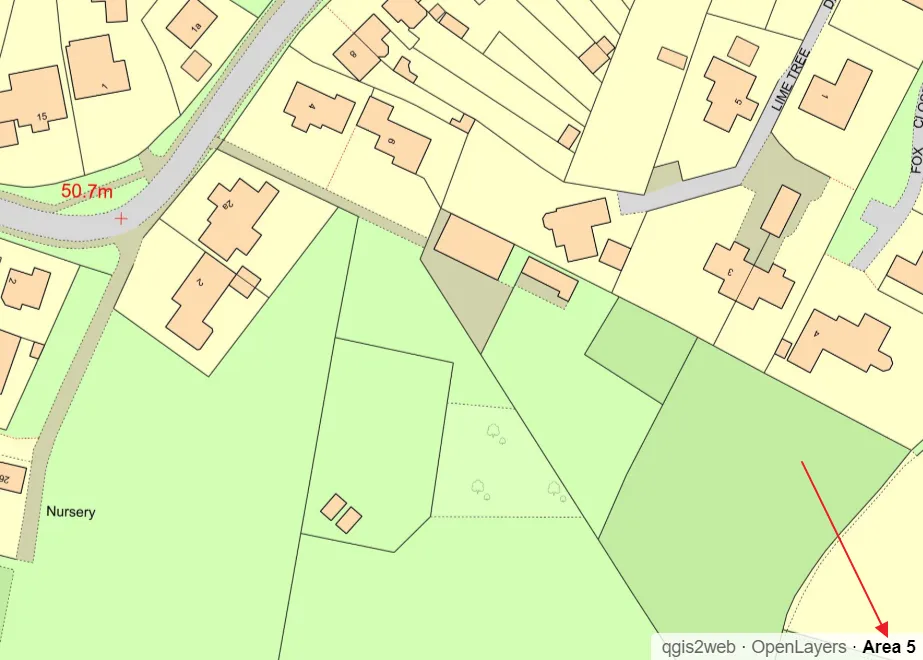
qgisAttribution.innerHTML = '<b>Area 5</b>';
attributionList.insertBefore(qgis2webAttribution, firstLayerAttribution);
attributionList.insertBefore(olAttribution, firstLayerAttribution);
attributionList.insertBefore(qgisAttribution, firstLayerAttribution);
attributionComplete = true;
}
})
Looking at the attributeComplete section above, you can spot what has been done. I used the existing qgisAttribution for the name of my map, making it also emboldened.

I still have credits for the QGIS2web plugin and OpenLayers library. In my opinion, QGIS is not needed here, since the Qgis2web plugin is an inherent part of this open-source GIS software. On the other hand, we can leave the QGIS attribute here and add up the next one, by copying all of the relevant elements from our attributeComplete section.
Obviously, it’s only one way to provide the title of our map. The other approach refers to the HTML/CSS solution and can be done analogically to the example with the north arrow or as per the explanation here.
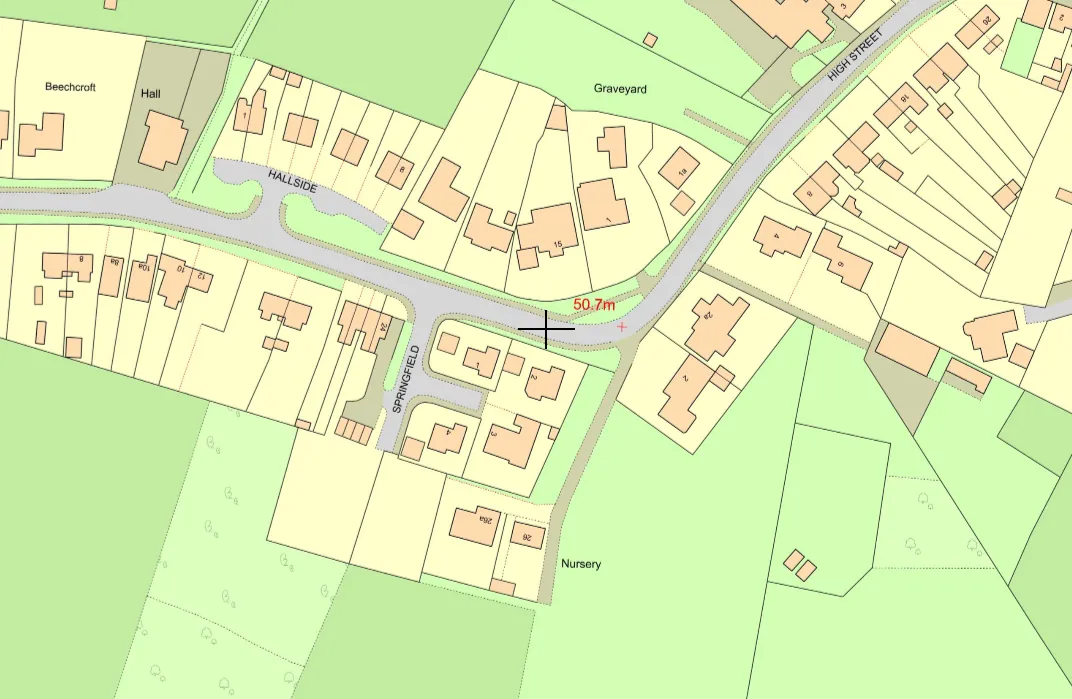
At the beginning of my summary I would like to show you, what can you do with your OpenLayers map produced by the QGIS2web plugin. Apart from the legend, which has been tidied up, you have got the other useful map elements like scale, north arrow, crosshair, and title.
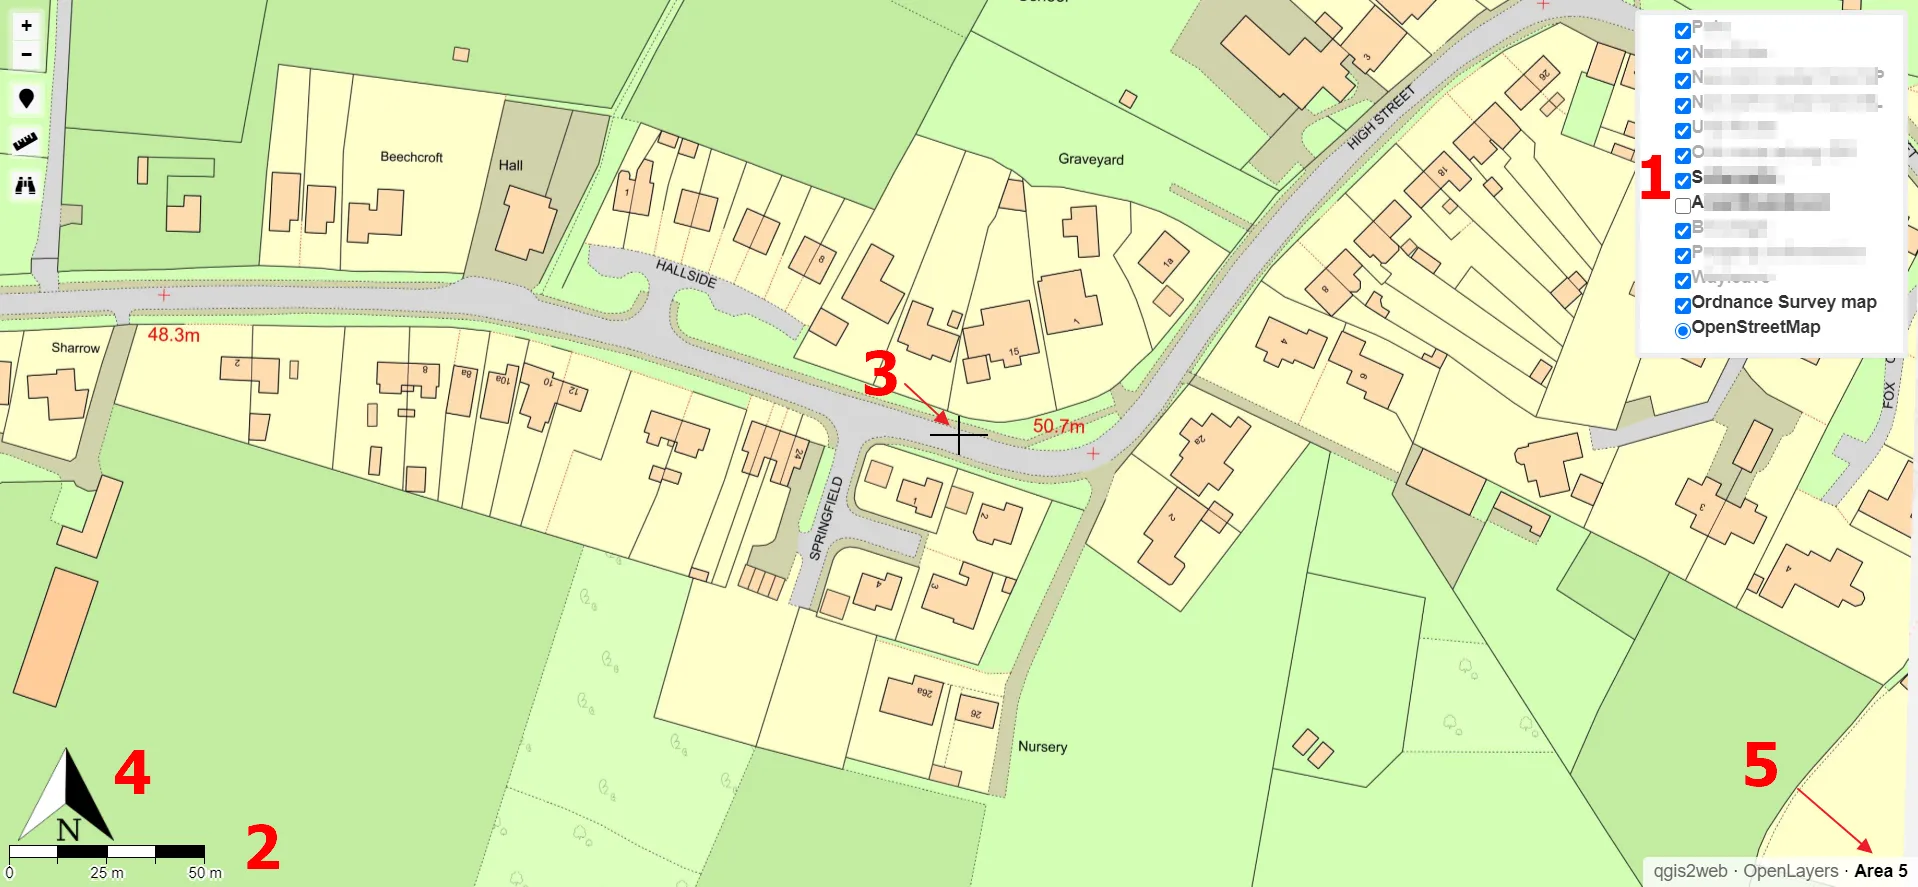
The styling of the legend and scale in the OpenLayers map created by the QGIS2web plugin is not a difficult thing. The options shown above are a good way to expand the plugin capabilities. These options also don’t enclose this thread, because they are basic. I believe the situation will change slightly as the new version of the plugin is released. I am also convinced, that you can come out with your own, optionally more effective solution for adding these elements. This work just shows, that the OpenLayers map generated by the QGIS2Web plugin comes with no ultimate version and can be modeled in different ways.
Mariusz Krukar
Links:
- https://libraries.io/github/tomchadwin/qgis2web
- https://qgis2web-docstests.readthedocs.io/en/testing/Appearance-settings/
- https://www.igismap.com/qgis2web-create-web-maps/
- https://openlayers.org/en/latest/apidoc/module-ol_control_ScaleLine.html
- https://openlayers.org/workshop/en/mobile/compass.html
- https://www.hiclipart.com/
- https://www.pinclipart.com/
- Z-index in CSS language
- CSS Z-index property
Forums:
- https://gis.stackexchange.com/questions/179403/how-to-add-legend-in-qgis2web-plugin-while-exporting-maps
- Interactive legend and Map Title OL
- http://mdhntd.blogspot.com/2019/06/how-to-re-order-layers-before-exporting.html
- [OpenLayers-Users] Can I retrieve a legend image from a vector layer
- https://stackoverflow.com/questions/5267554/create-map-legend-to-match-openlayers-style
- https://gis.stackexchange.com/questions/264326/setting-legend-area-proportion-on-webmap-produced-by-qgis2web-for-a-mobile-phone
- OpenLayers and the legend
- https://stackoverflow.com/questions/56005653/how-to-create-openlayer-feature-previews-in-a-dropdown-menu
- https://gis.stackexchange.com/questions/296906/how-to-make-line-size-scale-dependent-in-openlayers-webmap-made-using-qgis2web
- North arrow/compass rose
- https://gis.stackexchange.com/questions/333098/qgis2web-show-specific-layers-in-layer-list/379642#379642
- There is no compass control for OpenLayers 3
- Map control compass OpenLayers
- https://stackoverflow.com/questions/4605715/position-absolute-and-overflow-hidden
- https://stackoverflow.com/questions/26597372/use-css-for-vector-layer-styling-in-openlayers
- https://gis.stackexchange.com/questions/253136/qgis2web-ol3-does-not-show-map-title