

QGIS2web plugin is very handy because it is somewhat of a gateway between your QGIS project and its presence outside in the interactive version. The plugin is able to render as much as it can from our project in three types of interactive maps: Leaflet, OpenLayers, and Mapbox GL JS. The most important thing is, that no server-side software is required, which means that our interactive map can be used offline.
There is a lot of information available on the web, including hints and guidelines on how to use this plugin. Apart from it I also asked a few questions regarding the usage of this assemblage when I was learning. However there are some things, which I solved, or discovered and I would like to explain to you, making your way of use easier in the future.
In this article, I am focused on the Pop-up window customization for the Openlayers interactive map.
We all know, that the fundamental source defining the stuff in our pop-up window is the data attribute table (Pic. 1). This is the place, where all our columns and rows with data are included. Every single row is allocated to the individual object being later displayed on our map. Below is the data attribute table I am working on. All the steps will apply to this table.

The pop-up information box is very important because we can have basically everything: text, images, video, etc. It’s good to know how to manage it from the very beginning to the final stage and to be satisfied with our result.
Our very first step is to think and decide, which columns we need to be visible in our pop-up window. Do we need all of them, or maybe there are some, that we don’t want to display?
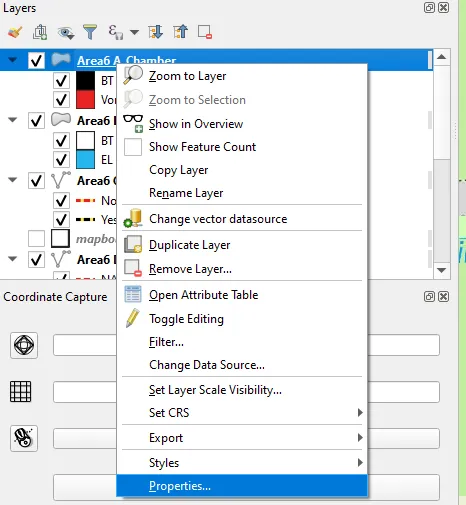
In our QGIS project, we must right-click on our layer and select “Properties” (Pic.2).
Next, we should enter the “Attributes Form”, where are all our available widgets. These widgets include both data attribute table columns (titles) and other widgets like HTML widgets, which we also can implement into our interactive map pop-up (Pic. 3). If we don’t want some of the columns from our data attribute table to be displayed in our information window on the map we should change its widget type to “Hidden”. The default one is always the “Text Edit”.

We have to do it separately for all layers, assuming that data attribute table columns are pretty much the same. If you have an image link in your data attribute table, remember that your widget type should be an attachment. The best option is to keep it relative to our QGIS project path (Pic. 4). It should prevent us from losing the layers when moving our project to a different directory. Again, repeat the process for all other layers you have on your map unless you did it previously when filling up the data attribute table.
When all our layers have all the widget types set properly, we can run the QGIS2web plugin, where we should define the label features. A very important notice at this stage is, that all the layers mustn’t be grouped. Otherwise, we won’t see all the options. We won’t be able to edit the labeling (Pic. 4), which is like our own goal for us regarding the pop-up information.

Assuming, that you have all layers out of a group, you are in the position to set the label options for each of your data attribute columns displayed on your left. However, before you do that make sure, that you want to have the pop-up for the given layer at all. If not, just untick the mark next to the “Popups” (Pic. 5 marked red). You have 3 options: “no label”, “header label” and “inline label” (Pic. 5). Your “header label” will be on the top, and its appearance will vary from others.

After export, we see, that our pop-up, in general, doesn’t look great. It’s too far extended (when you have an image) and not tidy enough. Fortunately, we have the columns distinguished from their content (Pic. 7), although it’s still far away from our desired layout.

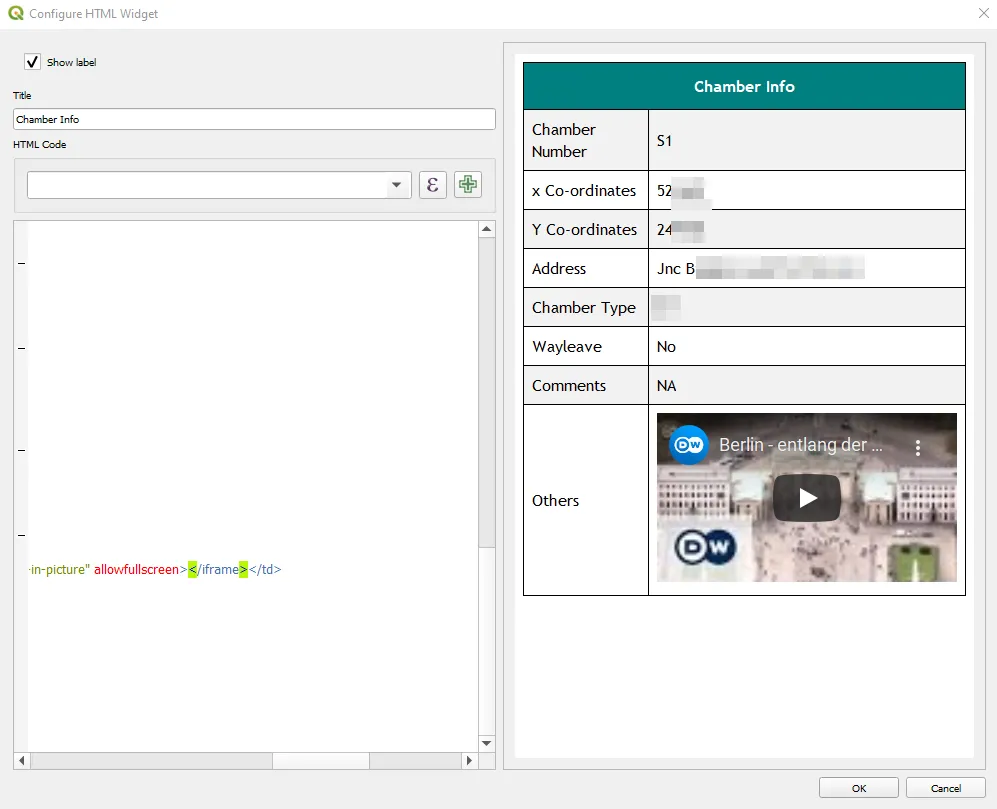
Our desired layout can be found in the “Attributes Form” in the “Form Layout” section, where come all widgets are created by us. Considering the situation, when we created our own HTML widget, which works as an internal pop-up for us in QGIS (Pic. 8). We might desire a similar one in our interactive map generated by the QGIS2web plugin.
The difference between Pic. 7 and Pic. 8 are big. It shows the limitations of the QGIS2web plugin against the powerful OpenLayers map library. However, the good news is, that we are not lost. We can do a lot of things if we know some basics of front-end coding. If we have created the aforementioned HTML widget in QGIS, then for sure we are.
To make the relevant changes in our pop-up window we effectively need to make some changes in three files, which are based on the resources and layers folders (Pic. 9).

We have got one .css file and two .js files, where a piece of code must be changed. Let’s make start with the .css one. When opening your qgis2web.css file you should find the .ol-popup section (Pic. 10).

As you can see, there are quite a few properties, of which the most important are width and height. In my example, I changed the min-width only, but you can customize it for your needs.
height: auto;
width: auto;
min-width: 350px;
max-height:400px;

Now, the problem with the small size of our pop-up window is sorted.
The next step is getting around with enormous images, wherever they appear (Pic. 12). The .css file defines the min and max-width & height. We need to set an upper limit for our images.

In our qgis2web.js file we should find (at the 326th line of code):
var popupText = '<ul>';
map.forEachFeatureAtPixel(pixel, function(feature, layer) {
which correspond to two major situations, when our label widget is hidden and is not. We obviously must scroll down to the }else { case as follows (Pic. 13).

In the image display properties code snippet, we should include the dimensions of our image, in which we want to see them. Optionally you can also make this image clickable in order to open the full size. So instead of:
popupField += (currentFeature.get(currentFeatureKeys[i]) != null ? '<img src="images/' + currentFeature.get(currentFeatureKeys[i]).replace(/[\\\/:]/g, '_').trim() + '" /></td>' : '');
we should include something like this:
popupField += (currentFeature.get(currentFeatureKeys[i]) != null ? '<a href="images/' + currentFeature.get(currentFeatureKeys[i]).replace(/[\\\/:]/g, '_').trim() + '" /" target="blank"><img src="images/' + currentFeature.get(currentFeatureKeys[i]).replace(/[\\\/:]/g, '_').trim() + '" / width="300" height="250"></a></td>' : '');
where, as you may have noticed, the link section has been added as well as the option to open the full-size image in a blank tab. the width and height properties are exemplary. Instead of a certain size, you can use the percentage values, which will keep the aspect ratio of your image.

Now the pop-up layout itself. I’ve mentioned above, that it would be fantastic to have it pretty much the same as our HTML layout in QGIS (Pic. 8).
Firstly, we must enter our HTML widget in QGIS and check the HTML & CSS code we provided. Scripts present there are to be generated by QGIS, once selected one of the data attribute columns (Pic. 15). Basically, our HTML widget remains the typical website, as all the major elements are included (Pic. 15).

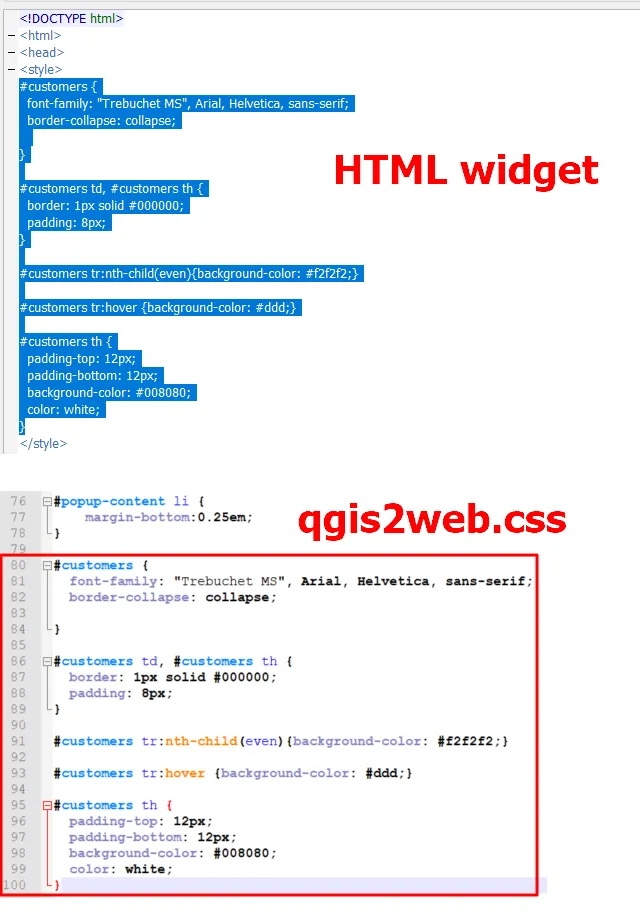
All the scripts have been placed in the table, inside the <td><td> tags. It applies also to all the images and videos. However, it’s not very important at this moment, because the HTML widget is outside the data attribute table fields, so the QGIS2web plugin won’t render it in the interactive map. The HTML widget is a layout guideline for us, especially the styling. The most important section here is enclosed with the <style></style> tag. We need to copy this whole section to our qgis2web.css file and place it underneath the initial code (Pic. 16).
Now, another part of our operation applies to the qgis2web.js file, where we should grip the #customers selector.
In CSS we’ve got # and . selectors. The # applies to the “id“ and the “.” to the “class” in HTML language. These HTML attributes can be found in the javascript code (Pic. 13). Currently, we are interested in the <table> tag, which must include our CSS identification. So we have to assign the “id” to our <table> tag, which should look as below, where instead of:
popupText += '<li><table>';
it should be
popupText += '<li><table id="customers">';
at the 369th line of code in qgis2web.js file.
If we do so, the effect will be immediate (Pic. 17).

Another thing to do here is to change the row height because our pop-up window is bigger than the default one. It was the same in our HTML widget, however against the interactive map it doesn’t look fine. In our whole style incorporated from the HTML widget, we can change the padding values.
#customers {
font-family: "Trebuchet MS", Arial, Helvetica, sans-serif;
border-collapse: collapse;

}

#customers td, #customers th {
border: 1px solid #000000;
padding: 8px;
}

#customers tr:nth-child(even){background-color: #f2f2f2;}

#customers tr:hover {background-color: #ddd;}

#customers th {
padding-top: 12px;
padding-bottom: 12px;
background-color: #008080;
color: white;
}
If we lower these values, our pop-up window should be much smaller and smarter (Pic. 18).

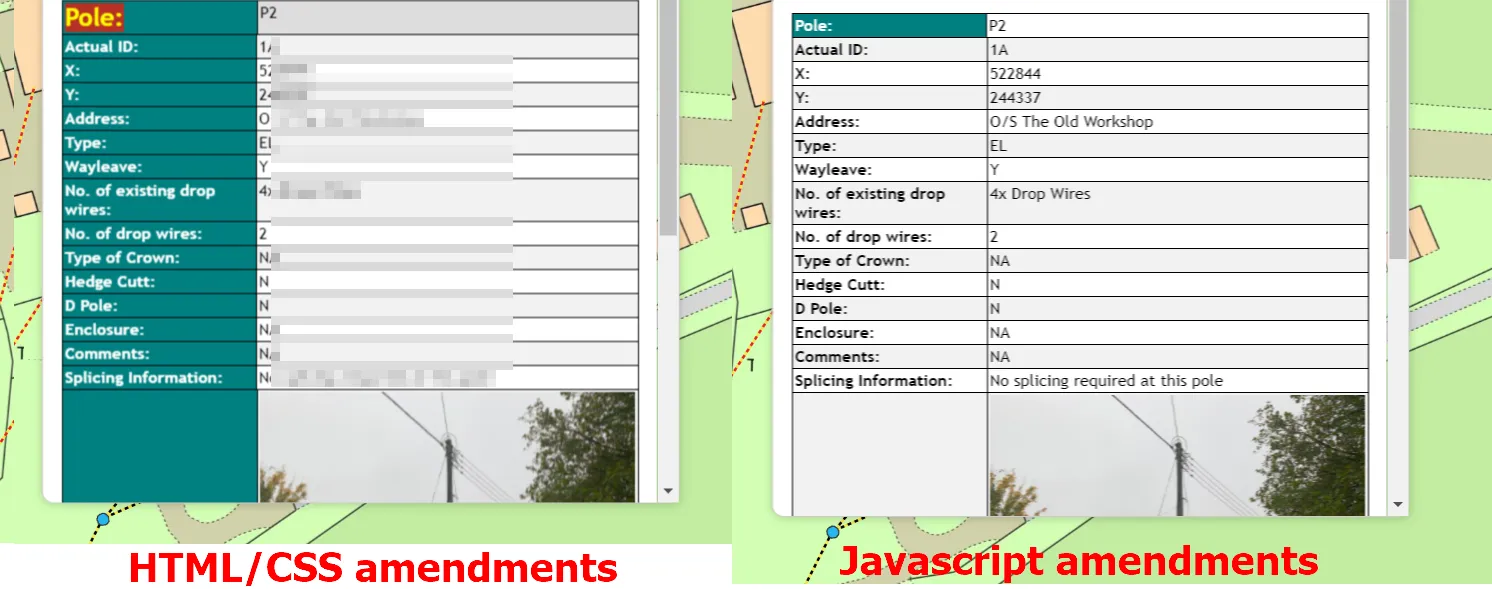
The last thing to work on here is our header label, which as you can see isn’t colored, unlike the inline labels. Moreover, the name of our “Pole” appears underneath instead of in the same row. We don’t want that. If we want to have our header label exactly the same as others underneath we should make the changes in our code. Below you can see the section of code (starting from line 376th) that must be changed and after changes.
if (layer.get('fieldLabels')[currentFeatureKeys[i]] == "inline label") {
popupField += '<th>' + layer.get('fieldAliases')[currentFeatureKeys[i]] + ':</th><td>';
} else {
popupField += '<td colspan="2">';
}
if (layer.get('fieldLabels')[currentFeatureKeys[i]] == "header label") {
popupField += '<strong>' + layer.get('fieldAliases')[currentFeatureKeys[i]] + ':</strong><br />';
}
We have effectively 2 major labels used in our pop-up window: the header label and the inline label. If we want to mend the situation above (Pic. 18), we should expand our code a bit and to the proper alterations.
if (layer.get('fieldLabels')[currentFeatureKeys[i]] == "inline label") {
popupField += '<th>' + layer.get('fieldAliases')[currentFeatureKeys[i]] + ':</th>';
} else {
popupField += '<th colspan="2">';
}
if (layer.get('fieldLabels')[currentFeatureKeys[i]] == "header label") {
popupField += '<strong>' + layer.get('fieldAliases')[currentFeatureKeys[i]] + ':</strong></th><td>';
} else {
popupField += '<td colspan="2">';
}
The result is fine now. We have all our rows the same, which looks much tidier (Pic. 19).

If our column with titles looks quite narrow, we can make it wider by adding the min-width property as follows:
#customers th {
padding-top: 2px;
padding-bottom: 2px;
background-color: #008080;
color: white;
min-width: 150px;
}
Now it’s time to emphasize our header label. I am giving you two examples below. One of them applies to expanding our CSS code by including the HTML <strong> tag.
#customers strong
{
background-color: #b73125;
font-size: 20px;
color: yellow;
}
Another one requires small changes in the qgis2web.js file, where we can simply swap the labels and change the “colspan” attribute. Our current code looks as per below:
if (layer.get('fieldLabels')[currentFeatureKeys[i]] == "inline label") {
popupField += '<th>' + layer.get('fieldAliases')[currentFeatureKeys[i]] + ':</th>';
} else {
popupField += '<th colspan="2">';
}
if (layer.get('fieldLabels')[currentFeatureKeys[i]] == "header label") {
popupField += '<strong>' + layer.get('fieldAliases')[currentFeatureKeys[i]] + ':</strong></th><td>';
} else {
popupField += '<td colspan="2">';
}
and the changes should look like this:
if (layer.get('fieldLabels')[currentFeatureKeys[i]] == "header label") {
popupField += '<th>' + layer.get('fieldAliases')[currentFeatureKeys[i]] + ':</th>';
} else {
popupField += '<td colspan="2">';
}
if (layer.get('fieldLabels')[currentFeatureKeys[i]] == "inline label") {
popupField += '<strong>' + layer.get('fieldAliases')[currentFeatureKeys[i]] + ':</strong></th><td>';
} else {
popupField += '<td colspan="2">';
}
These 2 results can be seen below (Pic. 20).
You can mix these solutions too, it’s not a problem.
The last thing to work with our pop-up content covers distinguishing the text within inline labels. Seeing all the examples above, you can spot that there is no other group of layers than the header and inline ones. It means, that we operate between only 2 separate stylings. How about if you want to have something another to be emphasized? The QGIS2web plugin doesn’t support this option directly, but if you are savvy enough with code fiddling, it’s quite easy to do it yourself.
First of all, we must create a completely new label in our qgis2web.js file. Let’s assume, that we want to have some text red in our rows. For this reason, we need to create a “red label” in our code. If our code looks like this:
if (layer.get('fieldLabels')[currentFeatureKeys[i]] == "header label") {
popupField += '<th>' + layer.get('fieldAliases')[currentFeatureKeys[i]] + ':</th>';
} else {
popupField += '<td colspan="2">';
}
if (layer.get('fieldLabels')[currentFeatureKeys[i]] == "inline label") {
popupField += '<strong>' + layer.get('fieldAliases')[currentFeatureKeys[i]] + ':</strong></th><td>';
} else {
popupField += '<td colspan="2">';
}
we should add the “red label” section making our code like this:
if (layer.get('fieldLabels')[currentFeatureKeys[i]] == "header label") {
popupField += '<th>' + layer.get('fieldAliases')[currentFeatureKeys[i]] + ':</th>';
} else {
popupField += '<td colspan="2">';
}
if (layer.get('fieldLabels')[currentFeatureKeys[i]] == "red label") {
popupField += '<font color="red"><strong>' + layer.get('fieldAliases')[currentFeatureKeys[i]] + ':</strong></font></th>';
}
if (layer.get('fieldLabels')[currentFeatureKeys[i]] == "inline label") {
popupField += '<strong>' + layer.get('fieldAliases')[currentFeatureKeys[i]] + ':</strong></th><td>';
} else {
popupField += '<td colspan="2">';
}
Obviously, instead of <font> color attribute, we can use the CSS definition. Because previously we could use the <strong> tag for our header label styling. Now, we can change the <strong> to <b> in our “red label” section.
Remember, that the qgis2web.js is not only one file here. Creating a new label in this file doesn’t mean, that we will see it in our pop-up window. We have to define which row in our window (column from the data attribute table) must change its color. In order to do it, we should open the layers.js file from the \layers\ directory.
This file contains all the layers included in our map. For the purpose of labeling the most important are the last lines of code, which define the labels.
lyr_Area6H_Text_Cover_2.set('fieldLabels', {'id': 'inline label', });
lyr_Area6G_Wayleave_3.set('fieldLabels', {'Type': 'header label', 'Land': 'inline label', });
lyr_Area6F_PropertyInfo_4.set('fieldLabels', {'S. No.': 'header label', 'UPRN': 'inline label', 'X': 'inline label', 'Y': 'inline label', 'Building No.': 'inline label', 'Street/Road Name': 'inline label', 'Town': 'inline label', 'Postcode': 'inline label', 'Building Type': 'inline label', 'Cabinet Name': 'inline label', 'Splitter Name': 'inline label', 'DP Number': 'inline label', 'DP Info': 'inline label', });
lyr_Area6E_Schematic_5.set('fieldLabels', {'Name': 'header label', 'Path': 'inline label', });
lyr_Area6D_UG_Route_6.set('fieldLabels', {'Section ID': 'header label', 'Rode Rope': 'inline label', 'Comments': 'inline label', 'Length': 'inline label', });
lyr_Area6C_OH_Route_7.set('fieldLabels', {'Section ID': 'header label', 'Follows OR': 'inline label', 'Length': 'inline label', });
lyr_Area6B_Pole_8.set('fieldLabels', {'Pole': 'header label', 'Actual ID': 'inline label', 'X': 'inline label', 'Y': 'inline label', 'Address': 'inline label', 'Type': 'inline label', 'Wayleave': 'red label', 'No. of existing drop wires': 'inline label', 'No. of drop wires': 'inline label', 'Type of Crown': 'inline label', 'Hedge Cutt': 'inline label', 'D Pole': 'inline label', 'Enclosure': 'inline label', 'Comments': 'inline label', 'Splicing Information': 'inline label', 'Path': 'no label', 'Properties': 'inline label', });
lyr_Area6A_Chamber_9.set('fieldLabels', {'Chamber': 'header label', 'X': 'inline label', 'Y': 'inline label', 'Address': 'inline label', 'Type': 'inline label', 'Wayleave': 'red label', 'Enclosure': 'inline label', 'Comments': 'inline label', 'Splicing': 'inline label', 'Image': 'no label', });
lyr_Area6inder_10.set('fieldLabels', {'fid': 'no label', 'Chamber': 'no label', 'X': 'no label', 'Y': 'no label', 'Address': 'no label', 'Type': 'no label', 'Wayleave': 'no label', 'Enclosure': 'no label', 'Comments': 'no label', 'Splicing': 'no label', 'Image': 'no label', 'field_13': 'no label', 'field_14': 'no label', 'field_15': 'no label', });
lyr_Area6inder_10.on('precompose', function(evt) {
evt.context.globalCompositeOperation = 'normal';
});
There are all our data attribute columns assigned to the label type. These types are exactly the same, as we defined at the very beginning when exporting our map from QGIS (Pic. 6). Because we’ve created a new “red label” already, we can find the column (text), which we want to be changed and simply change the “inline label” to the “red label“. Remember, that if that label doesn’t exist in our qgis2web.js file yet, the text will disappear from our pop-up window (Pic. 22). Make sure also, that the name of your new label provided here matches exactly with the new label defined in the qgis2web.js file. If everything is alright you should have a nice result as per below (Pic. 21).

The CSS solution gives us more flexibility.

We can create as many new labels as we want by adding a new class or ID to the <b> or <strong> tag or even with the <font> tag only unless we are limited by the data attribute fields. Remember also about the CSS code. If for example, you define the <b> tag like this:
#customers b
then any class or ID allocated to this tag won’t work. The text will be always as defined in the CSS code.
My final example looks like below (Pic. 23).

and the code accordingly below:
CSS (qgis2web.css)
#customers {
font-family: "Trebuchet MS", Arial, Helvetica, sans-serif;
border-collapse: collapse;

}

#customers td, #customers th {
border: 1px solid #000000;
padding: 2px;
}

#customers tr:nth-child(even){background-color: #f2f2f2;}

#customers tr:hover {background-color: #ddd;}

#customers th {
padding-top: 2px;
padding-bottom: 2px;
background-color: #008080;
color: white;
min-width: 150px;
}
#customers b
{
font-size: 18px;
color: red;
text-decoration: underline;
}

#green
{
font-size: 16px;
color: green;
text-decoration: underline;
text-decoration-style: double;
}

.header
{
background-color: #77f7f7;
}
Javascript (qgis2web.js)
if (doPopup) {
popupText += '<li><table id="customers">';
for (var i=0; i<currentFeatureKeys.length; i++) {
if (currentFeatureKeys[i] != 'geometry') {
popupField = '';
if (layer.get('fieldLabels')[currentFeatureKeys[i]] == "header label") {
popupField += '<th>' + layer.get('fieldAliases')[currentFeatureKeys[i]] + ':</th>';
} else {
popupField += '<td colspan="2" class="header">';
}
if (layer.get('fieldLabels')[currentFeatureKeys[i]] == "red label") {
popupField += '<b>' + layer.get('fieldAliases')[currentFeatureKeys[i]] + ':</b></th>';
}
if (layer.get('fieldLabels')[currentFeatureKeys[i]] == "green label") {
popupField += '<strong id="green">' + layer.get('fieldAliases')[currentFeatureKeys[i]] + ':</strong></th>';
}
if (layer.get('fieldLabels')[currentFeatureKeys[i]] == "blue label") {
popupField += '<font color="blue"><strong>' + layer.get('fieldAliases')[currentFeatureKeys[i]] + ':</strong></font></th>';
}
if (layer.get('fieldLabels')[currentFeatureKeys[i]] == "inline label") {
popupField += '<strong>' + layer.get('fieldAliases')[currentFeatureKeys[i]] + ':</strong></th><td>';
} else {
popupField += '<td colspan="2" >';
}
if (layer.get('fieldImages')[currentFeatureKeys[i]] != "ExternalResource") {
popupField += (currentFeature.get(currentFeatureKeys[i]) != null ? autolinker.link(currentFeature.get(currentFeatureKeys[i]).toLocaleString()) + '</td>' : '');
} else {
popupField += (currentFeature.get(currentFeatureKeys[i]) != null ? '<a href="images/' + currentFeature.get(currentFeatureKeys[i]).replace(/[\\\/:]/g, '_').trim() + '" /" target="blank"><img src="images/' + currentFeature.get(currentFeatureKeys[i]).replace(/[\\\/:]/g, '_').trim() + '" / width="300" height="250"></a></td>' : '');
}
popupText += '<tr>' + popupField + '</tr>';
}
}
popupText += '</table>';
}
This is the very last thing to mention, which is minor but maybe someone will want to change it. Namely, we have the blue “X” text at the top right corner. If someone wishes to change it we need to open our CSS code (qgis2web.css) and find line 38. We are able to change the color of this text, turn it into a button, etc
.ol-popup-closer {
text-decoration: none;
position: absolute;
top: 2px;
right: 8px;
}

.ol-popup-closer:hover {}  /*to be added optionally*/

.ol-popup-closer:after {
content: "X";
}

Our job is complete, although it’s always something to do. If, for example, you want to keep the video populated as well in your pop-up window, then you have to enter your layer javascript file and make the relevant alterations. An example of the code is found below:
var json_Area6A_Chamber_9 = {
"type": "FeatureCollection",
"name": "Area6A_Chamber_9",
"crs": { "type": "name", "properties": { "name": "urn:ogc:def:crs:OGC:1.3:CRS84" } },
"features": [
{ "type": "Feature", "properties": { "Chamber": "S1", "X": "577777", "Y": "277777", "Address": "Jnc Big Rd\/Newton", "Type": "NA", "Wayleave": "No", "Enclosure": "No", "Comments": "NA", "Splicing": "No Splicing required at this chamber", "Image": "Supporting_Docs\\Images\\S1.jpg" }, "geometry": { "type": "MultiPolygon", "coordinates": [ [ [ [ -0.908677912209735, 52.981652099957822 ], [ -0.908676975567367, 52.981675504851354 ], [ -0.90863898671442, 52.981674927418952 ], [ -0.908639923376716, 52.98165152252591 ], [ -0.908677912209735, 52.981652099957822 ] ] ] ] } },
The javascript notation includes the JSON code coming with all the features defined during our work in QGIS. Now we are able to edit them. If you forgot to do something in QGIS, you can try to alter it here, although the process might be time-consuming.
If we want to add the video from our HTML widget in QGIS (Pic. 8), then we have to parse properly the link as well as the frame, where it’s going to be opened. Imagine, that instead of Comments: N/A you want to have your video. Your JSON code changes will look as follows:
"type": "Feature", "properties": { "Chamber": "Dun Ch 019", "X": "5777771", "Y": "2777773", "Address": "Jnc Big Rd\/Newton", "Type": "NA", "Wayleave": "No", "Enclosure": "No","Comments": "NA", "Splicing": "No Splicing required at this chamber", "Image": "Supporting_Docs\\Images\\Dun_Ch_019.jpg" }, "geometry": { "type": "MultiPolygon", "coordinates": [ [ [ [ -0.908600835540191, 52.981667098728417 ], [ -0.908599898856842, 52.981690503620891 ], [ -0.908561909992715, 52.981689926163548 ], [ -0.908562846695992, 52.981666521271551 ], [ -0.908600835540191, 52.981667098728417 ] ] ] ] } },
"type": "Feature", "properties": { "Chamber": "Dun Ch 019", "X": "5777777", "Y": "2777777", "Address": "Jnc Big Rd\/Newton", "Type": "NA", "Wayleave": "No", "Enclosure": "No","Videos": "<iframe width='300' height='169' src='https://www.youtube-nocookie.com/embed/_riGdN3bHhk' frameborder='0' allow='accelerometer; autoplay; encrypted-media; gyroscope; picture-in-picture' allowfullscreen></iframe>", "Splicing": "No Splicing required at this chamber", "Image": "Supporting_Docs\\Images\\Dun_Ch_019.jpg" }, "geometry": { "type": "MultiPolygon", "coordinates": [ [ [ [ -0.908600835540191, 52.981667098728417 ], [ -0.908599898856842, 52.981690503620891 ], [ -0.908561909992715, 52.981689926163548 ], [ -0.908562846695992, 52.981666521271551 ], [ -0.908600835540191, 52.981667098728417 ] ] ] ] } },
next, you should enter the layers.js file, and under the current layer, you working on changing all “Comments” to “Videos” as per below.
If your layer is
var json_Area6A_Chamber_9 = {
then in the layers.js file, you should find the three lines of code allocated to your layer at the end of the whole code, i.e.:
lyr_Area6A_Chamber_9.set('fieldAliases', {'fid': 'fid', 'Chamber': 'Chamber', 'X': 'X', 'Y': 'Y', 'Address': 'Address', 'Type': 'Type', 'Wayleave': 'Wayleave', 'Enclosure': 'Enclosure', 'Comments': 'Comments', 'Splicing': 'Splicing', 'Image': 'Image', });
lyr_Area6A_Chamber_9.set('fieldAliases', {'fid': 'fid', 'Chamber': 'Chamber', 'X': 'X', 'Y': 'Y', 'Address': 'Address', 'Type': 'Type', 'Wayleave': 'Wayleave', 'Enclosure': 'Enclosure', 'Videos': 'Videos', 'Splicing': 'Splicing', 'Image': 'Image', });
and so on. Along with it, you can also manually change the widget and label too.

One of the last things might be more important in a situation when your elements vary from each other in terms of image presence. It can be more important, as one pop-up will have the image, whereas others won’t look good having the empty frame only (Pic. 26).

The reason behind it can be prosaic – the images were simply not provided to each element in our layer in QGIS. Now, we have to get rid of the empty spaces if we want to have everything clear and tidy. In this event, we should visit the .js file with our layer and find the “empty” categories in our JSON code, which are usually defined as the “NA”. If you find any, click the Ctrl+F and toggle the “Replace” section instead of “Find”. Next copy the one, which you found and paste it there. Remember about the comma also. The comma separates the element in JSON code. If you leave the comma it might come with an error resulting in layer disappearance in the map. When your string is copied properly (Pic. 27). Replace it with nothing.

Next, click the “Replace all” button marked red save your file and see the result below (refresh your page) (Pic. 28).

The result is really nice because our pop-ups are now everywhere clear without any unforeseen empty and messy spaces.
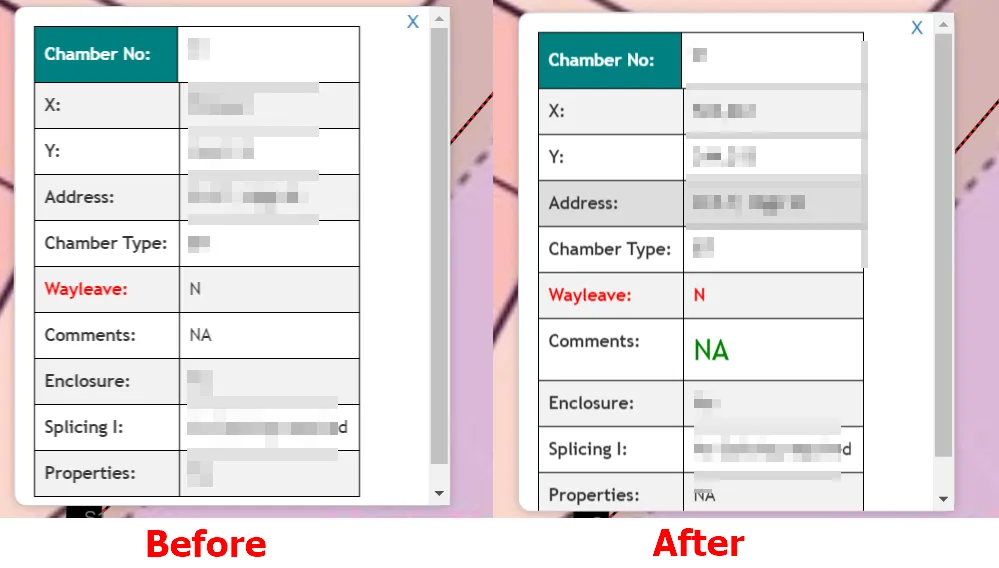
The last thing is the text stylization within the content section. By far I showed you how to deal with the text of our label. What’s left to work with is the customization of the content text displayed on the right side of our pop-up window.
The font can be changed once we enter the JSON code included in our given layer JavaScript file (Pic. 29), as per the example below, where you can see one of the elements visible on the map.

{ "type": "Feature", "properties": { "Chamber No": "S4", "X": 5222222, "Y": 2444444, "Address": "O\/S 12, High St", "Chamber Type": "NA", "Wayleave": "N", "Comments": "NA", "Enclosure": "No", "Splicing I": "NA", "Properties": "NA"}, "geometry": { "type": "MultiPolygon", "coordinates": [ [ [ [ -0.33334343534, 52.33333 ], [ -0.33333, 52.33333 ], [ -0.33333, 52.33333 ], [ -0.333396852569, 52.33333 ], [ -0.33333, 52.3333333 ] ] ] ] } },

{ "type": "Feature", "properties": { "Chamber No": "S4", "X": 5222222, "Y": 2444444, "Address": "O\/S 12, High St", "Chamber Type": "NA", "Wayleave": "<b><font color='red'>N</font></b>", "Comments": "<font id='json'>NA</font>", "Enclosure": "No", "Splicing I": "NA", "Properties": "NA"}, "geometry": { "type": "MultiPolygon", "coordinates": [ [ [ [ -0.333334343534, 52.33333 ], [ -0.33333, 52.33333 ], [ -0.33333, 52.33333 ], [ -0.33336852569, 52.33333 ], [ -0.33333, 52.3333333 ] ] ] ] } },
However, if you decide to input the CSS styling into your JSON code in this event, remember another ID description in our qgis2web.css file.
#json {
font-size: 23px;
color: green;
}
The final example is below (Pic. 30).
Sometimes there is no option to do the bulk changes such as this in your JSON layer file. In this case, you can enter the qgis2web.js file and add your class to the JavaScript code like below and get exactly the same effect.
if (layer.get('fieldLabels')[currentFeatureKeys[i]] == "header label") {
                            popupField += '<strong class="red">' + layer.get('fieldAliases')[currentFeatureKeys[i]] + ':</strong></th><td id="json">';
                         } else {
                          popupField += '<td colspan="2">';
                        }
I’ve presented quite a lot of ways to customize your pop-up window in the Openlayers map generated by the QGIS2web plugin. I am convinced, that you can find also other ways to adjust this information appearance for your needs. The wide way of changes, which can be done outside of the plugin settings itself shows how the QGIS2web plugin remains restricted against the powerful map library, which is the Openlayers. On the other hand, the QGIS2web plugin is definitely the quickest way to generate your interactive map. You can save a lot of time by not doing it completely from scratch. The limitations are significant, but I am sure, that they will be reduced in the future, as the new versions of the plugin are released. The most important thing is, that the QGIS2web plugin takes us to the advanced progress of our interactive map, which can be further developed by ourselves.
Mariusz Krukar
Links:
- QGIS2web main page
- QGIS2web main GitHub repository
- https://www.w3.org/TR/WCAG20/#navigation-mechanisms
- Web Mapping with QGIS2Web
- CSS Width property
- CSS selectors
- CSS min-width Property
- https://www.colorhexa.com/b73125
- https://cssbuttoncreator.com/
- https://gisqas.blogspot.com/2015/01/openlayers-adding-hyperlinks-to-pop-up.html
Forums:
- Add videos, PDF´s and other files to WebGIS
- Hyperlink of PDF files in QGIS2WEB
- Popup function is not working with multiple layers
- Photos not showing in popup
- https://gis.stackexchange.com/questions/256425/qgis2web-pop-up-image-path-definition
- gis.stackexchange.com/questions/282637/add-images-and-other-text-in-qgis-3-0-2-windows
- Grouped layers
- https://gis.stackexchange.com/questions/199041/how-do-i-set-the-width-and-height-of-a-popup-using-qgis2web-and-leaflet
- Popup width
- https://gis.stackexchange.com/questions/242733/using-qgis2web-to-display-pictures?noredirect=1&lq=1
- Fields, attributes, and popups
My questions:
Youtube:
Read also: