Content management in KML files
In my previous article, I clarified the link management in the relation between Google MyMaps – .kml files – Google Earth and the other way around. Now, as a continuation, I would like to bend down on content in .kml files. At first glance, it sounds simple, because each .kml file has content, written in XML language.
As long as you input any information into your .kml balloon, this is the content. Previously I discussed all possibilities to embed a graphic and linked stuff as content in a .kml file.
In this article, I would like to focus mostly on text content itself, balloon styling and additional elements, that we can input inside the .kml file description, about which maybe you didn’t know yet.
First of all, I would like to mention, that KML Balloon can render both HTML and CSS language. JavaScript is a more difficult situation because the Google Earth API has been retired since December 2015, which results, in dialogue boxes cannot be created and some functions won’t work. It doesn’t mean, that JavaScript should be definitely ditched. There are still a lot of things, which are supported.
Before we will be seriously involved with this whole stuff I would like to start with basic ways of .kml content manipulation, as we can get through simple interactive map builders.
1. INTERACTIVE MAP BUILDER EDITORS
There are quite a few interactive map builders on the Web, but some of them are based on JavaScript API solutions, other ones don’t support .kml files. To be said I mostly get around with Google MyMaps and Scribble Maps, from where these examples will come.
Google MyMaps content editor is really poor. This platform neither supports links (at least directly, which was explained previously here) nor any styles. All, that you can input there is only plain text.
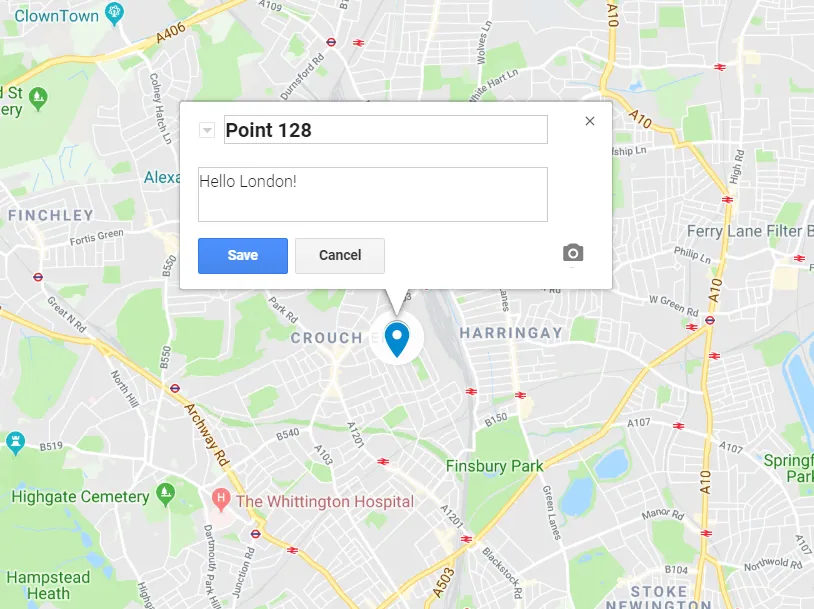
Pic. 1 An .kml file content edition options available in the Google MyMaps platform.
A much better situation is in another one, the Scribble Maps, where you have at least a basic tool kit for your content management in .kml files.
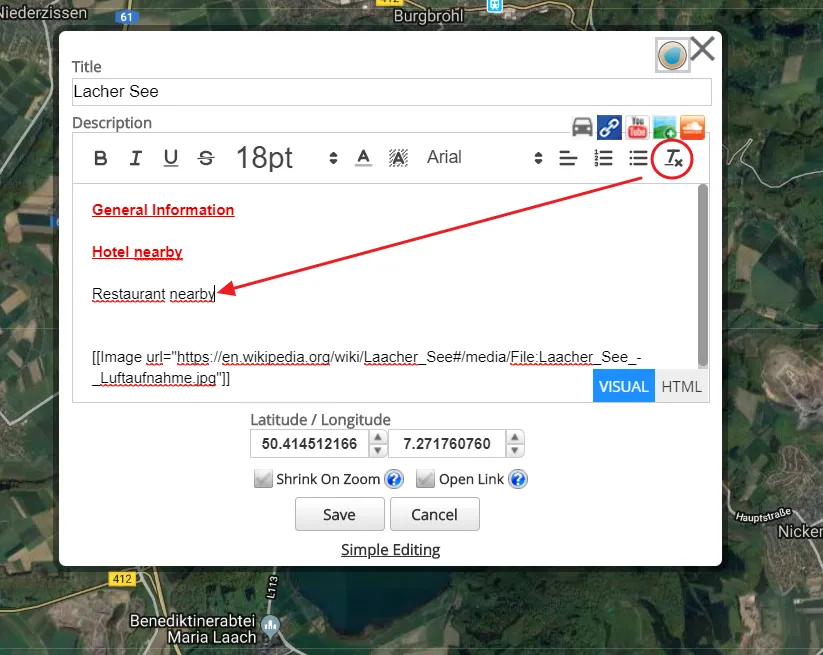
Scribble Map has a small interface, where next to the link or embeds image/movie options you can obviously input the text, but moreover instantly change the placemark coordinates, set object shrinking when zoom (object is only faint in Google Earth) out or (what’s the most important) make an advanced edition. This is the thing, which I would like to mention then.
By clicking on the advanced editing option you are redirected to another, bigger toolbox, where you can customize your content.
This interface includes a few major things to manipulate your text. You can: make it bold, italic, bigger and coloured. On top of that, you can align the text or make some paragraphs. Looks amazing. Let’s go through some samples then.
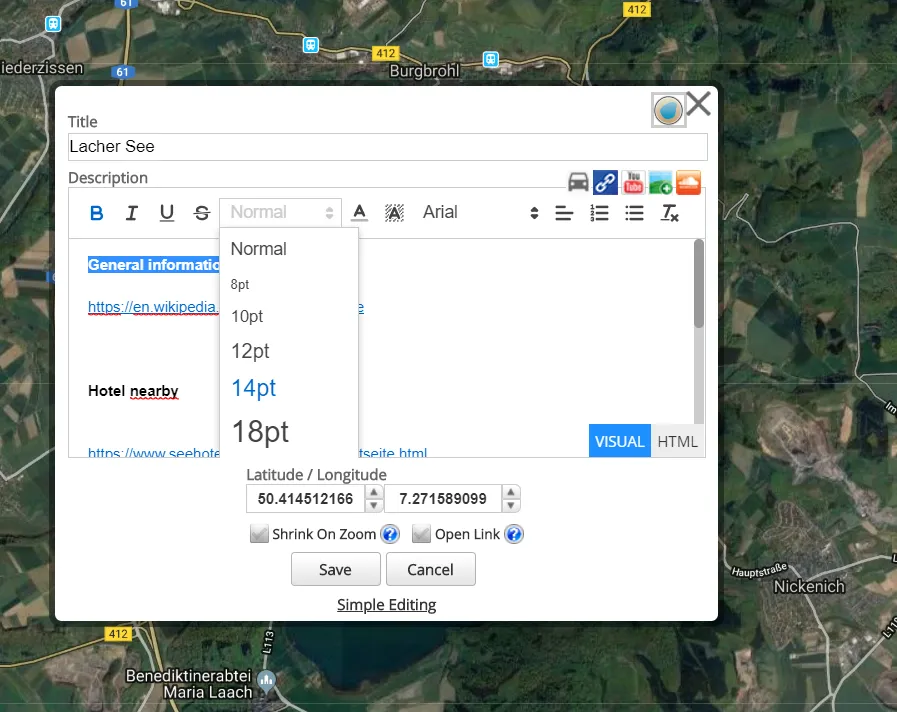
Pic. 2 Placemark description styling in Scribble Maps.
In the meantime, I must mention, that next to the visual toolbox, Scribble Maps allows you to make editions directly in HTML code. Unfortunately, the platform doesn’t support much HTML, as only the commands are possible to use in visual mode, at least in the free version. Nevertheless, it’s enough for some basic styling.
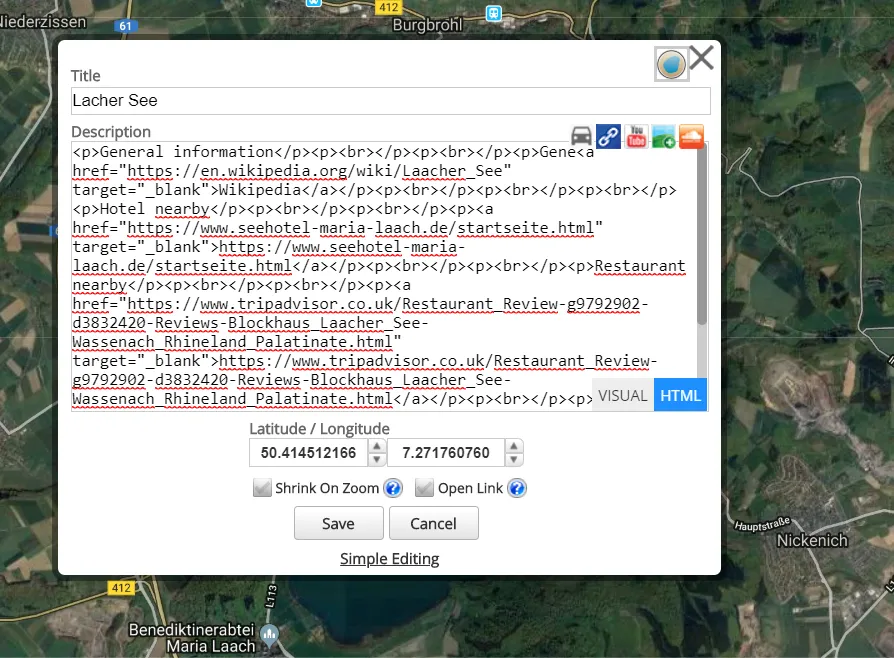
Pic. 3 Scribble Maps HTML editor for placemark.
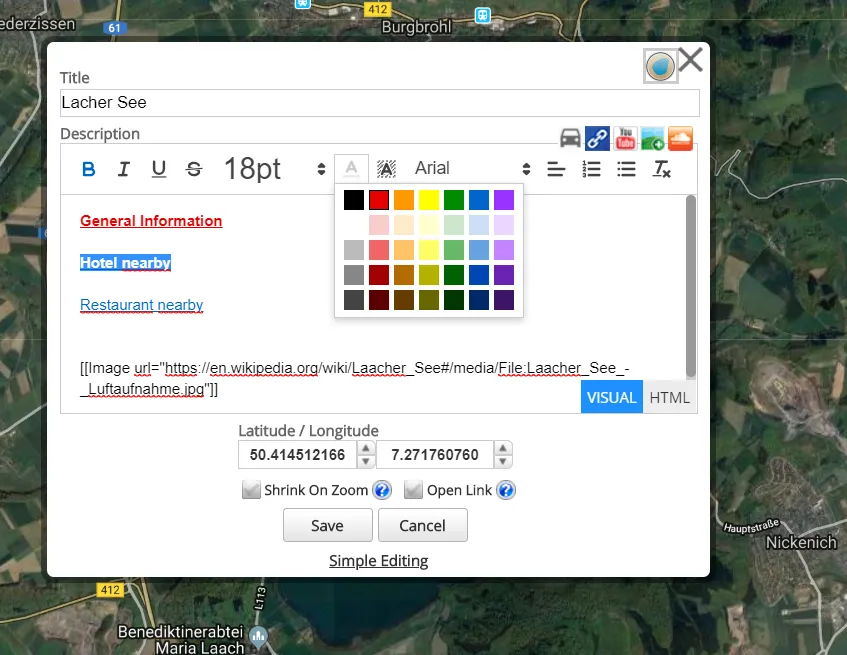
Pic. 4 Scribble Maps font colour changes.
Pic. 5 Scribble Maps text underline options.
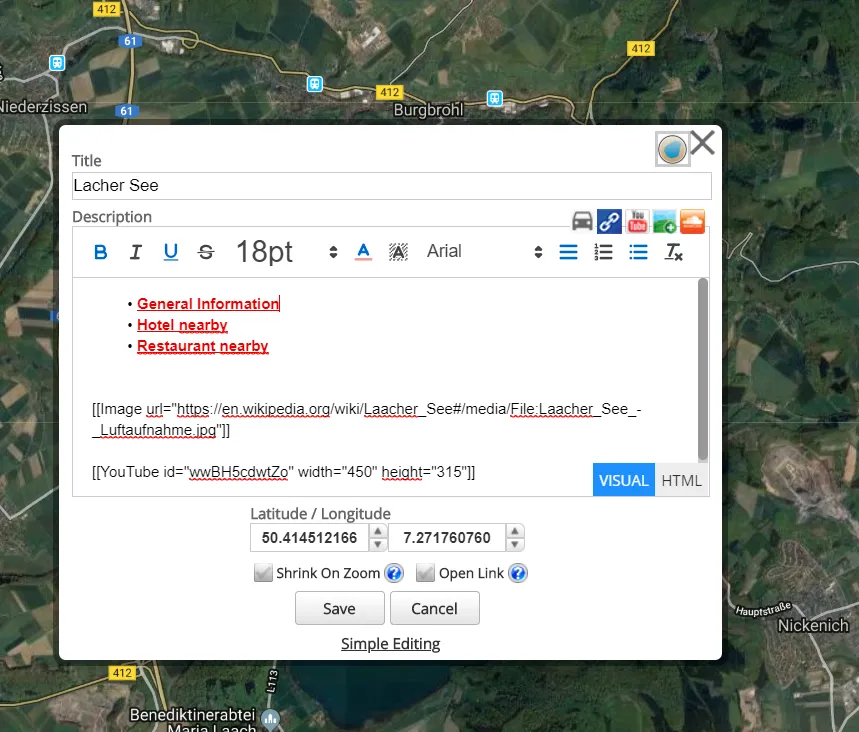
Pic. 6 Ready prepared and underlined text in Scribble Maps.
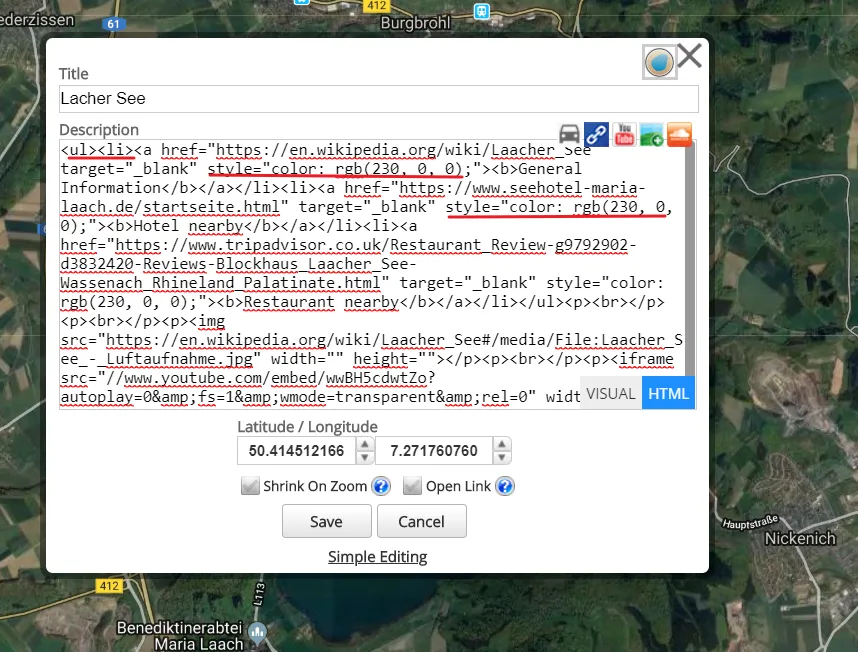
Pic. 8 And all stuff how it looks in the HTML code editor.
At the finish, we can get a pretty nice styled .kml file description as per below:
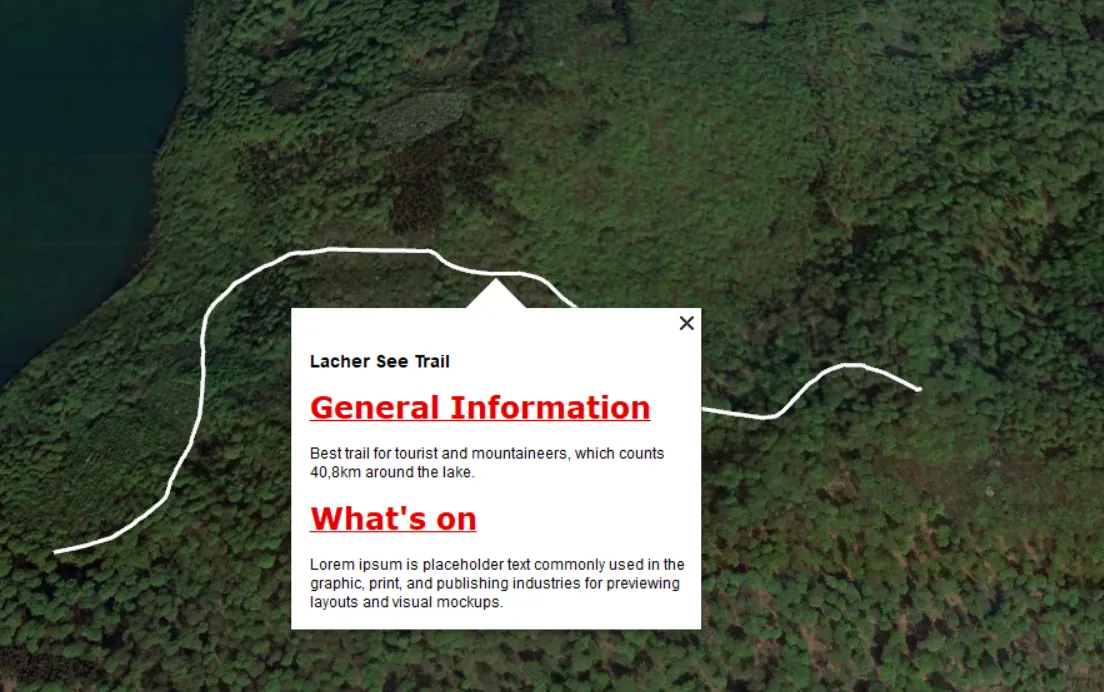
Pic. 9 .kml file description made with the Scribble Maps interactive map builder.
All things above are basic and they will work, however, if you still want something more to do with your placemark description, then you must jump to serious editions.
To be honest I mean at least XML-based editions, through relevant software such as Notepad++.
2. INPUT HTML ELEMENTS INTO THE PLACEMARK DESCRIPTION
Apart from a few basic HTML elements, which we can input via Scribble Maps interactive map builder, which obviously can be not enough, we have most HTML codes, available to adopt inside the .kml file.
I will illustrate it with a few examples.
In example 1 we want to add up some table, where we place some basic information about the population of the town (Pic. 10, 11), adding up some very basic stylization too.
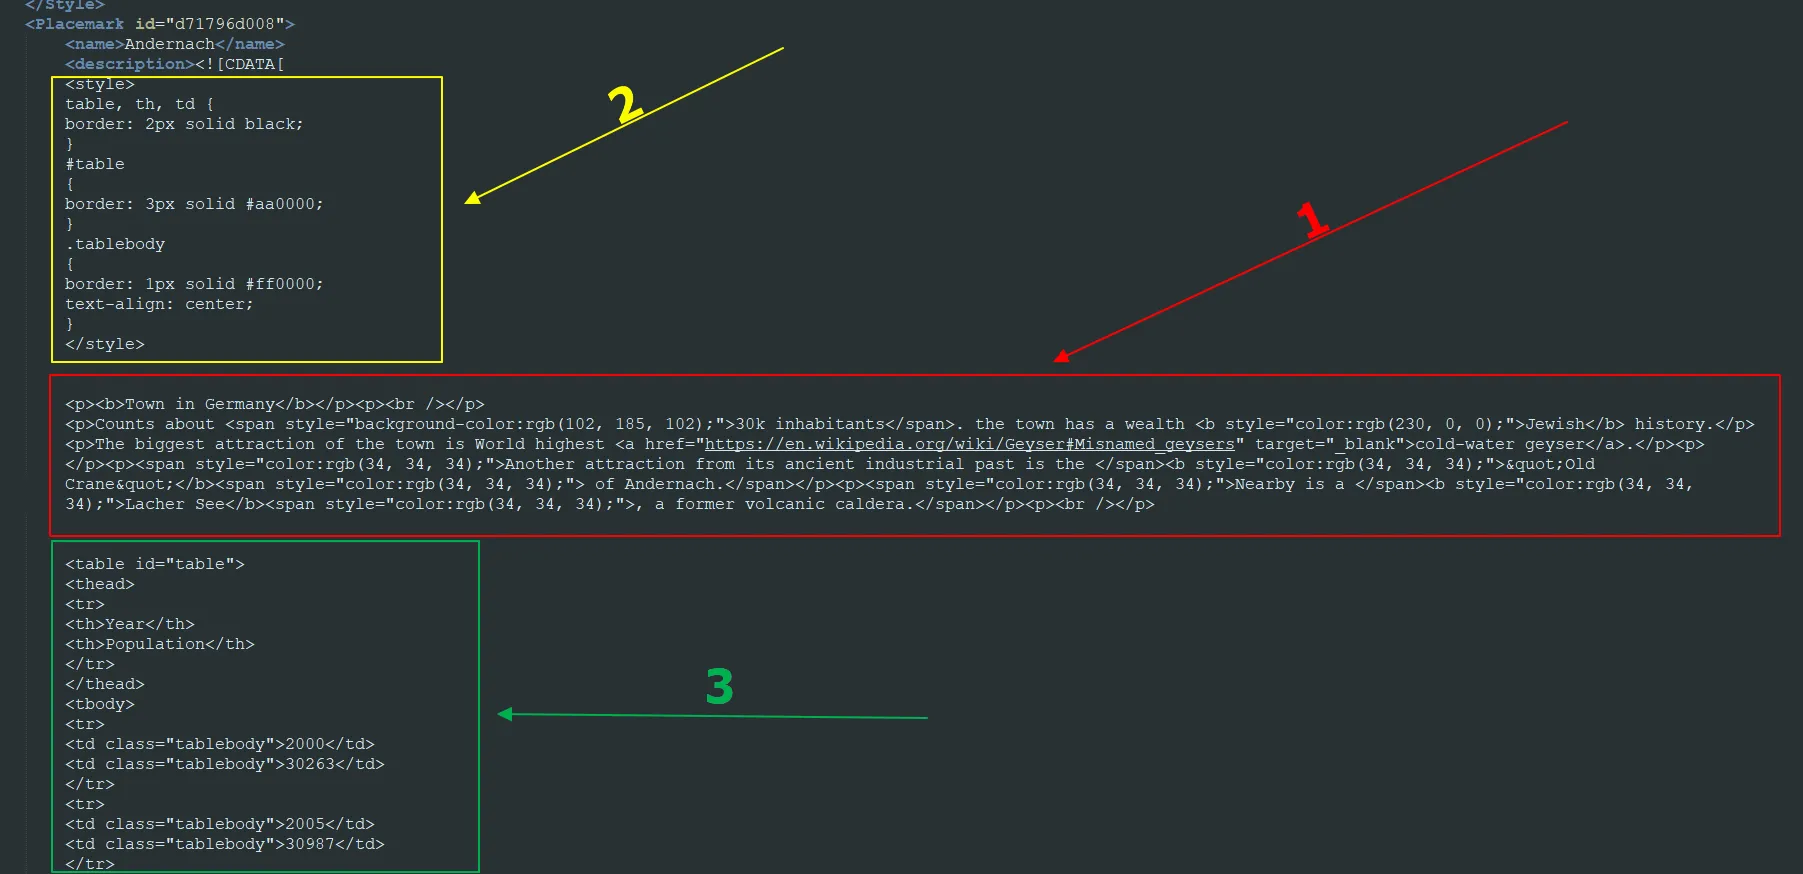
Pic. 10 Adding an HTML table with simple CSS stylization into .kml file, where: 1 – stuff already done in Scribble Maps; 2 – CSS stylization; 3 HTML code with table.
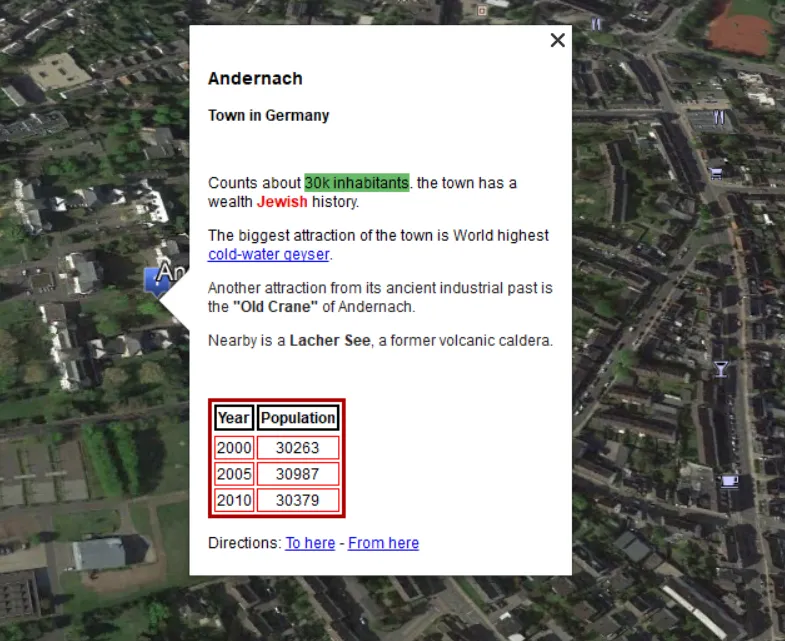
Pic. 11 Adding HTML table into .kml file, Andernach town in Germany.
To be fair, stylization is an inherent element of HTML code not only in web mastering but also in simple .kml file editions. In the picture above all stuff except the table underneath has been prepared in Scribble Maps. The main feature of HTML as coming from this interactive map builder is unfortunately very packed. It makes the code reading more difficult. Unlike Scribble Maps, I will show clear and easily readable code.
Staying by tables I would like also to demonstrate another way to get the data into .kml. This data is external and not in HTML code, so it must be manipulated first.
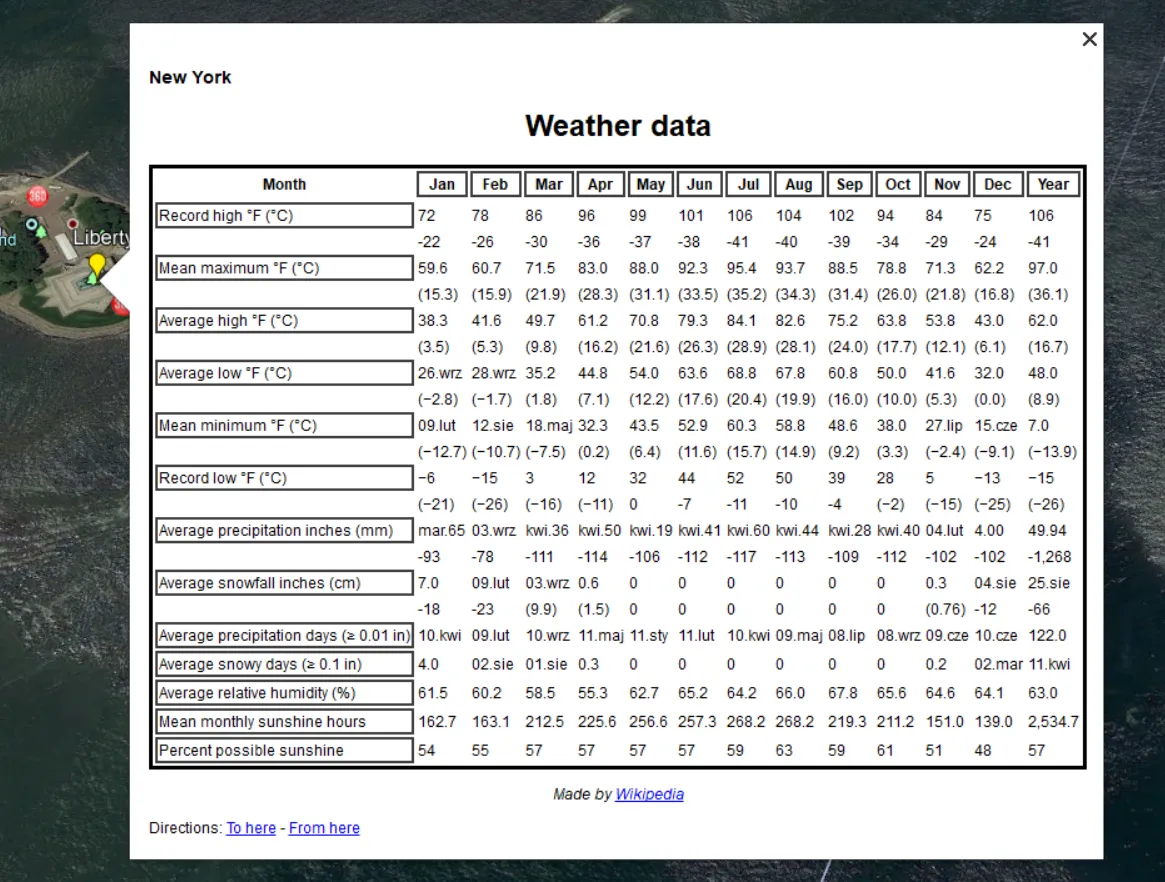
Let’s create a .kml file with weather data for New York. What we need is basic data, which we can get from Wikipedia (Pic. 12). Next, we must copy it into Excel or Google Sheets and save it in a .csv file. Make sure, that the cells where you input the data are formatted properly. Otherwise, you can get some sad surprises somewhere. (Pic. 13). I intentionally come around this issue, because it comes outside of this article’s purpose. The further process will be the conversion from .csv to .html extension, possibly via ConverttoCsv tool (Pic. 14). Afterwards, we should get a .html version of our data (crude table with weather datasets)(Pic. 15).
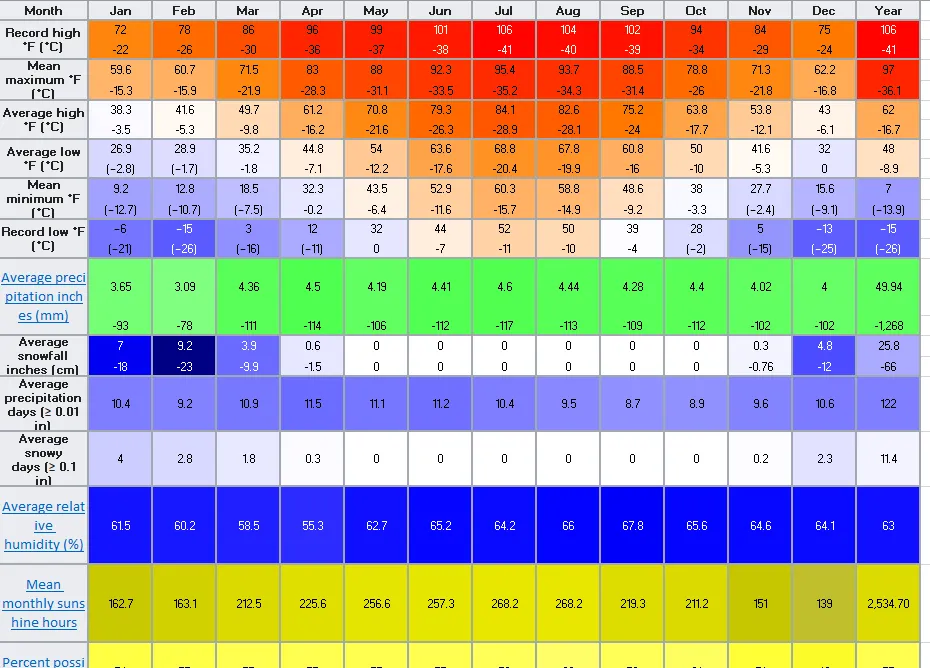
Pic. 12 The climate data for New York (Wikipedia.org).
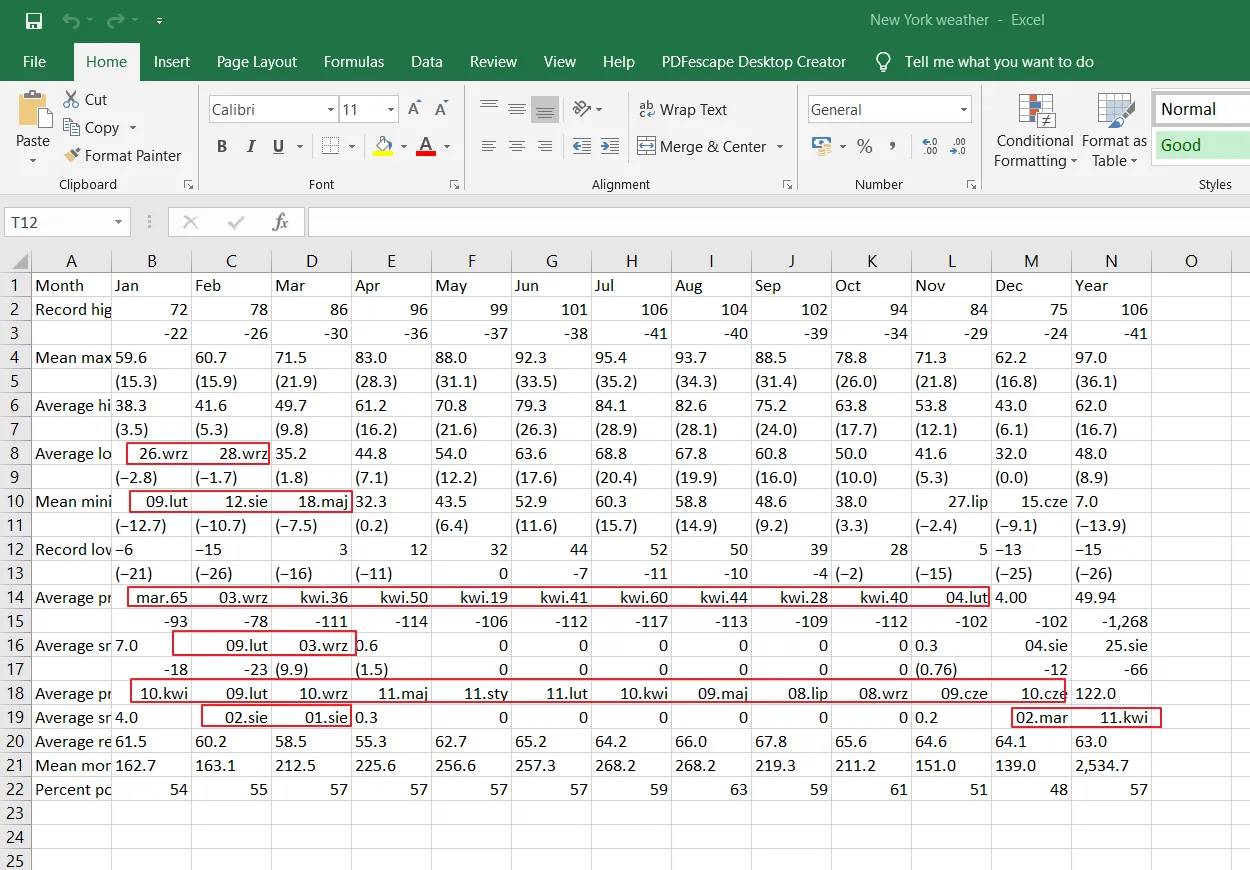
Pic. 13 New York climate data from Wikipedia are now in Excel. Red boxes indicate errors caused by wrong default cell formatting in Excel.
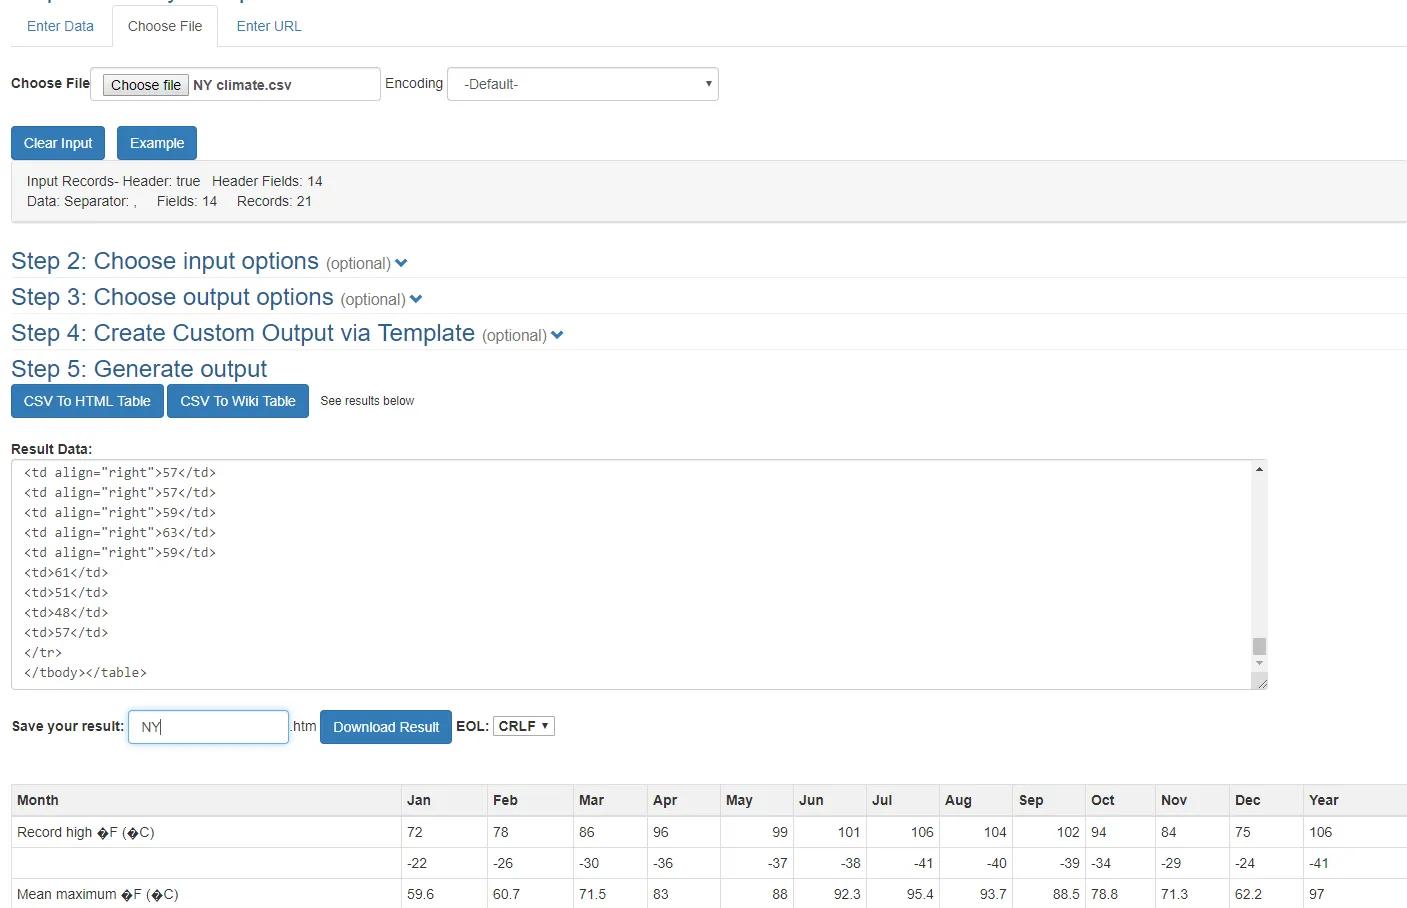
Pic. 14 Converting from .csv to .html in the tool.
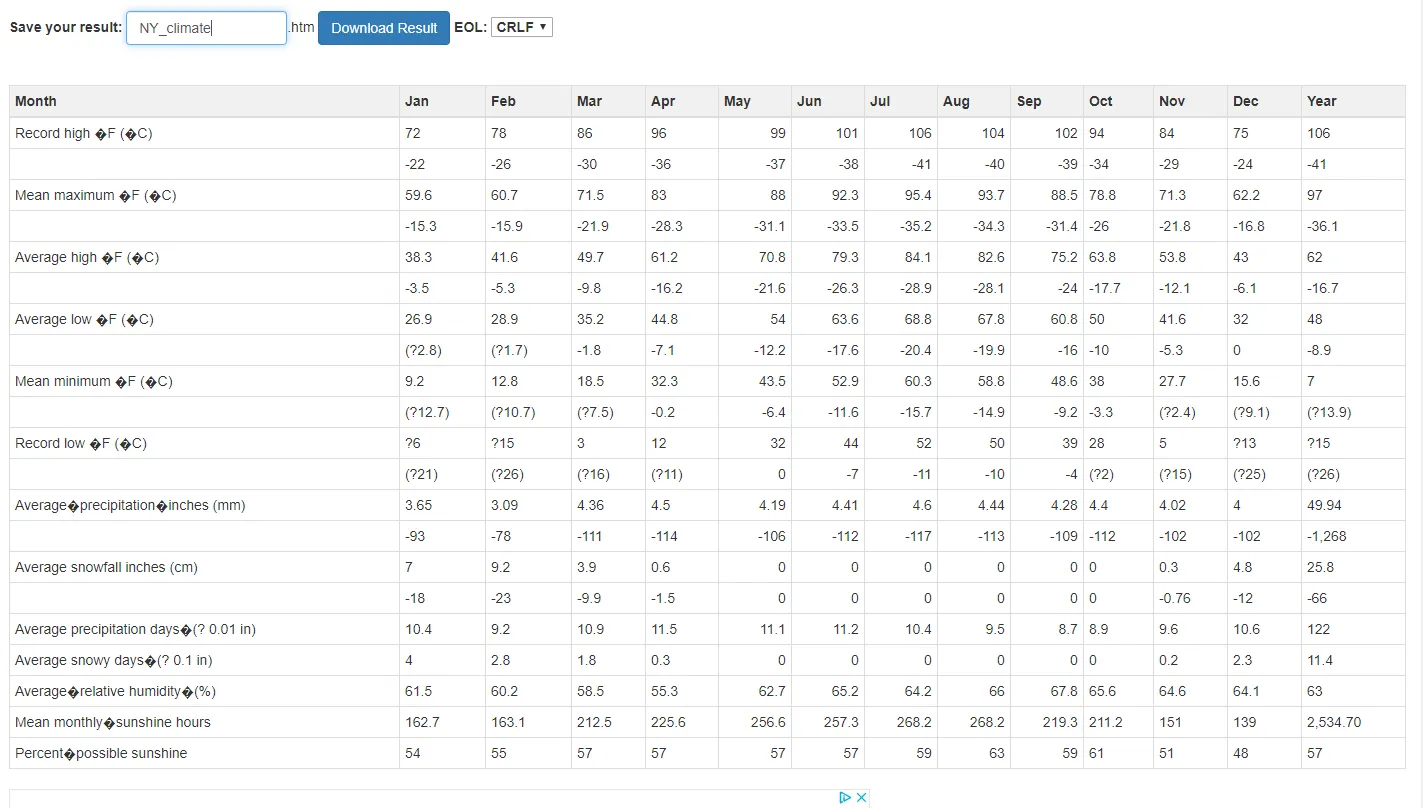
Pic. 15 The New York climate data from Wikipedia are already converted into a crude .html table, which we can download easily.
Once we download our data, let’s open it in Notepad ++. At first glance, it won’t look small. I propose to leave it as it stands, select all and copy inside our [![CDATA]] space in .kml file (Pic. 16, 17).
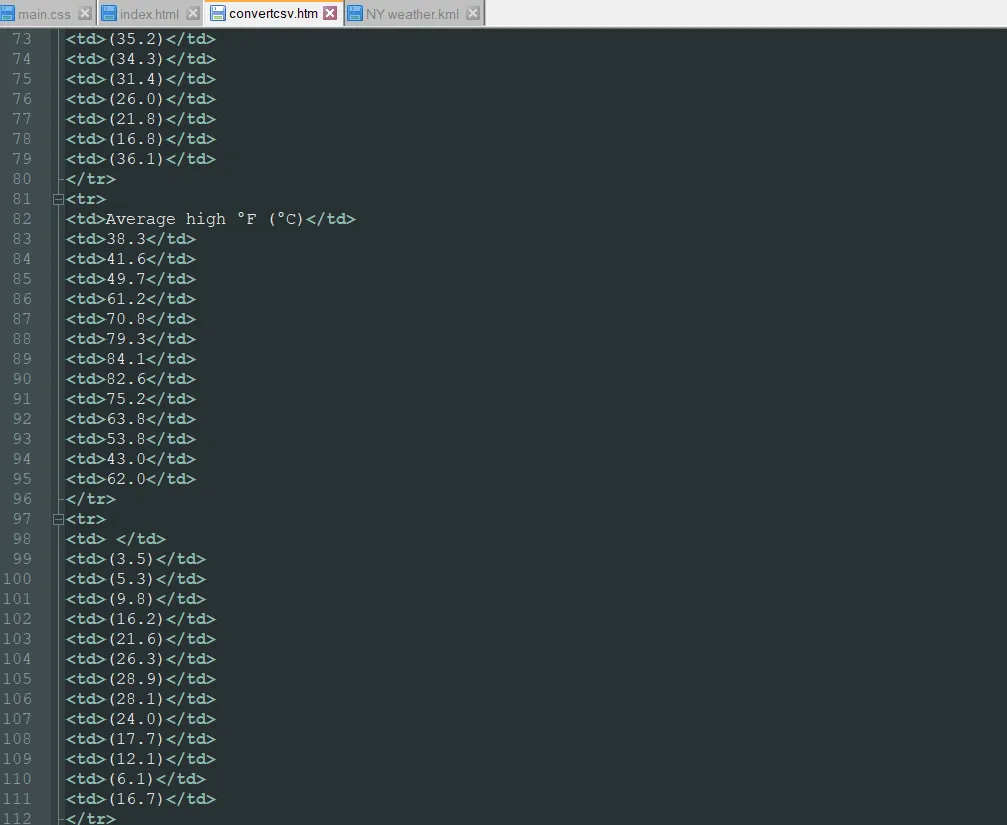
Pic. 16 New York climate data from Wikipedia already as an HTML file opened in Notepad++.
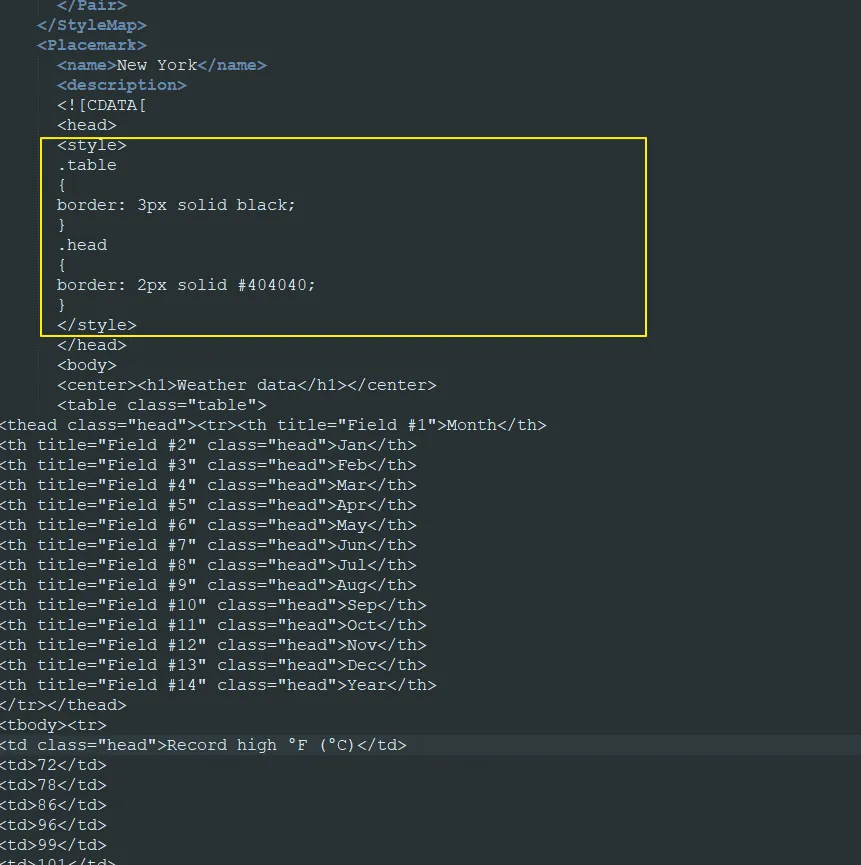
Pic. 17 New York climate data from Wikipedia is now embedded in a .kml file with some simple CSS styling, marked yellow.
After some simple styling, we can enjoy our informative .kml file on Google Earth (Pic. 18).
Pic. 18 New York climate data now on Google Earth.
In the HTML code, we have really wide possibilities to fill up our .kml content. We can input images (also with descriptions), and tables, create buttons or even embed some external websites.
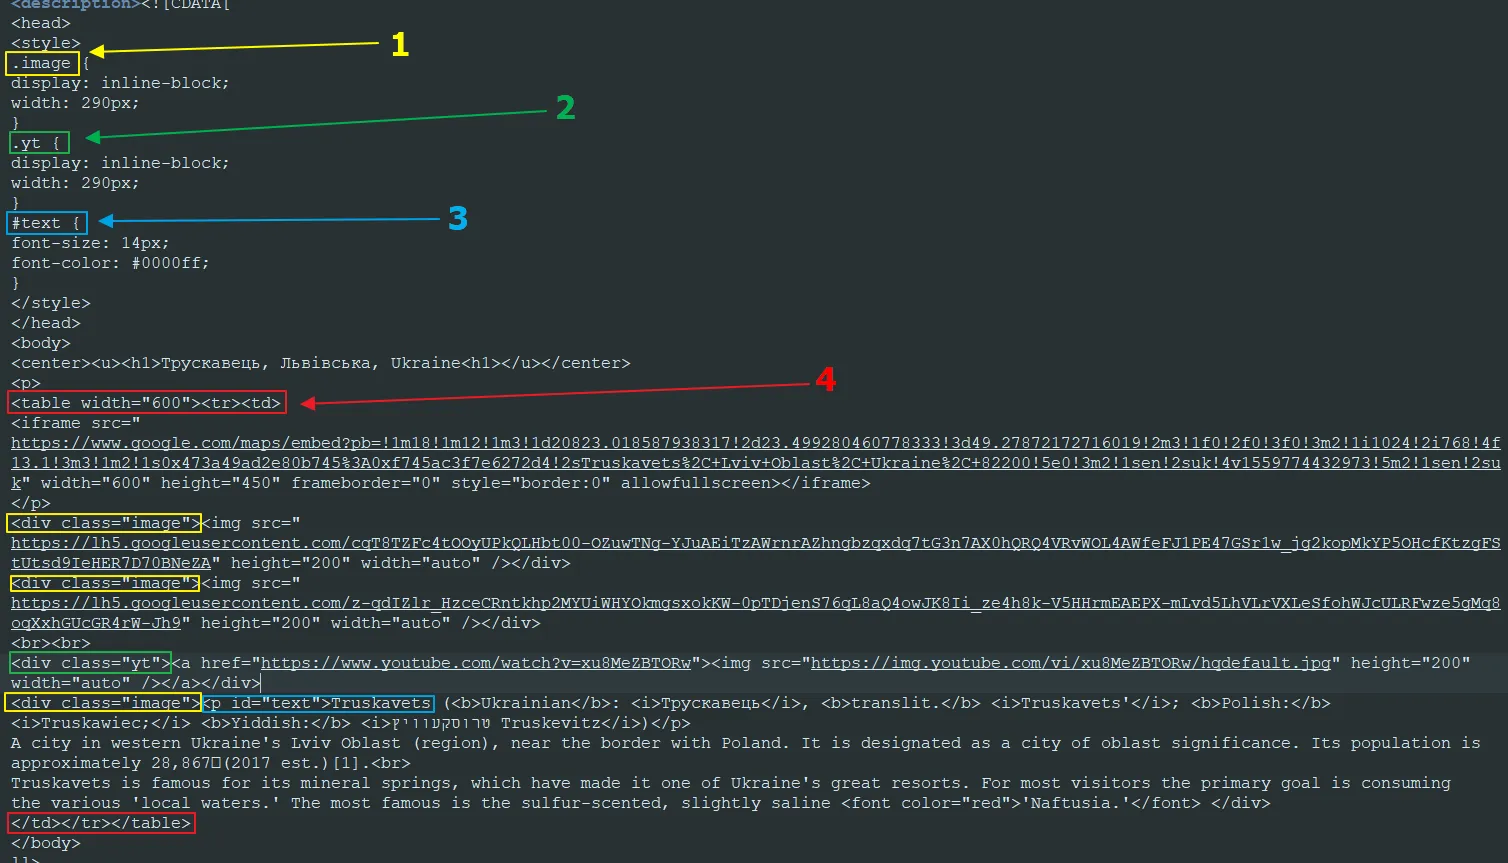
Pic. 19 Wider HTML and CSS code in .kml file, including i.e. picture and displacement.

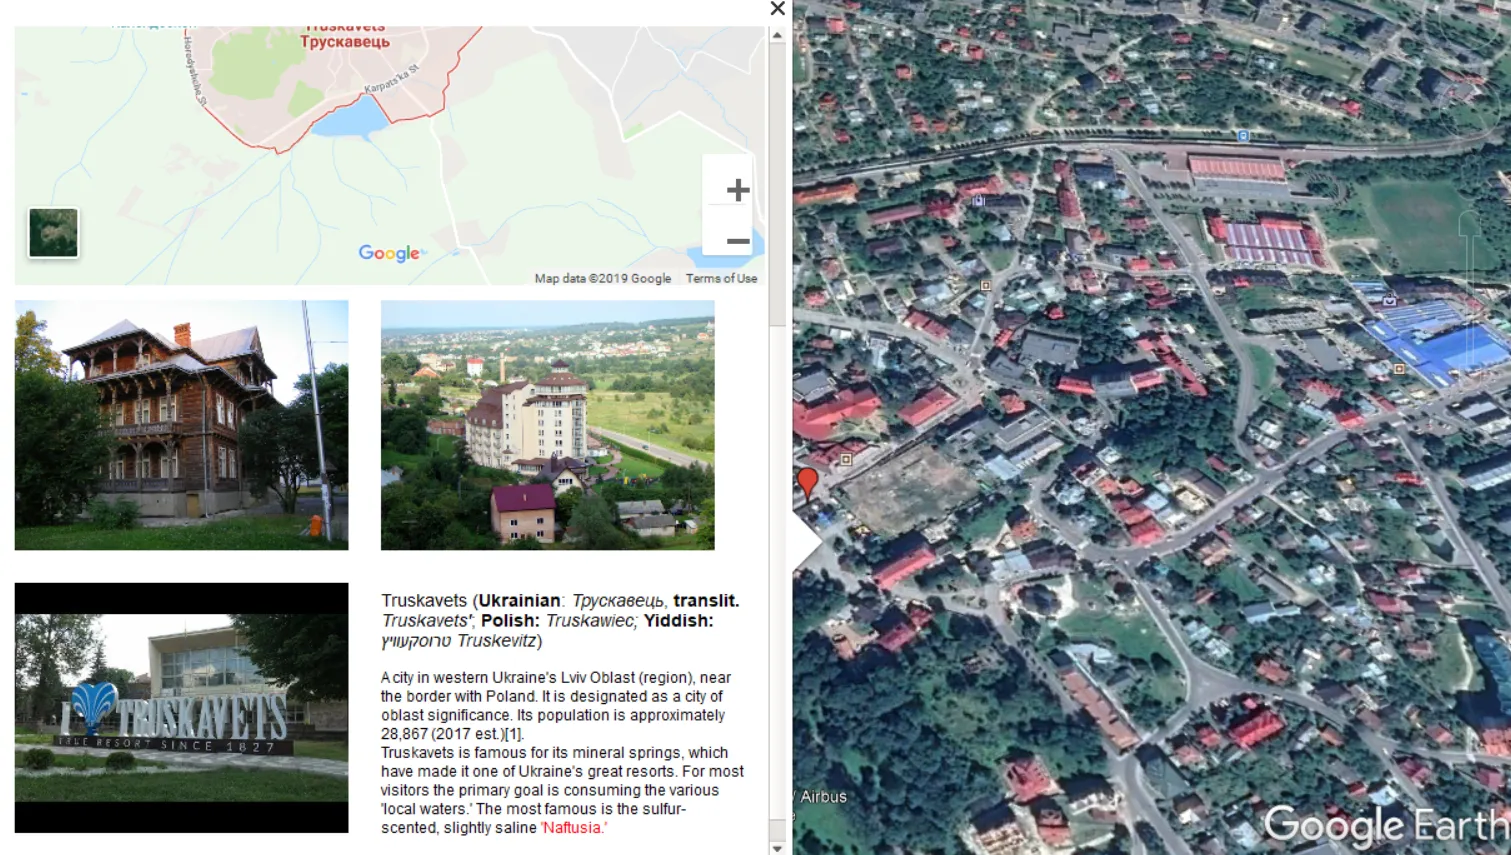
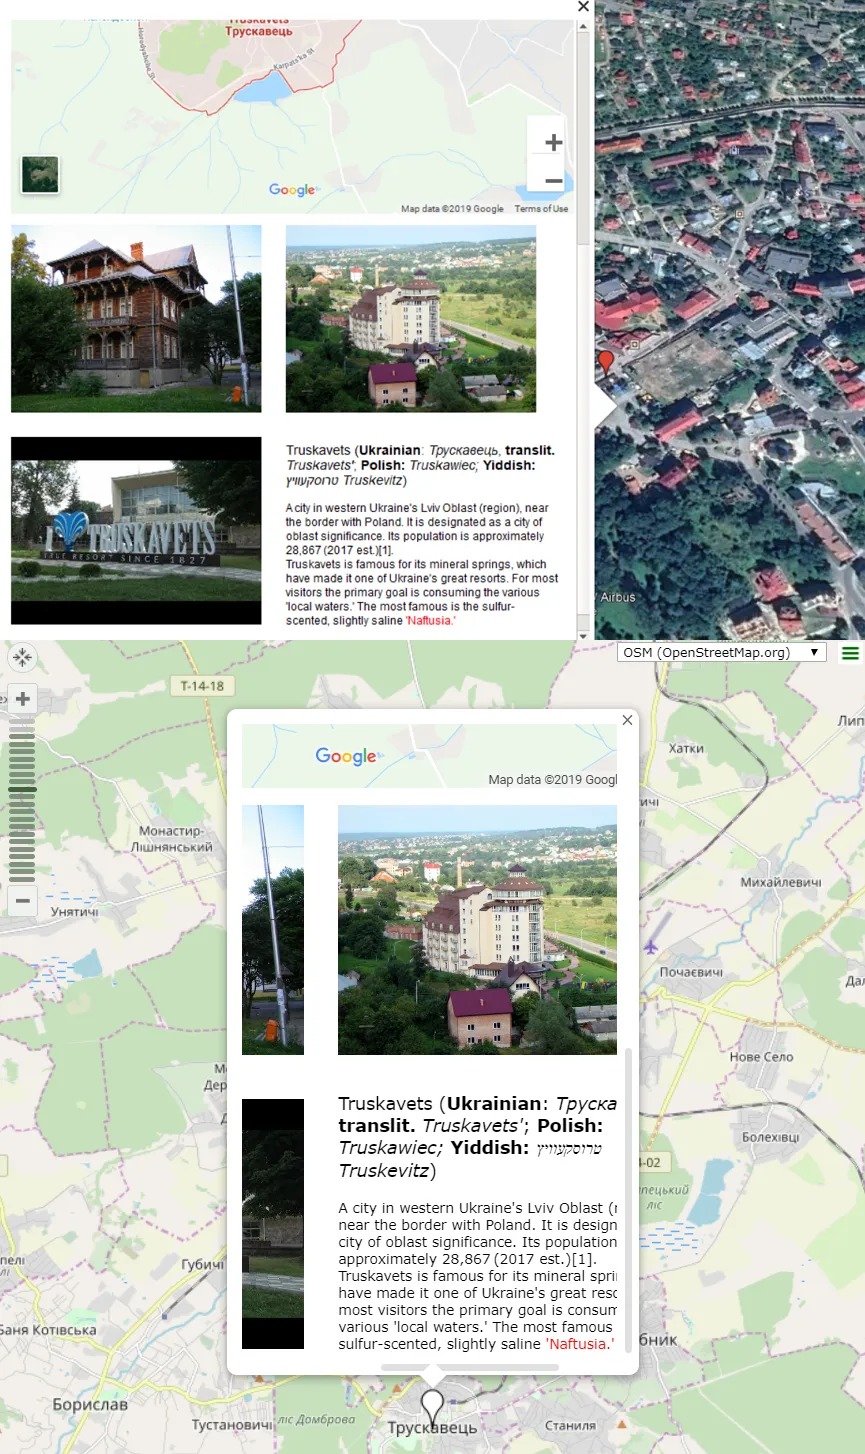
Pic. 20, 21 An .kml file with information about Truskavec in Ukraine. Even Google Maps can be embedded in the placemark description.
So, as you saw in each example. HTML is surely viable within the .kml file description. HTML along with CSS and JavaScript language consists of front-end development, known as web mastering. These three languages are basically integral to each other if we want to create a good website. It is also translated into [![CDATA]] space, where these languages can build the .kml file description.
2. INPUT JAVASCRIPT ELEMENTS INTO THE PLACEMARK DESCRIPTION
As I mentioned above, some JavaScript codes are restricted in the .kml file as a result of Google Earth API retirement. However, we still can enjoy some simple solutions, tweaking up our .kml file functionality. One of the basic tools, that we can see in the .kml balloon is the clock (Pic. 22, 23).
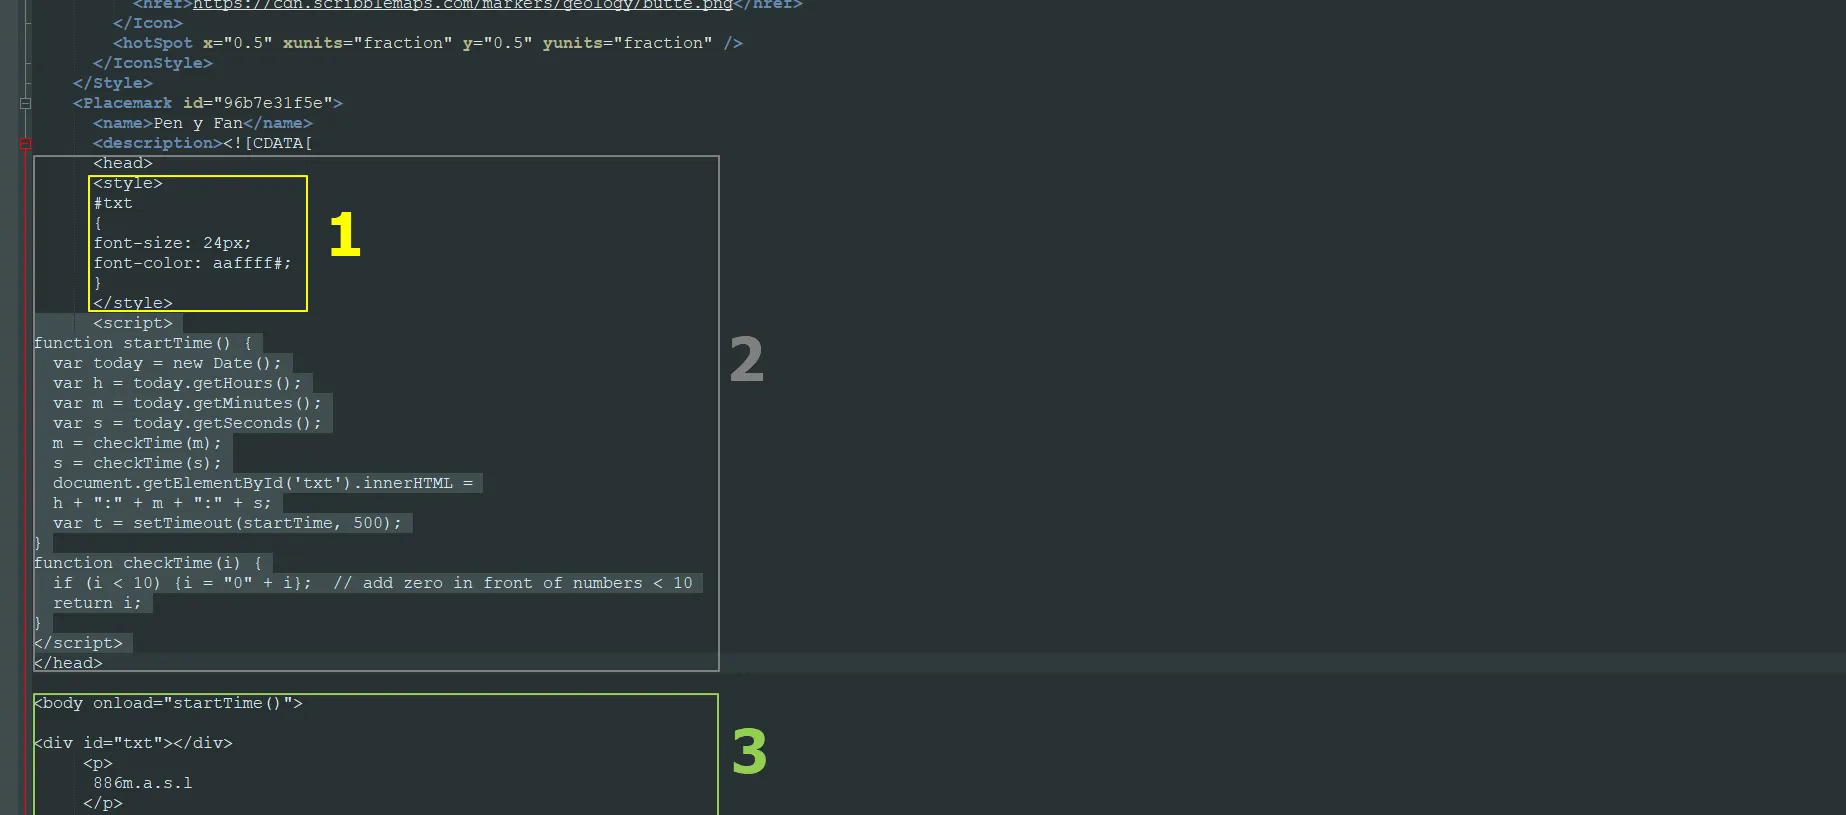
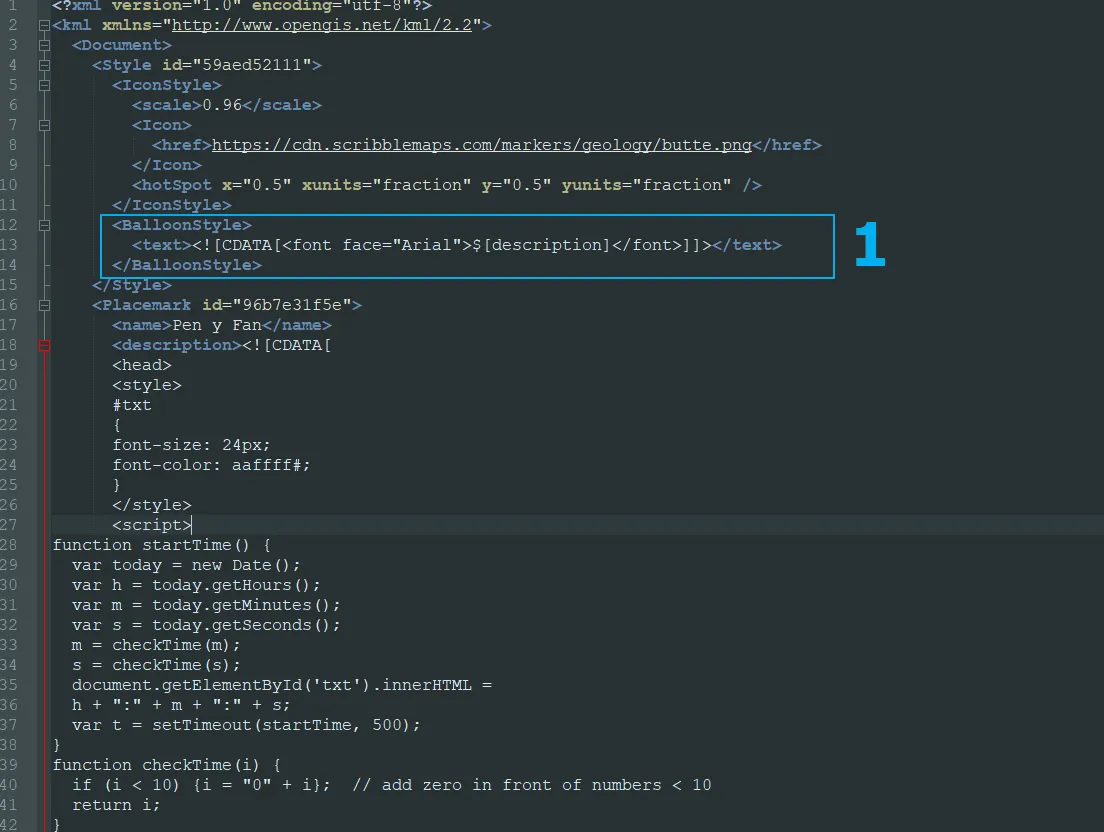
Pic. 22 The .kml file description includes JavaScript code, where: 1 – CSS basic stylization; 2 – JavaScript code (likewise CSS placed in ‘<head>’ zone; 3 – an HTML code in ‘<body>’.
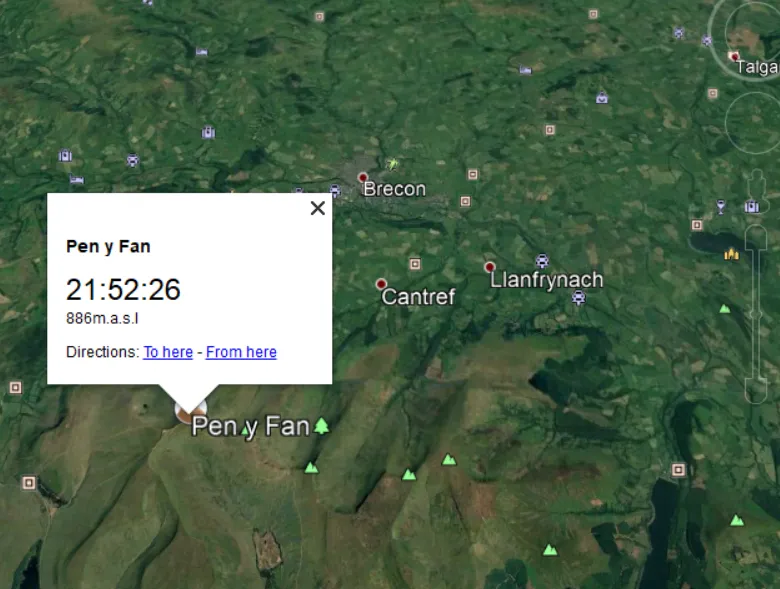
Pic. 23 JavaScript clock presented in Pen Y Fan .kml placemark in Google Earth.
In general, the .kml placemark content within [![CDATA]] command features a website-looking layout, divided into 2 major pieces: head and body. In the ‘<head>’, we put the stuff affecting a whole .kml balloon appearance such as CSS style or JavaScript code. In the ‘<body>’, the HTML content mainly.
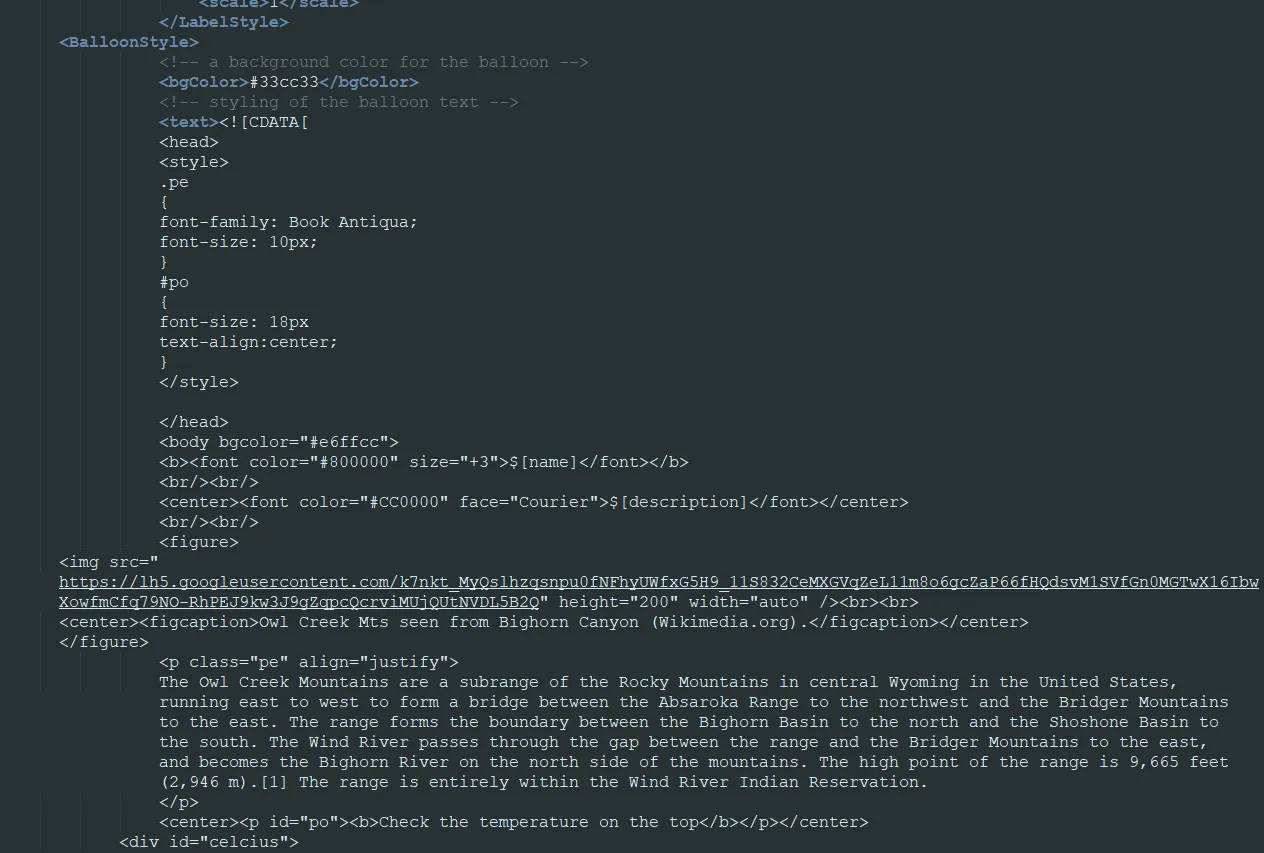
When looking at the picture above, you can see the elements, which can annoy you. There is information about the direction, which is not always needed. At this moment we are entering into another way to customize a .kml content, through the ‘<BalloonStyle>’. I will describe it widely below. Now I would like to mention how to get rid of this information about direction. We must create a new space in our .kml file as per below (Pic. 24), making this stuff invisible for the future (Pic. 25).
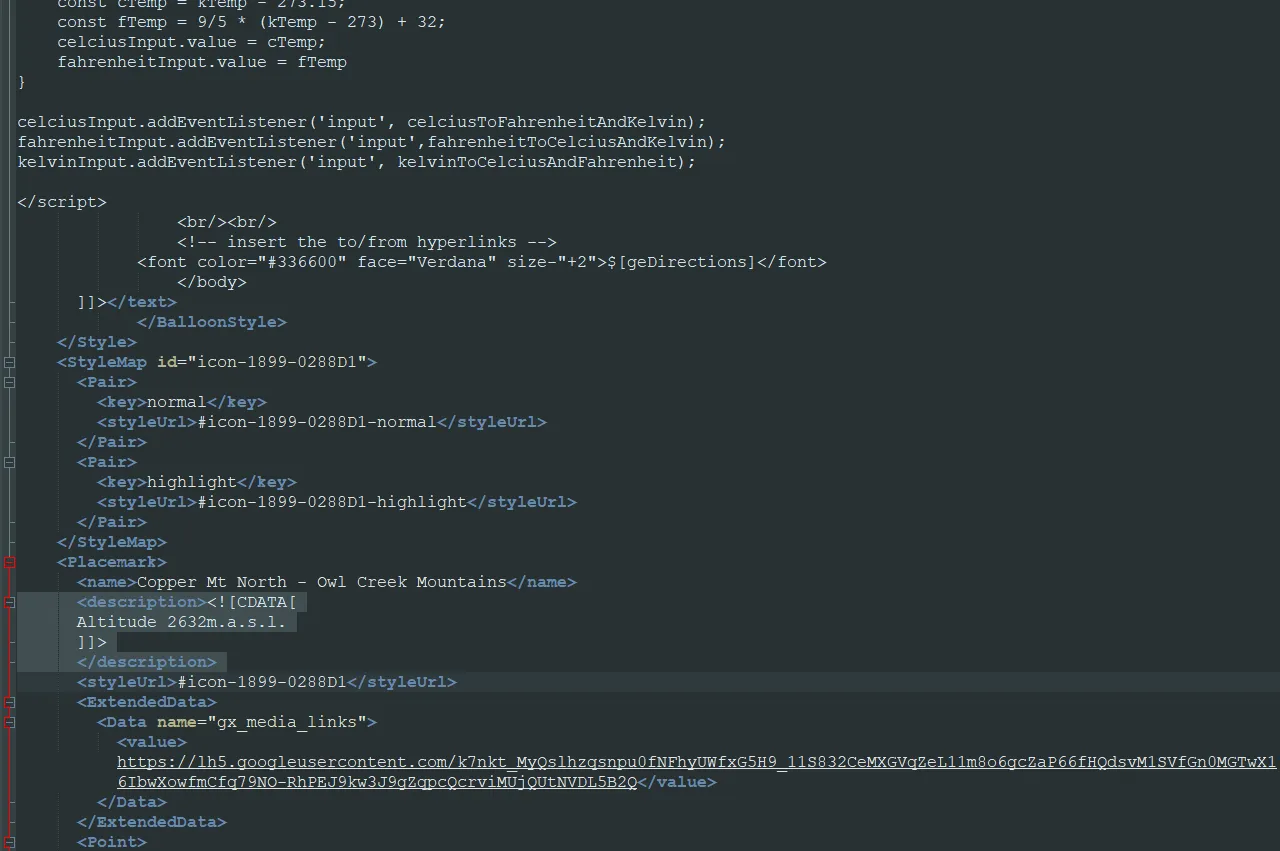
Pic. 24 A place in our .kml file, where the ‘<BalloonStyle>’ space should be placed. As you may have noticed there is also the [![CDATA]] command, setting the text properties for a particular part of the .kml content (description).
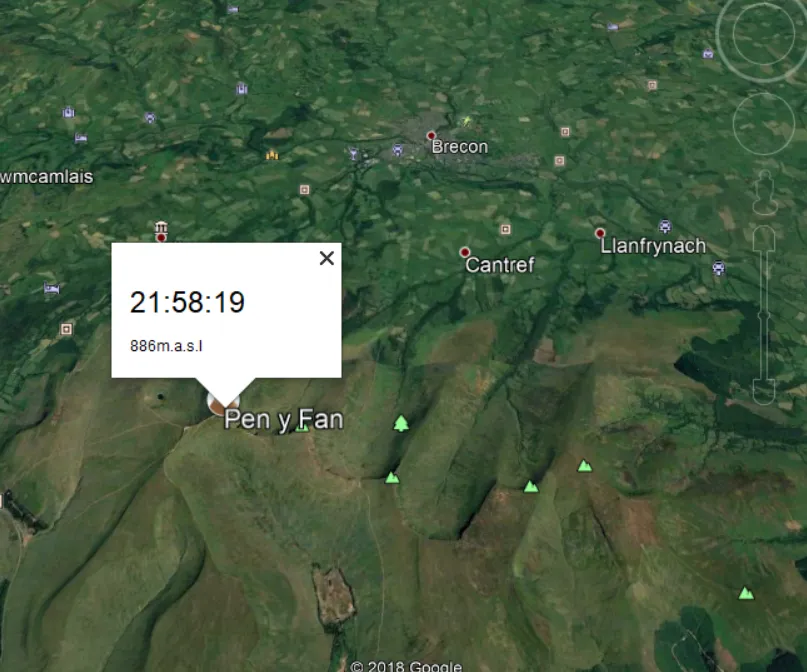
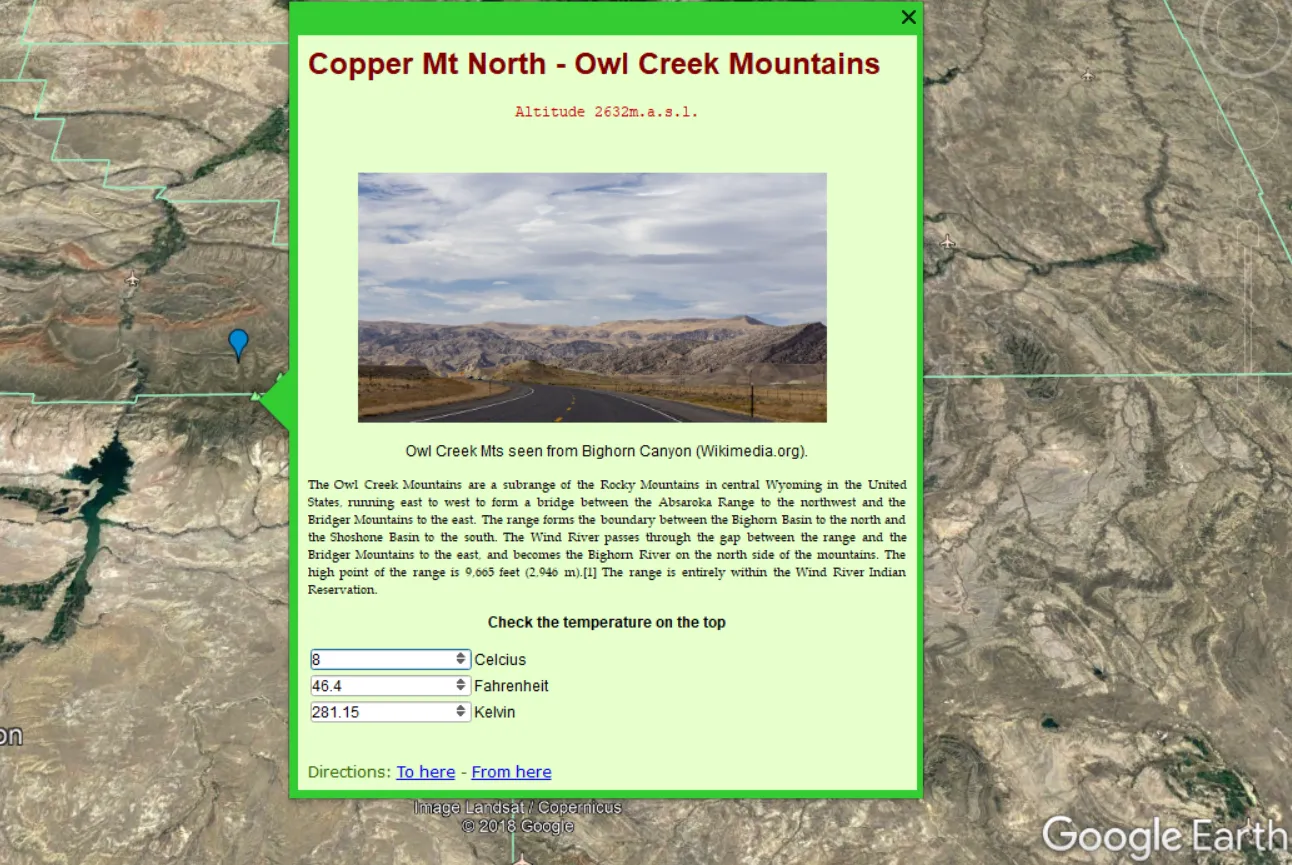
Pic. 25 The implemented ‘<BalloonStyle>’ into the .kml file results in disappearing the title and info about directions.
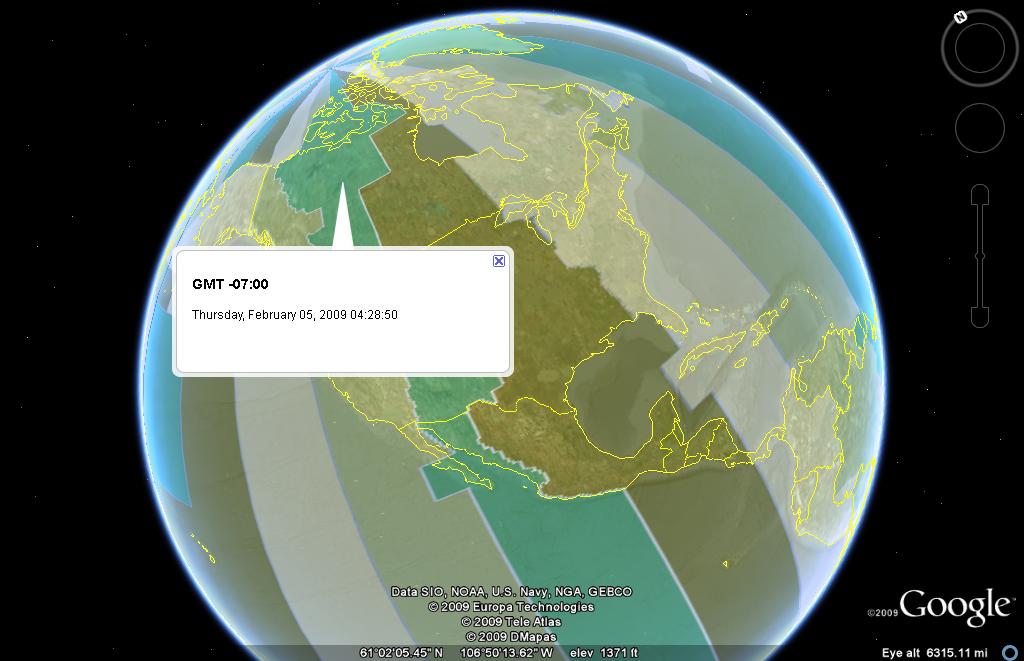
Pic. 26 World time zones presented in .kml file (Barnabu.co.uk).
The clock function in JavaScript is the best to present World time zones in .kml. It has been already presented here and looks excellent (Pic. 26).
Another JavaScript appliance in .kml files can be a text twinkling, in order to draw someone’s attention (Pic. 27).
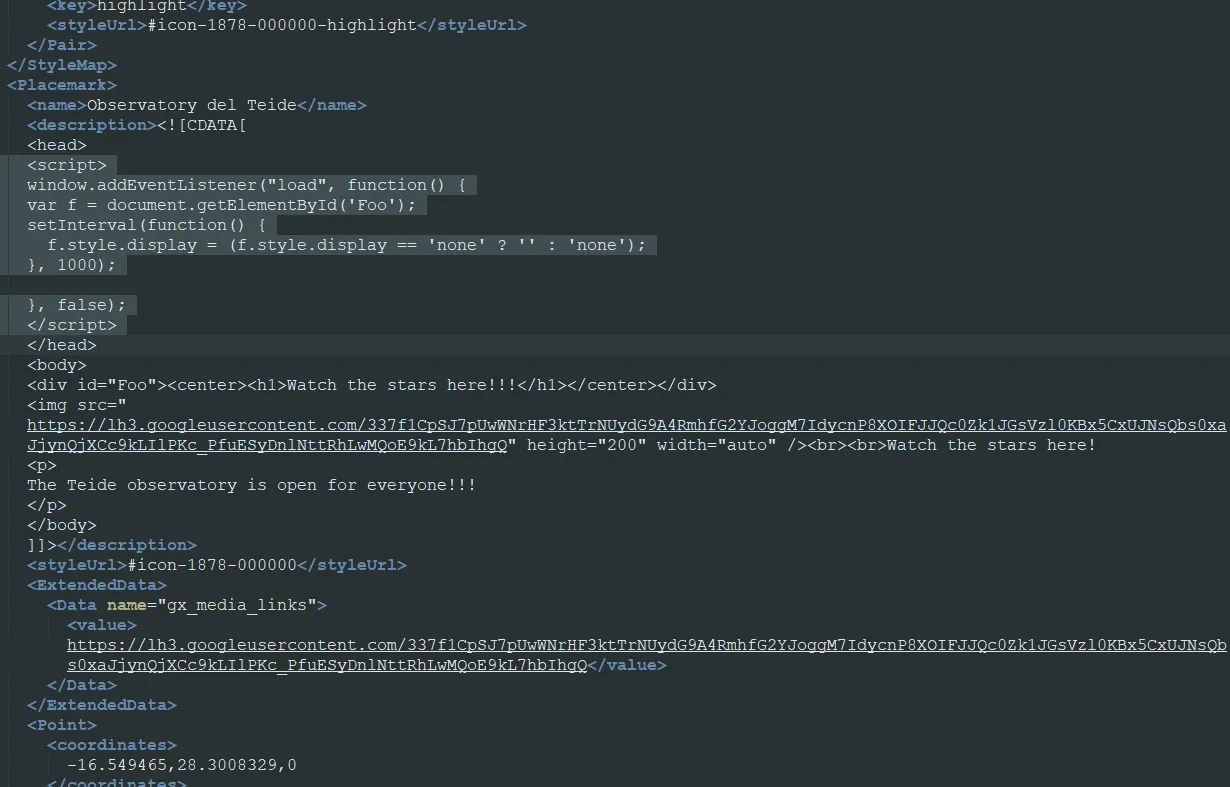
Pic. 27 The JavaScript code (highlighted) causes the text to twinkle in the .kml file description, presented in Google Earth.
The JavaScript in .kml can come directly from the ‘<script>’ command, placed in the .kml file as well as from an external script file. It means, that some simple JQuery elements will work too (Pic. 28), although be careful with it, again! Google Earth API has been depreciated.
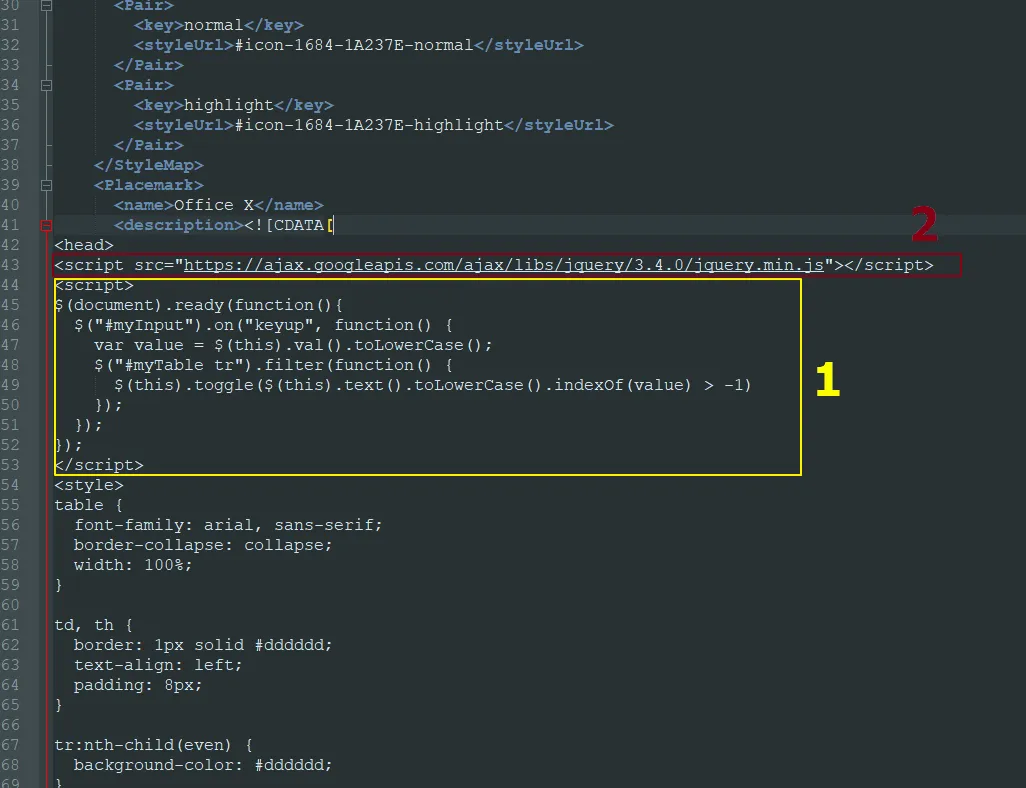
Pic. 28 Javascript code for filterable table, placed in .kml file, where: 1 – code embedded into the XML code; 2 – link to external JavaScript source.
If you want to see the result of my work, see this short video below:
All code editions, which I am showing you in Notepad++ you can make straight through the “description” label in Google Earth when your placemark has been loaded (Pic. 29).
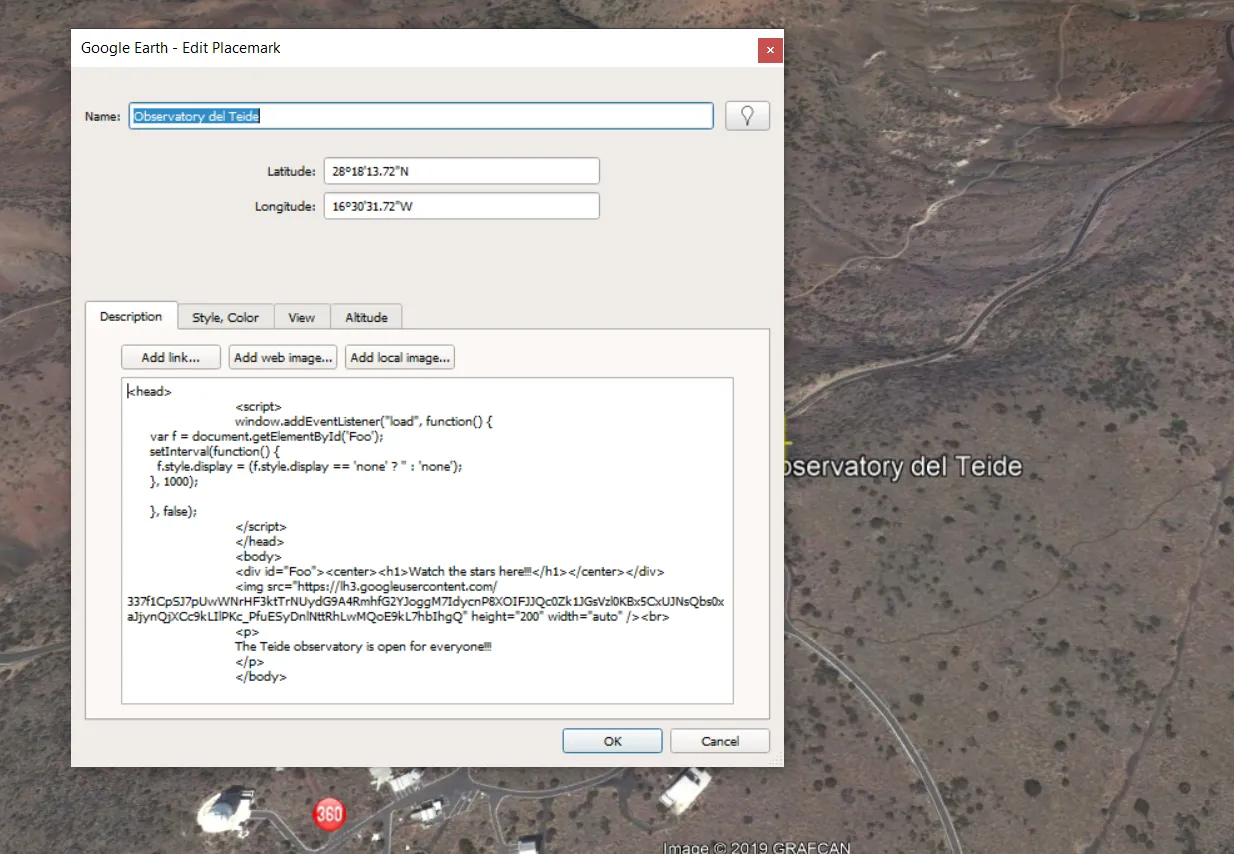
Pic. 29 The .kml placemark content edition straight in Google Earth software.
Remember, that your code in the Google Earth “description” label is not highlighted at all. It means that is quite easy to make a mistake, and what is worth, not easy to find it. So personally I would recommend you use some designated software instead, at least in order to highlight the code or some debug options.
3. WORK WITH THE BALLOON-STYLE
A BalloonStyle is tailored for bulk .kml file style customization. We can style our .kml file in a basic and much wider way.
Basically, the Balloonstyle requires the input of a separate command, which doesn’t appear as a default in a standard .kml file created by tools (like Google MyMaps). The code can look as below:
<BalloonStyle>
<bgColor>ffffffbb</bgColor>
<text><![CDATA[
<font face=”Courier New”>$[description]</font>
]]></text>
</BalloonStyle>
I used this simple code in order to customize the .kml balloon about the World’s highest arc dam (Pic. 30, 31).

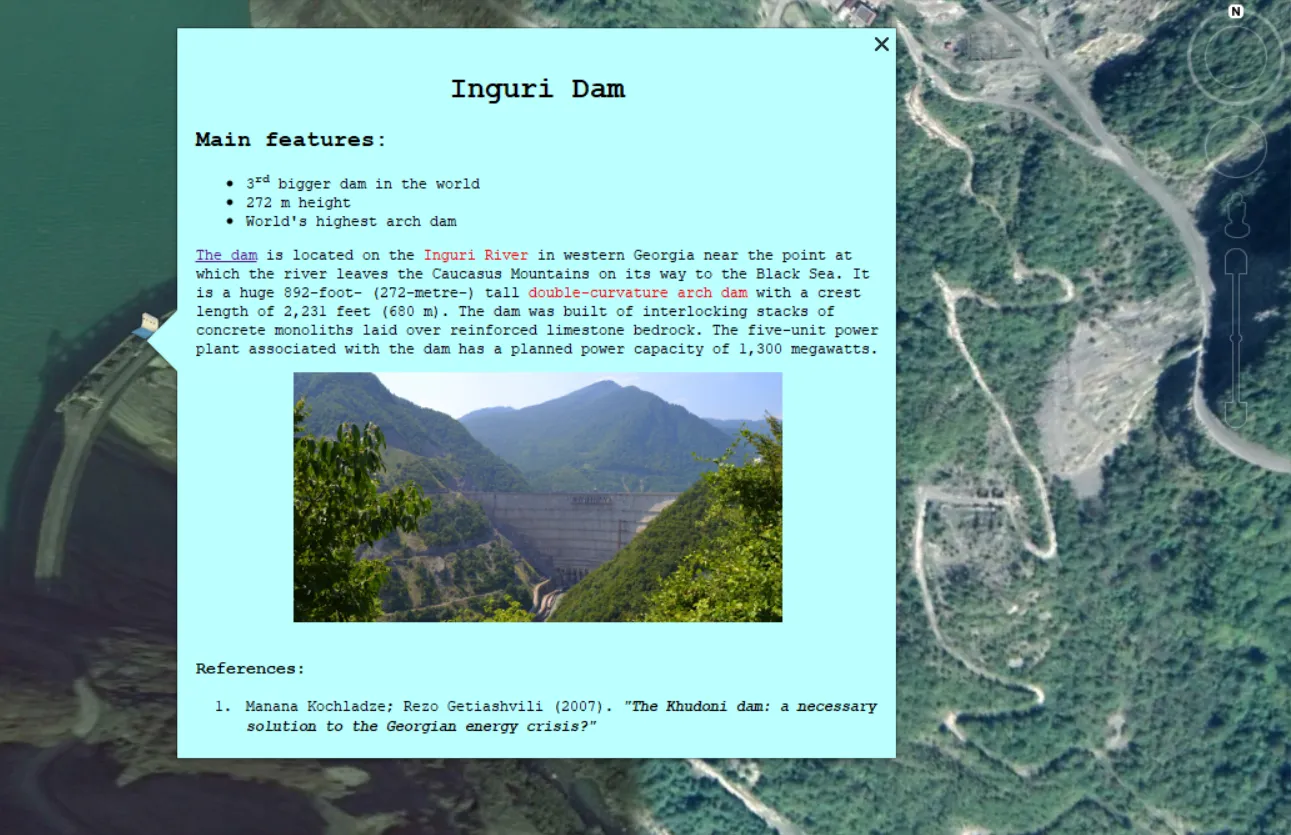
Pic. 31 Basic information about the World’s highest arc dam – Inguri Dam in Georgia.
In the result of this simple balloon style presented above, the colour changed and the font family remained the same for the whole content. This is a basic example of the BalloonStyle edition.
For wider purposes, the BalloonStyle can be used likewise a “Description”, which will make our .kml presence a bit better (Pic. 32-34). We gained another frame with different colours, our Balloon layout, and standard for all places included in this .kml file. Moreover, the “Description” field remains almost empty, which at the same point can be important, about which more underneath.
Pic. 32 Our front-end stuff is placed within the ‘<BalloonStyle>’ code.
Pic. 33 A highlighted ‘<Description>’ field with the most important stuff there.
Pic. 34 Our BalloonStyle placemark in Google Earth.
4. SUMMARY – DESCRIPTION OR BALLOON-STYLE?
So I have shown you 2 ways of content management in .kml files. Both in the ‘<Description>’ and ‘<BalloonStyle>’ you can input wide front-end elements, which should work without the problem in Google Earth software.
The most curious thing at this moment is how it will behave when we take it everywhere i.e. back to some interactive map builder or to Google Maps API. Will we enjoy our work? Or what important thing is to be found regarding these two major XML fields?
Checking the files in Google MyMaps, we can see that most of our work has been lost. However is it the reason to worry about?
Google MyMaps has an interesting option. Each map created there has a “Data Table“, which is something like Excel spreadsheet data composed of 2 basic columns: the name of the placemark and its description.
It means, that we get a simple pack of data, which can be further manipulated.
If we have data including our HTML or JS work, as before. It will look messy, and basically not really useful for the next job with data manipulation. Otherwise, we put everything into ‘<BalloonStyle’> instead, leaving only some important stuff in the description. Let’s compare our 2 jobs below (Pic. 35, 36).
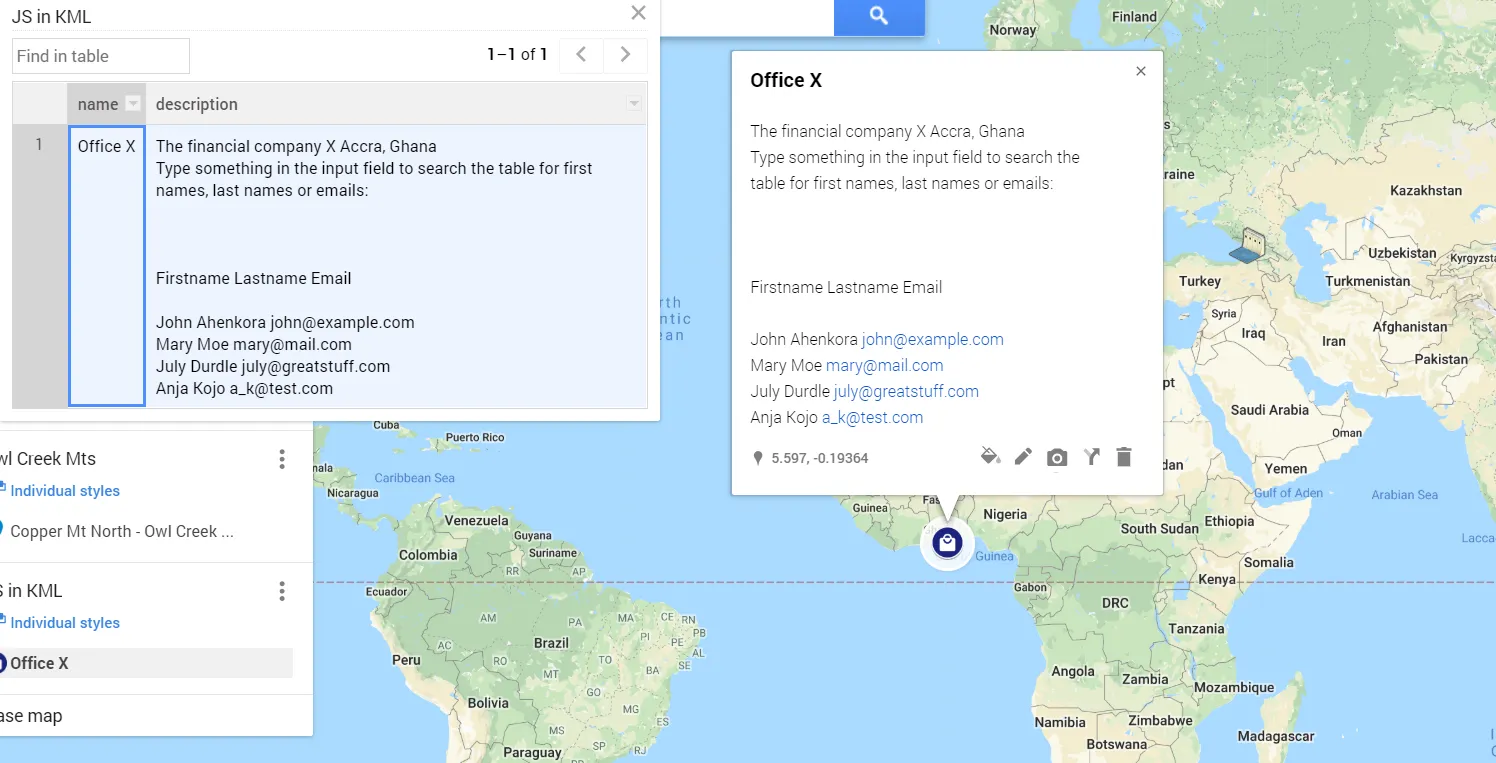
Pic. 35 One of my previous works, where I tested a JavaScript filterable table in Google Earth, unfortunately, doesn’t look as good as the description in Google MyMaps.
Pic. 36 My job was done in the <BalloonStyle>’ section with a piece of basic description information, now seen clearly in Google MyMaps.
As you see above, an HTML or JS edition in the ‘<Description>’ section doesn’t look good in Google MyMaps. The data table looks completely messy and rather not useful for further data manipulation, unlike to lower example, done in the ‘<BalloonStyle>’ section. There basic information included in the ‘<Description>’ looks really fine and easy to work with in the future.
This is an important thing, which we should take into account at the very beginning of our work? Will we use our placemark somewhere else than on Google Earth only?
I am not going to highlight here a particular section as a better one. It doesn’t mean, that inputting our whole stuff into ‘<BalloonStyle>’ is a better idea.
If your file is going to show some description with photos, links, some tables, etc. it will be better to input it into the ‘<Description>’ space.
However don’t bother with interactive map builder now, which is quite poor and may not show your work properly. I prepared my work in GoogleMaps API in order to see the sense of my previous work.
My last example with ‘<BalloonStyle>’ development looks completely different outside of Google Earth (Pic. 37).
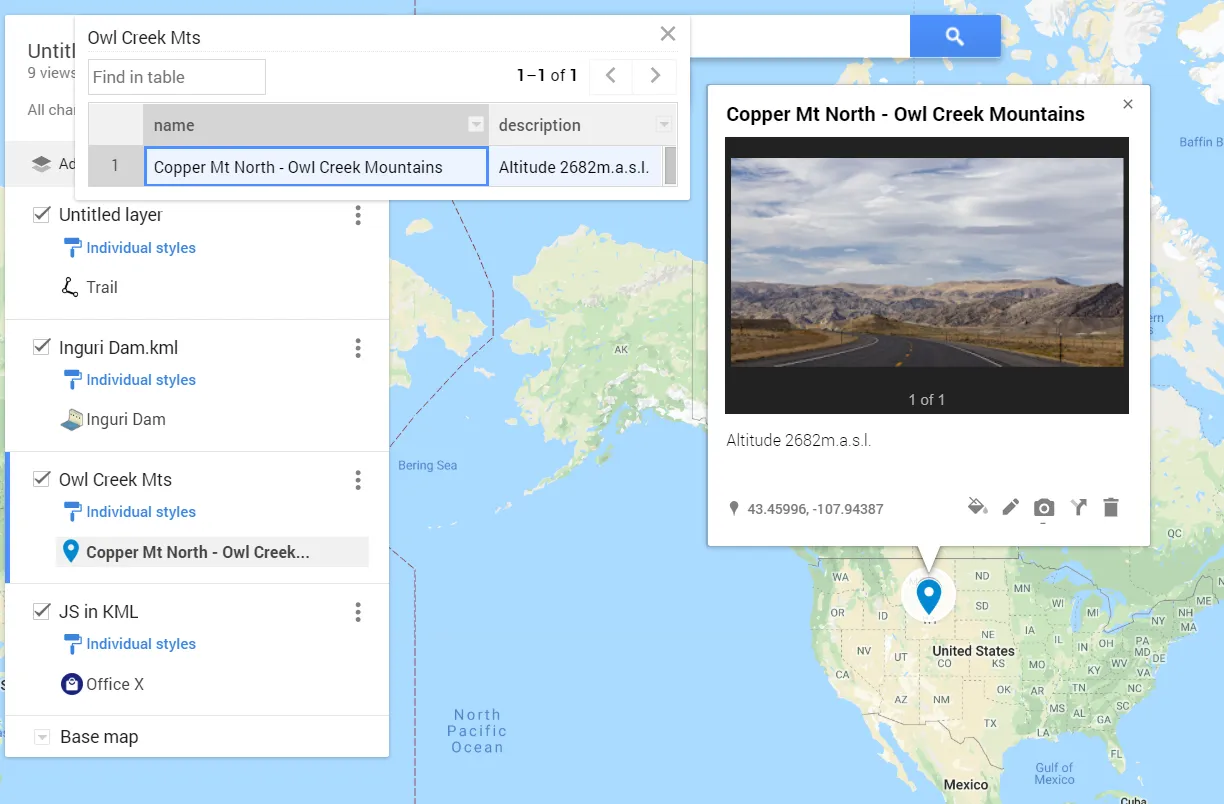
Pic. 37 The ‘<BalloonStyle’> customized placemark in Google Earth loses all details in Google Maps API, apart from description content.
We’ve lost everything, converting our .kml file into Google Maps API.
Let’s try another one below (Pic. 38), developed both in the ‘<BalloonStyle>’ and ‘<Description>’ fields:
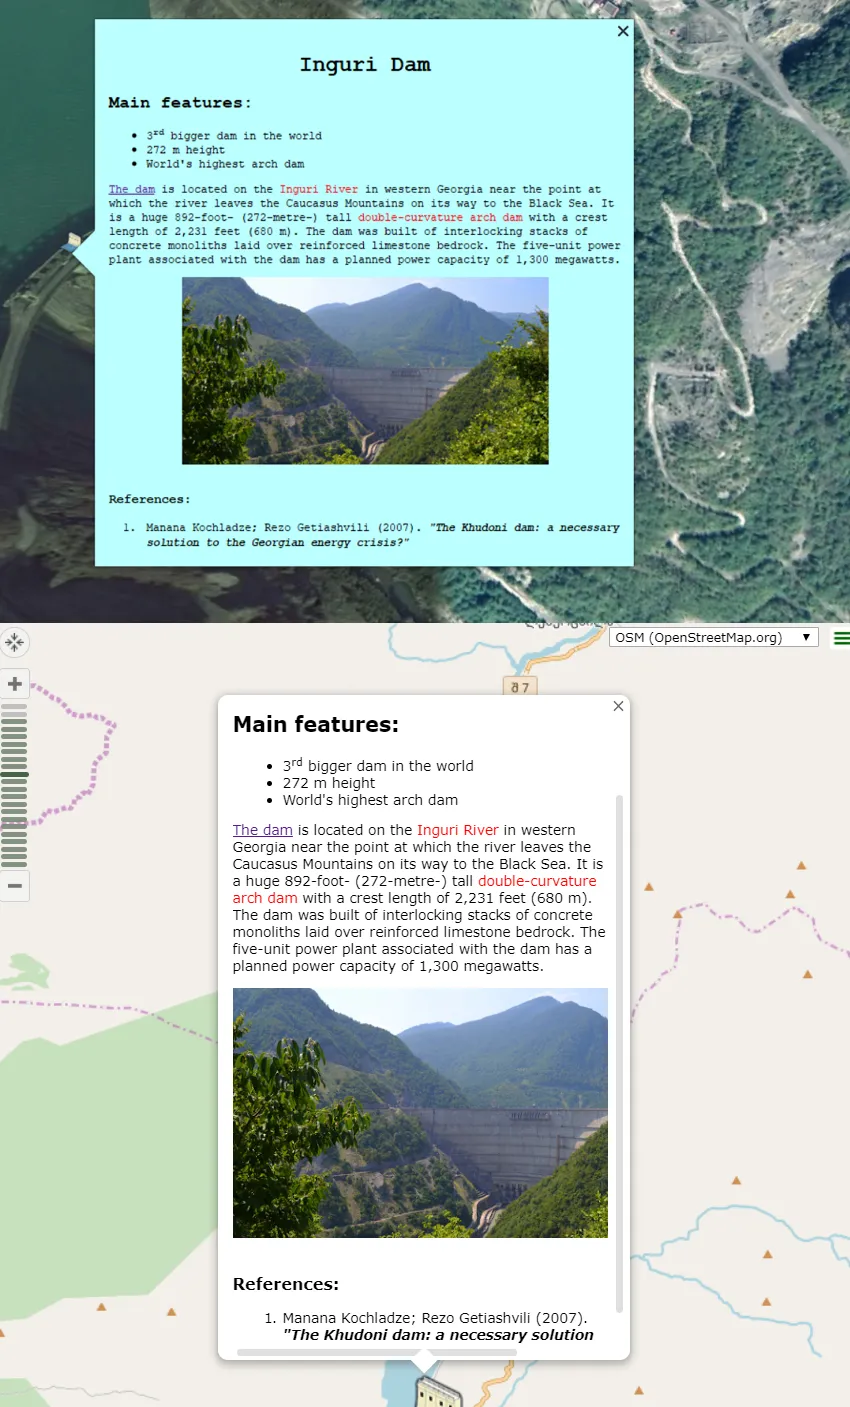
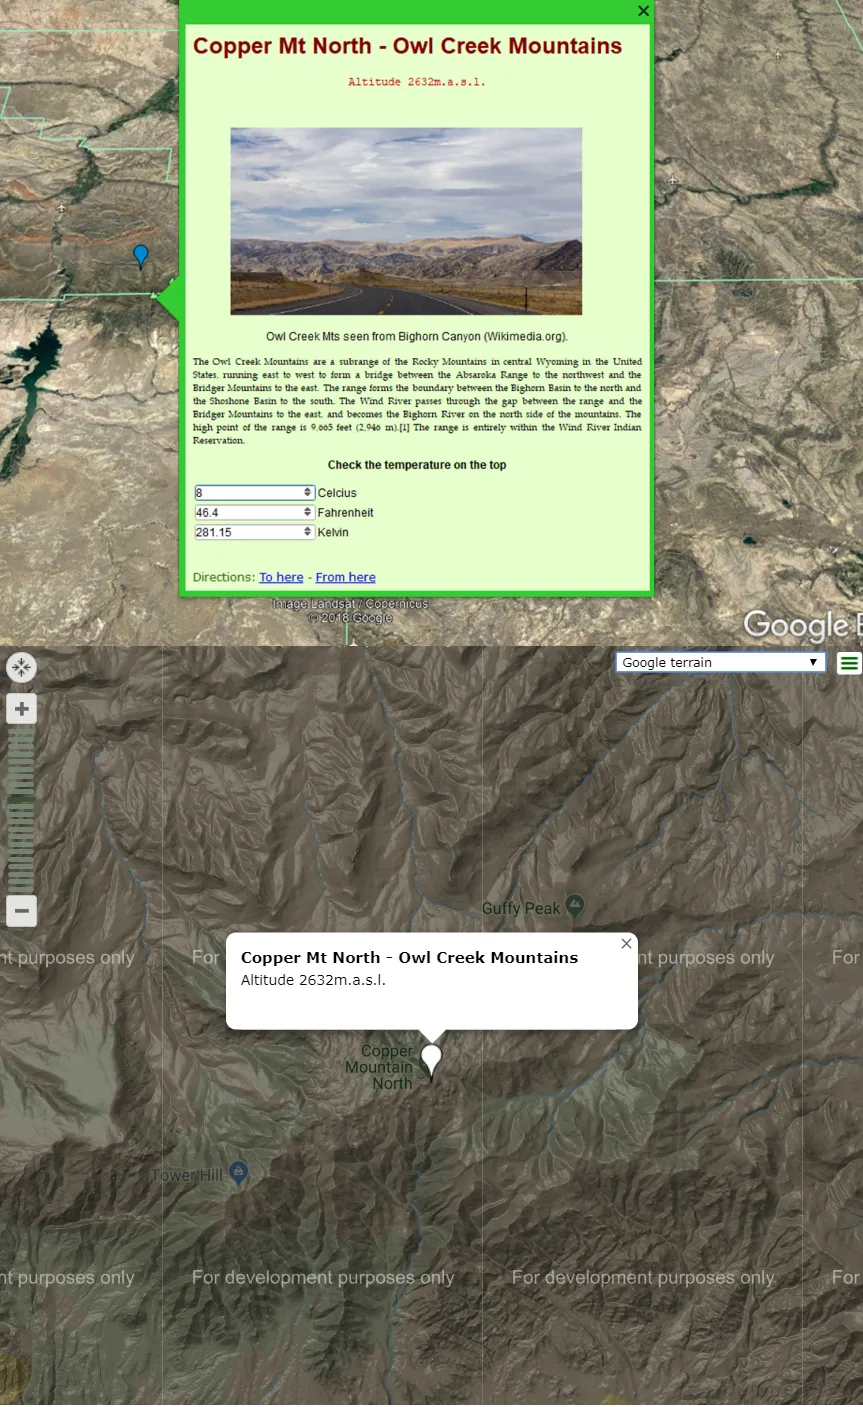
Pic. 38 A comparison of the .kml placemark content developed both in ” and ” between Google Earth and OpenStreetMap API.
The example above looks much better. We haven’t lost the content. We lost only style, set in the ‘<BalloonStyle>’ section. All HTML code with the picture came through.
How about the placemark developed only in the ‘<Description>’ field? Let’s see an example below (Pic. 39). Lack of styling in Google Earth results in a lack of disappointment when our file is taken outside of this software.
Pic. 39 The .kml placemark developed only in the” field keeps all stuff when converted into OpenStreetMap API.
In the example above we can see, that all HTML along with CSS layout came through, which is good for us. Unfortunately, CSS is not supported as well as HTML does. It can be seen especially when setting some background colour in XML, which cannot be displayed in the API version.
JavaScript also doesn’t work in Google Maps API (Pic. 40).
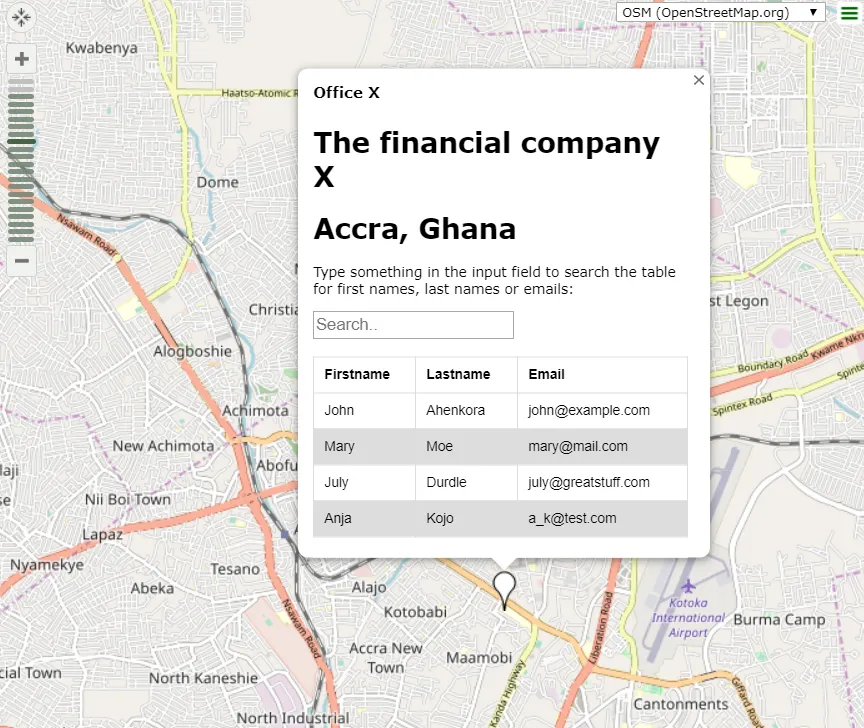
Pic. 40 A .kml file with the filterable table in JavaScript, which doesn’t work in OpenStreetMap API, leaving an untouched HTML table with CSS elements.
However, in our job, both the HTML and CSS code is displayed.
To sum up this issue it’s up to you, where you want to place your placemark content, however, it will result in its further appearance in external places. If I would advise you something, then if you want to have your ‘<Description>’ data sorted for further manipulation such as Google Sheets, SQL, etc. then is much better to do your work in the ‘<BalloonStyle>’ field. On the other hand, if you want to show some content externally, apart from Google Earth, then will be better to develop it within the ‘<Description>’ field.
Mariusz Krukar
Links:
- KML Reference – description
- KML tutorial
- KML adding custom data
- KML styling and live data feeds
- Geoserver.org: KML styling
- How to convert to KML and style without loosing your mind?
- Customizing the waypoints in KML files
- W3Schools colour picker
- Announcing deprecation of Google Earth API
- KML Touring
- KML Balloon style example
- CSV to KML conversion
- Google Earth World time zones – Javascript in KML
Forums: