The starry night is a nice view for everyone I guess quite often we like to lie on the ground and gaze at the sky full of stars. In the whole Milky Way, we have about 100K stars, whereas only 7K can be visible by the naked eye under the pristine night sky, completely free of light pollution. I am heading to describe to you 50 of the brightest stars, which can be easily spotted even in intensively illuminated urban areas. However, this description cannot be progressed without the basic knowledge about the brightness of the stars and what elements rule them. I hope to expand this topic in the future because the subject of stars will be back here at least several times and some piece of knowledge compacted in the separate articles is essential. For now, my goal is to run you through the most basic information about the stars.
I. A FEW WORDS ABOUT THE HERTZSPRUNG-RUSSEL DIAGRAM
The Hertzsprung-Russel Diagram (known also as the H-R Diagram) is a scatter plot of stars, which displays the relationship between the star’s absolute magnitudes or luminosities and their classification based mostly on the surface temperatures. The H-R Diagram comprises regions with different types of stars with respect to their types and evolutionary stages. Most of the stars occupy the middle region of the diagram along the main-sequence line. The main-sequence line is a continuous and distinctive band of stars whose variation is based on their color (temperature) versus brightness. All these stars represent their “adult” period of the lifecycle, where the hydrogen is fused in their cores. The lower region of the main sequence is more crowded than the upper region. At the lower end, the stars are red in color (due to their low temperature) and small in size. They’re called therefore as the red dwarfs. The red dwarf is the most common type of star in the Milky Way, at least in the vicinity of the Sun.
At the bottom end of the H-R diagram, we can see the brown dwarfs. Brown dwarfs are substellar objects, that are not massive enough to sustain nuclear fusion. Their mass straddle somewhere between the most massive giant planets and red stars. It can correspond to between 13-80 masses of Jupiter on average.
The bottom left part of the H-R diagram is represented by white dwarfs – the stellar core remnants, which no longer undergo fusion reaction. They are very hot when formed, but because they have no source of energy they gradually cool and radiate their energy away. In general, the white dwarfs are about 10 magnitudes fainter than the main sequence stars of the same spectral class and so must have a very small surface area and radius (Bhatia, 2001).
Between the white dwarfs and the main sequence, we can find subdwarfs. Subdwarfs are classified as stars with a magnitude 1.5 – 2 lower than stars from the main sequence at the same spectral type. We can distinguish cool subdwarfs, hot subdwarfs, and heavy metal subdwarfs.
Moving on the other side of the main sequence we can list the giant stars. The smallest in this region are subgiants, which represent the same type of star from the main sequence which is simply older. The subgiants can be treated as the former main-sequence stars. It means, that they have the same mass as their main-sequence counterparts, but their chemical composition includes more helium than hydrogen. Going up we have giant stars, which are substantially larger and brighter than stars in the main sequence. The typical giant stars are 10-100x larger than the Sun and 10-1000x more luminous than the Sun (Moore, 2002).
Between ordinary giants and supergiants, we have the bright (blue) giants. This type of star is at the finish of burning its hydrogen yet before it has started burning helium. The blue color and high temperature are the effects of the intensive burn of the remaining hydrogen. This process will last shortly until the star starts to burn helium and become the red giant.
Red giants represent the late stage of stellar evolution, where the star burns helium. The atmosphere of the red giant is inflated and tenuous with a quite low surface temperature, giving the star a reddish appearance. The essence of the red giant has been explained later in this article.
Supergiants are brighter by giants by about 5 magnitudes and have about 100 solar radii (Bathia, 2001). Their mass exceeds between 8-12x solar mass. The supergiants mark the advanced evolutionary stage of the star, which starts to burn helium into carbon and oxygen. That heats the interior of the star and causes its exteriors to swell, which is typical before the star dies. The star at this stage can become the red supergiant or blue supergiant if other elements in its core are fused. The blue color of supergiant is an effect of a significant size drop from hundreds of solar radii to around 25 solar radii. The biggest and very rare type of star is hypergiant. The hypergiants are the most massive stars in the universe and the most massive stars ever measured. They are significantly brighter than supergiants. They can be divided into blue, yellow, and red hypergiants. They live only a few million years.
The last interesting element, which can be noticed in the H-R diagram is the empty region, which is called the Hertzsprung gap. The primary feature of this region is the absence of stars, which is driven by rapid star evolution. This region covers the early evolutionary period when the hydrogen is being burnt in a shell around the core of helium before the onset of helium burning. The stars during their evolution move rapidly through the Hertzsprung gap compared to their whole lifetime. This stage can last as little as a few thousand years.
Thanks to the H-R diagram scientists can roughly determine the distance of a given star cluster or galaxy from Earth. This can be done by comparing the apparent magnitude of the stars in the cluster to the absolute magnitudes of stars with known distances. The H-R diagram is one of the most useful tools for the study of stars and their physical properties (Bhatia, 2001).

II. HOW TO READ THE CLASSIFICATION OF STELLAR SPECTRA
The Hertzspung-Russel diagram can bring also general information about the stellar spectra. By knowing them we can identify a particular star by its properties. It’s not the issue fully related to the brightness, but the luminosity matter is one of the components on which the stellar classification is based.
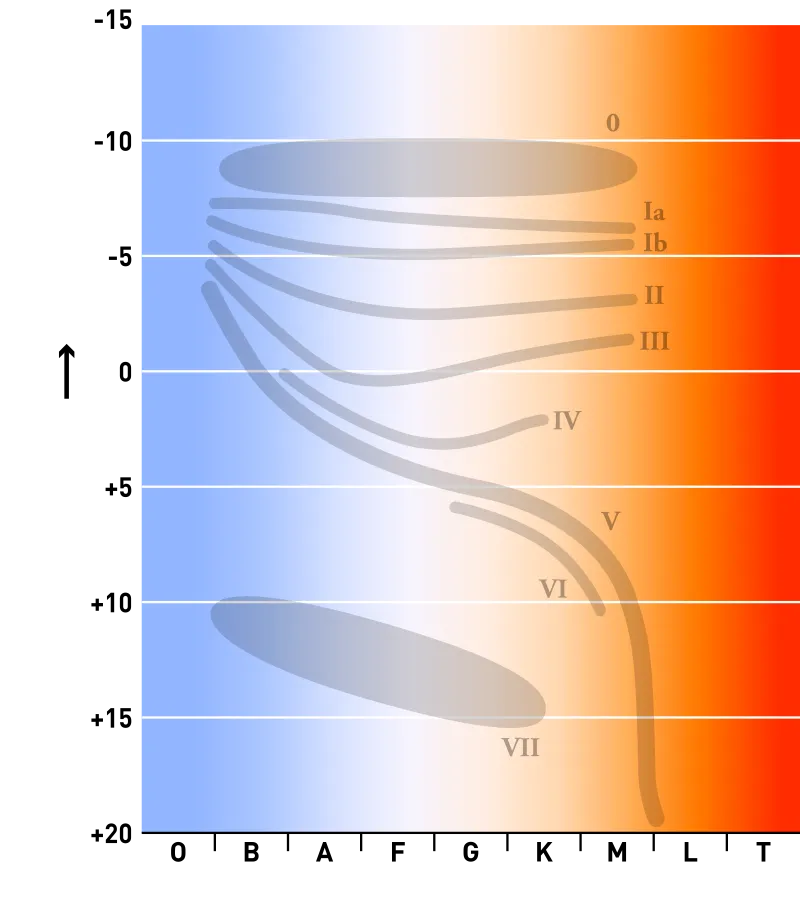
By watching the pattern above (Pic. 2) we can get some basic star type identifications, which more about you can find below.
I think the best way of reading the stellar spectra will be by following this link, where most of the things have been explained transparently. Many thanks to the authors by the way.
Concluding, the stellar spectra can be divided by:
-> Standard stellar types (discussed above), where we have the following types of stars (Pic. 3).

Each type is divided between 0 and 9 (10 subclasses), where 0 means the hottest and 9 is the coolest. If, for instance, the surface temperature range at the given class ranges between 11000 and 25000K, we can put the subclasses range into an assumption, defining their temperature range as 10x smaller than for the main class. Subclass B0 should correspond to a temperature range between 23600K and 25000K then. Subclass B9 should indicate the surface temperature between 11000K and 12400K and so forth. Sometimes, we can find even the decimals of these subclasses like B9.5. In this case, the temperature of the star should be roughly indicated and for this particular subclass, it can be 11000K.
We need to remember, that not only surface temperature is a subject of these subclasses. The most important is the color, which all details have been clearly presented in this link. A star’s spectral class is essentially its color. This color depends primarily on the photosphere temperature of the star and secondarily the chemical components present within the star. Hence mostly temperature is concerned in this section as the major feature. I have explained it in detail later in this article.
-> Luminosity classes (Yerkes classification) – where six luminosity classes were used from Ia to V (Pic. 4).
->Peculiarities – revealing many other things about the stars through the lowercase letter at the end of the characteristic, which indicates some particular abnormality i.e. in chemical composition (Pic. 5).

I could add also:
f – which can indicate the spectrum having emission lines for ionized Helium and Nitrogen.
Mn – the overabundance of Manganese
Hg – the overabundance of Mercury
In order to better understand the spectral classification of the stars let’s put our effort into practice.
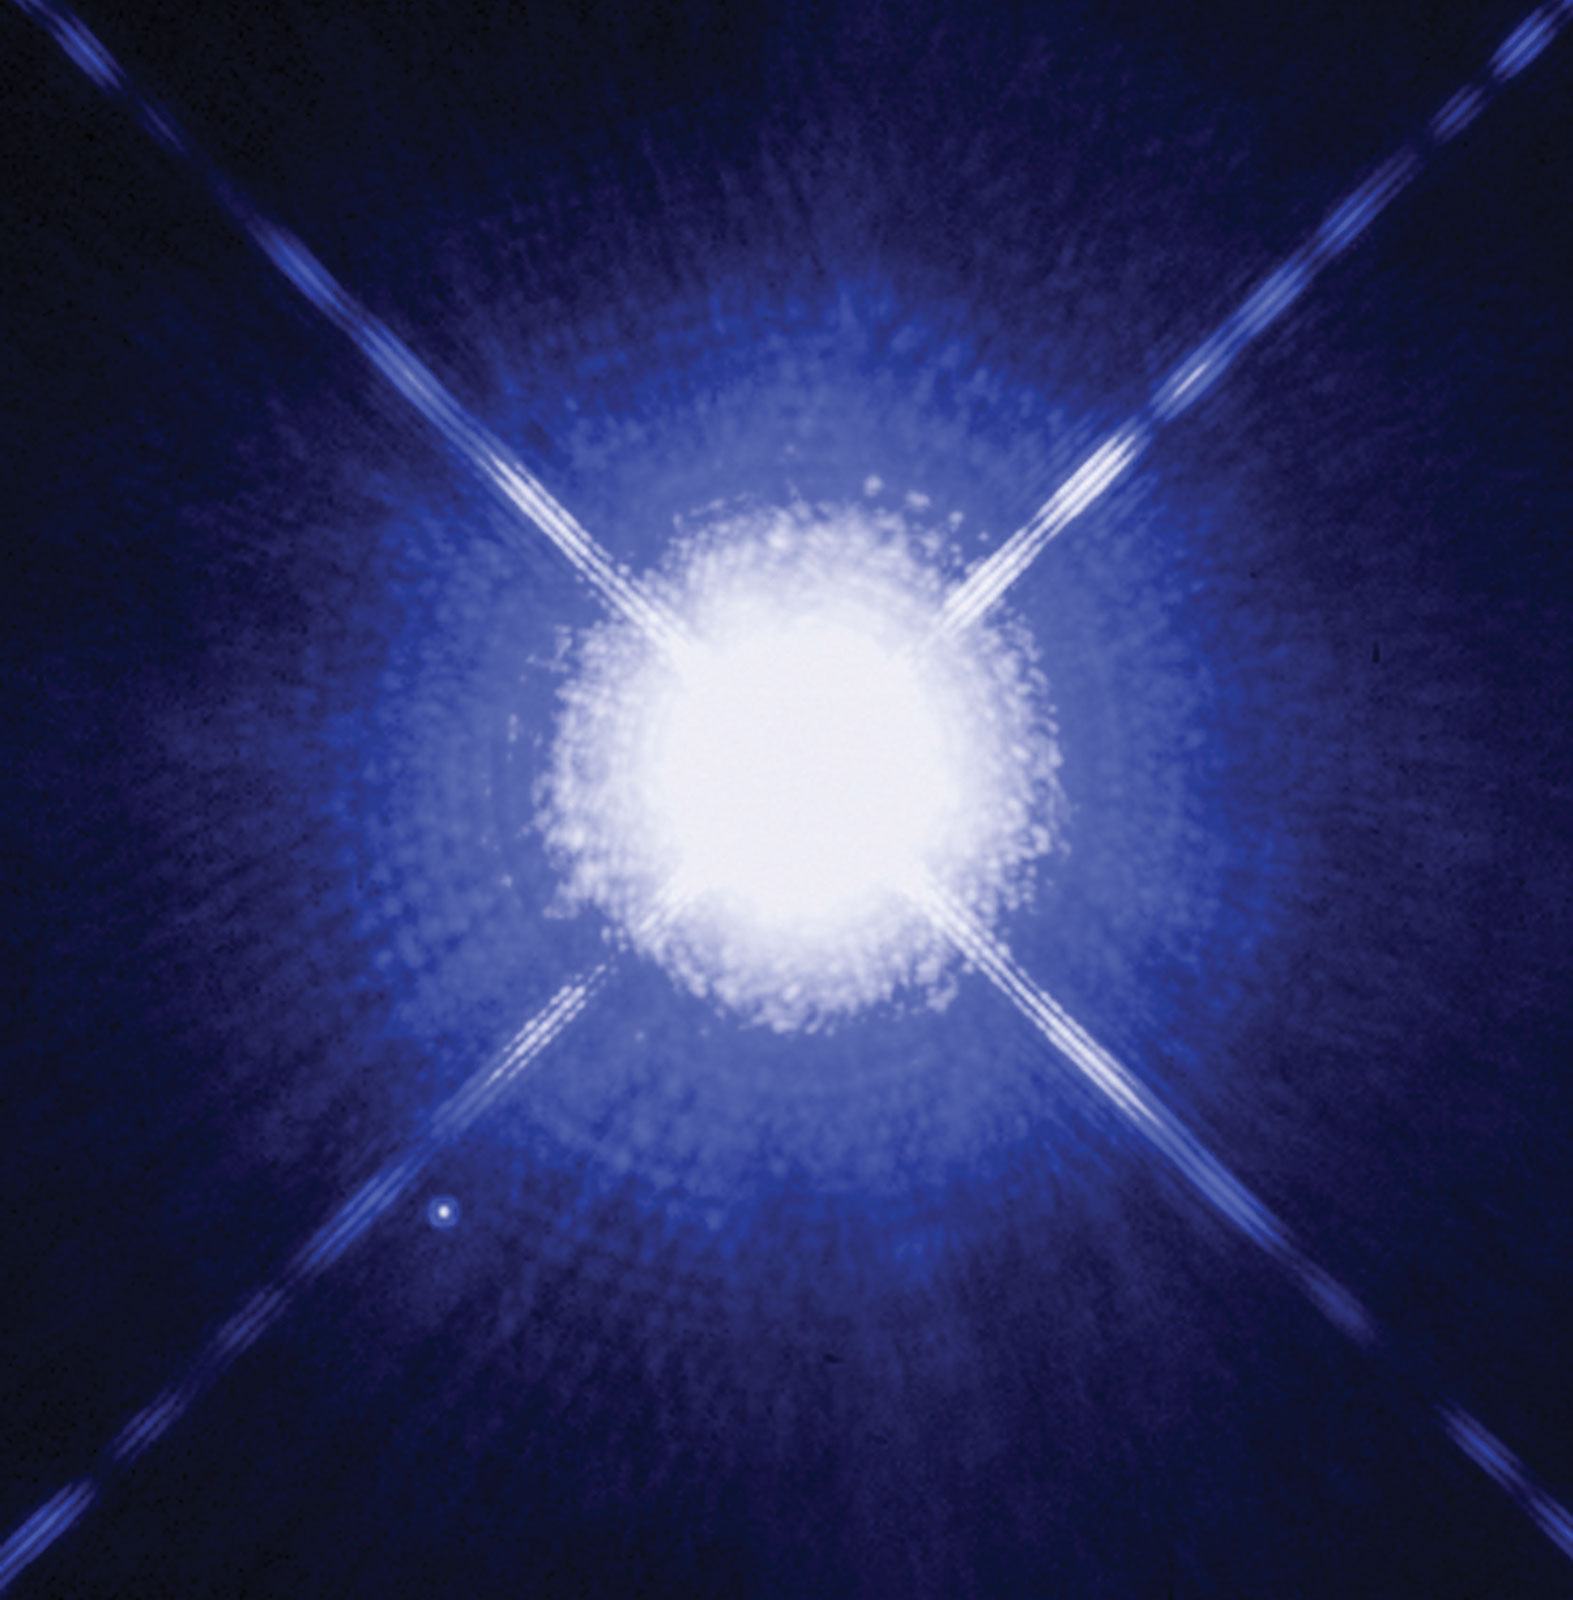
Sirius (α Canis Majoris) star has the classification of A1V – which means, that this is a blue star with a surface temperature of around 10500K and belongs to the main sequence stars.
Algol (β Persei) star has been classified as B8V – it means, that this is a hot blue star with a temperature of about 12000K and also belongs to the main sequence stars.
Other examples:
Mintaka (δ Orionis) – O9.5II – the star with a photosphere temperature of 25000K shining blue and belonging to luminous giants
Zosma (δ Leo) – A5IV – blue subgiant star, which has a surface temperature of 9300K.
Menkent (θ Cen) – K0 III – orange normal giant star with temperature of 5000K.
Avior (ε Car) – K3 III, B2 Vp – binary star, where the primary component is the normal red giant star with an estimated temperature of 4400K and the secondary component is the blue ain-sequence star with a temperature of about 22000K and unspecified peculiarity.
Naos (ζ Puppis) – O4 If(n)p – the very hot and blue star with a temperature exceeding 25000K (about 40000K or even 50000K as displayed in this link). The star is massive with the emission of ionized Helium and Nitrogen. Due to fast rotation, the star can be characterized also by broadened absorption lines caused by rapid spinning around. Naos can boost also other peculiarities, which can be i.e. abnormal presence of metal.
Alpheratz (α Andromedae) – B8 IVpMnHg, A3 V – the first component is the blue subgiant star with a temperature of about 13000K, which features some general peculiarities as well as an excess of Manganese and Mercury in its chemical composition. The second star in this system is the blue main-sequence star with a surface temperature of around 9600-9700K.
III. WHAT DETERMINES THE BRIGHTNESS OF THE STAR?
Watching the sky, we often ask ourselves – why some stars are brighter than others? By the naked eye, we can see up to 7000 stars in areas free of light pollution. In the next article, I would like to mention about just only 50 stars, the brightest ones. If you are a little green at astronomy, you might think that the brightest stars are also the biggest or the closest. Partially you will be right, but we should take into account also other factors. The crucial factors determining the brightness of the star are:
- Spectral characteristic (temperature of the photosphere) – which is based on the Star’s electromagnetic radiation. The light from the star is analyzed by splitting it with a prism or diffraction grating into a spectrum likewise visible in the rainbow. Each element indicates a particular chemical element or molecule with the line strength indicating the abundance of that element. They vary predominantly due to the temperature of the photosphere. Most stars are classified under the Morgan – Keenan (MK) system with the letters following the photosphere temperature from hot to cool: O, B, A, F, G, K, M. To be funny – it’s a good mnemonic for this sequence: “Oh Be A Fine Girl [or Guy], Kiss Me.” Each letter class is subdivided using numeric digits from 0 to 9, where 0 means hot and 9 means cool. Furthermore, additional letters have been used for describing novas, dwarfs, or carbon stars. It’s also another – Yerkes classification based on temperature and luminosity, which classifies the stars under Roman numbers, but the Morgan – Keenan (MK) classification remains commonly in use. The details of both classifications have been explained in a separate section earlier.
By knowing the color of the star we can estimate its surface temperature. The surface temperature determines the star’s brightness, which explains the Stefan-Boltzmann law. It says, that hotter stars emit more radiation per unit surface than cooler stars. If the reddish and bluish stars have the same luminosity, then the reddish star must be larger than the bluish star because the reddish star must have more surface area than the bluish star to produce the same luminosity, the Stefan-Boltzmann law says so. The law considers the effective temperature, which corresponds to the temperature of a black body with the same luminosity per surface area. The dependence of the star colors on the temperature explains also Wien’s displacement law, which states, that for higher temperatures the wavelength of thermal radiation is shorter. The star colors are the output of three electromagnetic wavelengths, and each of them represents the major chemical component building the star. The combination of these three wavelengths is referred to as the Plank’scurve.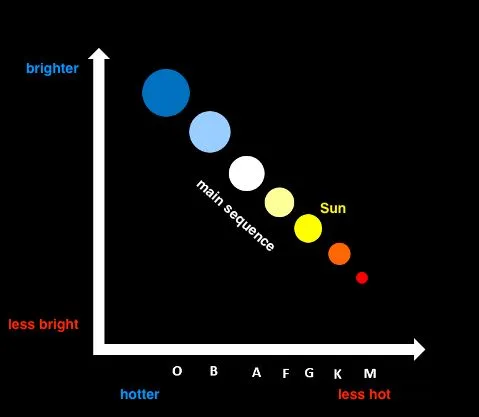
Pic. 4 Simplified H-R diagrams including the stars only from the main sequence. It shows clear evidence between size, temperature, and brightness (Borja Tosar/Bbvaopenmind.com.) - Mass – there is a strong relationship between the star’s mass and its luminosity, which can be described by the following formula: L = (M)3+β, where L is the luminosity of a star in the main sequence and M the star’s mass given in the solar units. It means that if the star’s mass is doubled by 2, the luminosity increases by a factor of 2 3.5 = 11 times. This relationship arises out of determining the size, radius, and temperature of the star and it’s called the mass-luminosity relation. In a practical sense, it’s the correlation between the mass of a star and the rate at which it emits (and therefore produces) the energy (Duric, 2004). The star masses vary across the main HR sequence. The lowest-mass main sequence stars have about 0.07 of the solar mass, and the most massive stars commonly encountered have about 60 solar masses (Kutner, 2003).
- The evolutionary stage – is somewhat an output of the major star properties like mass, size, temperature, or spectral type. All these factors combined together place stars in their evolutionary sequence. The same as spectral characteristics and mass, the evolutionary stage is an element of star classification in the Hertzsprung-Russel diagram (Pic. 5).
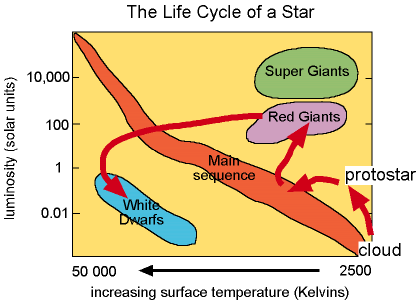
Pic. 5 The general life cycle of stars is depicted on the HR diagram (Gdn.glos.ac.uk). The brightness of the star at its certain evolutionary stage is shaped by its mass and composition. Since the star reaches the main-sequence stage, the lifecycle is based on the fusion of hydrogen to helium, which accumulates in the star’s core eventually. The percentage of helium, which is thought to be like “ash” from nuclear “burning” of hydrogen increases. As the helium accumulates in the center of the star, the temperature and density in the inner regions slightly increase. By increment of the temperature, the level of fusion goes up, thereby the rate at which energy is being generated also rises, which leads to gradual boosting of luminosity. As long as the star’s evolutionary stage remains in the main-sequence band these changes are minor. Everything changes when there is no more hydrogen for fusion reactions. Helium requires a much higher temperature for fusion, which is impossible. In turn, gravity takes over and the core begins to contract. The energy of inward-falling material is converted to heat, which is generated this way and flows outward to cooler regions, which now expand. The star grows to enormous proportions, whereas the temperature of its outer layers drops simultaneously shifting the star’s overall color towards red. This is the moment, at which the star is more luminous and cooler. The red giant stage indicates also the higher brightness of the star in its lifecycle.
- Chemical composition – as it has been told just previously, the chemical composition changes throughout the star’s lifecycle. In turn, it impacts its brightness slightly as per the evolutionary stage. Looking at it from a different point of view, the chemical composition is the element, which helps to distinguish the types of stars. It refers mostly to the proportion of heavy elements against hydrogen and helium. Since the average atmosphere of the star consists mostly of hydrogen (87%) and helium (10%), the remaining 3% are heavy elements, which include carbon, sodium, silicon, iron, calcium, lithium, and magnesium. The star’s brightness is shaped mostly by the first two chemical elements, although when the star becomes older, the other chemical elements remain more visible through the emission of a particular wavelength. The relation between the chemical composition and temperature and therefore brightness is based on atom movement. As temperature increases the electrons are kicked up to higher levels by collision with other atoms. Large atoms have more kinetic energy, so their electrons are excited first, followed by lower-mass atoms. At high temperatures, the collision is strong enough for atom ionization. In practice, low-temperature stars will feature an abundance of heavy atoms like calcium or magnesium contrary to high-temperature stars, where lighter atoms (like hydrogen) prevail.
- Size – can be gained by star radius measurement. Assuming, that two stars with the same surface temperature have a different radius, the star with a bigger radius will be brighter. The difference in the luminosity is proportional to the square of the size. The calculation here is really straightforward, and looks as below:
L – luminosity, R – radius
L = R2
L = 52 = 5 x 5 = 25
So according to the formula above, the star with a 5x bigger radius will be 25x brighter. - Distance – there is a simple relation between the brightness of the star and the distance to it. The brightness decreases proportionally to the square of the distance as one moves away from the star. It’s explained by the inverse square law.
- Behaviour – it refers to any kind of variable star, in which brightness, as seen from Earth, fluctuates. These brightness fluctuations might be driven by periodical swelling and shrinking of the star or by a simple change in the amount of light reaching Earth. The first case – intrinsic variable stars, refers to pulsating variable stars, cepheids, or long-period variable stars. The last ones are characterized by fairly regular light fluctuations and require many months or several years to complete the cycle. They can change even a hundredfold in brightness.
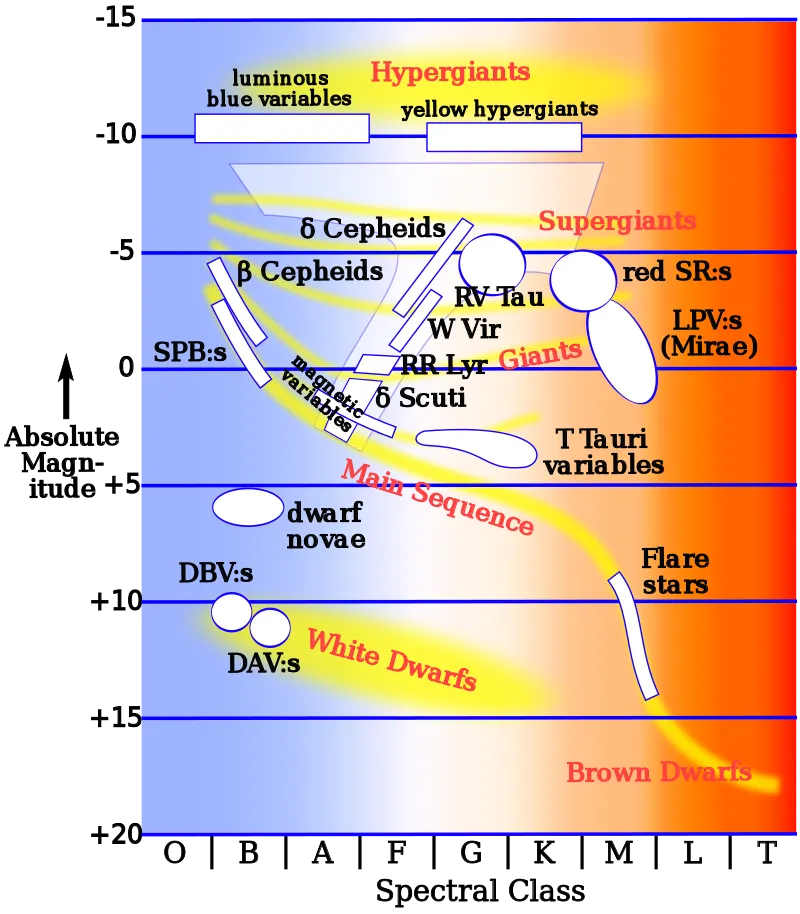
Pic. 6 Intrinsic variable star types in the Hertzsprung – Russel Diagram (Wikimedia.org). The second group of variable stars – extrinsic variable stars is featured by changing the amount of light reaching Earth. As it has been told earlier, it can be caused by the following:
-> rotation of the star – it applies to the stars with sizeable sunspots, which may show a significant variation of brightness as they rotate,
-> eclipsing binaries – if we face the binary system of stars, then for the terrestrial observer, watching them from a certain angle, one star may eclipse another one resulting reduction in brightness.
-> planetary transits – can also cause variations in brightness, although they are much smaller and can be detected by extremely accurate observations. - Lifespan – is strongly related to the star mass. Generally, the more massive a star is, the faster its fuel supply depletes, which translates into a shorter lifecycle. The reason behind it is, that as the star is heavier, the greater gravitational force makes it contract. Therefore bigger internal pressure is needed to stop that contraction. It results in a hotter core by the increment of the nuclear reaction. The high rate of nuclear reaction decreases the lifespan of a star. As the star burns its fuel out much faster, it’s more luminous. By knowing the luminosity of a star we can determine how rapidly the star is using up its fuel supply. Thereby the lifetime of the star is proportional to the mass of fuel available divided by the luminosity. It’s associated with the mass-luminosity relationship explained above.
From a practical point of view, more massive stars feature shorter lifecycles but are brighter.
III. HOW THE BRIGHTNESS OF THE STAR CAN BE MEASURED?
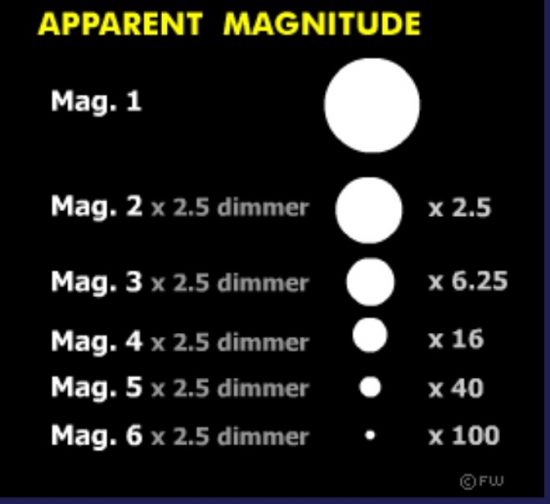
The basic unit, which measures the brightness of the star (or other celestial body) is a magnitude. The magnitude is the logarithmic-based scale, which appears to work in reverse. The dimmer object appears the higher the numerical value is given to its magnitude. This is because the initial scale system was designed like this. In the Hipparchus times, the brightness of the celestial objects was estimated by the eye and then split into 6 categories, where the 1st magnitude was meaning the brightest object and the 6th magnitude the faintest one. As humans developed proper instruments to make the brightness measurements more detailed, astronomers decided to expand this scale. In turn, the magnitude scale remained intact to this day. Its basis is still the same as it was in ancient times – the brighter the object, the lower the number assigned as a magnitude.
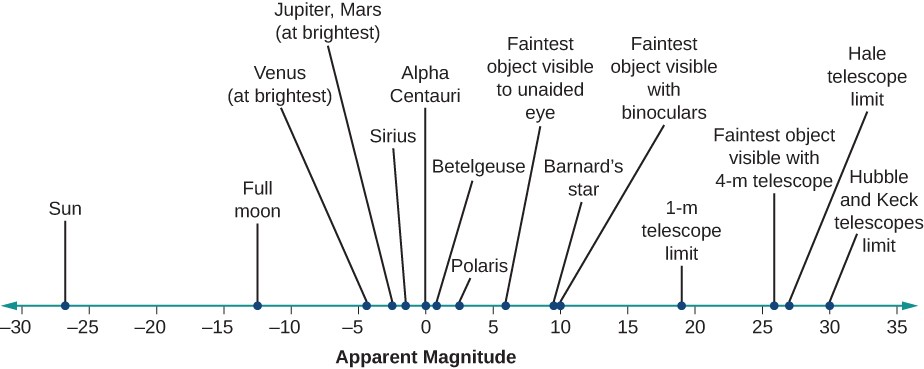
There are two types of magnitude, which can define the star’s brightness. This is the apparent magnitude and absolute magnitude. Firstly we will discuss the apparent magnitude, on which the very first star’s brightness classification was based. Apparent magnitude defines the brightness of an object as it appears in the night sky. As of 1850, the magnitude scale is defined much more precisely than just eyeball judgment. The scale was expanded down to 30th magnitude (Inglis, 2007) for the least bright celestial objects, which are about 2,5 billion times dimmer than the faintest objects visible by the naked eye (Schaaf, 2008). The scale was also expanded up to the Sun, which is blindingly bright and 1.6 trillion times brighter than the faintest star we can see by unaided eye (Schaaf, 2008) It was also noticed, that the brightest stars at 1st magnitude were around 100x brighter than 6th magnitude stars, and conversely, the 6th magnitude star is 100x dimer than 1st magnitude star. It led to the split of this scale logarithmically, where five magnitude steps corresponded precisely to a factor of 100 in brightness (Tassoul, 2004). In practice, the gap between each magnitude is equal to the fifth root of 100, which corresponds closely to 2.5118864 exactly (Schaaf, 2008). This is the Pogson ratio.
The final formula for the apparent magnitude is:  where:
m – magnitude (mref – reference magnitude)
I – brightness (Iref – reference brightness)
By using this formula we can attend to practical measurements of brightness instead of simple classification.
1m: brightness factor of 2.512
2m: brightness factor of 2.512 x 2.512 = 6.31
3m: brightness factor of 2.512 x 2.512 x 2.512 = 15.84
4m: brightness factor of 2.512 x 2.512 x 2.512 x 2.512 = 39.81
5m: brightness factor of 2.512 x 2.512 x 2.512 x 2.512 x 2.512 = 100
10m = 100 x 100 = brightness factor of 10,000 times
15m = 100 x 100 x 100 = brightness factor of 1,000,000 times
20m = 100 x 100 x 100 x 100 = brightness factor of 100,000,000 times

The apparent magnitude can be measured by three common methods:
-> photoelectric photometer – is the most efficient method, because the instrument measures the intensity of light it receives. Moreover, it should be calibrated to the brightness of the Vega star, whose apparent magnitude is close to 0. The measurement can be based on differential photometry, where the brightness of at least 2 stars is measured, and absolute photometry, which is based on the instrument calibration, as mentioned above.
-> long-exposure photography – this kind of photography is nonlinear itself, although in digital cameras we can know the brightness number of each pixel. This number will be proportional to the number of photons falling onto that pixel during the exposure.
-> human eye – is the least efficient method, which is based only on the visual comparison between the stars of known brightness and stars of unknown brightness. Some experienced astronomers can make a comparison such as this with 10% accuracy.
Another way of defining the brightness of the stars is absolute magnitude. The basic difference between these two types of magnitude is the distance, from which the star is seen. Since the apparent magnitude defines the star’s brightness as seen from Earth, the absolute magnitude measures its brightness from a certain distance. This distance is roughly 10 parsecs, which corresponds to about 32.6 light-years.
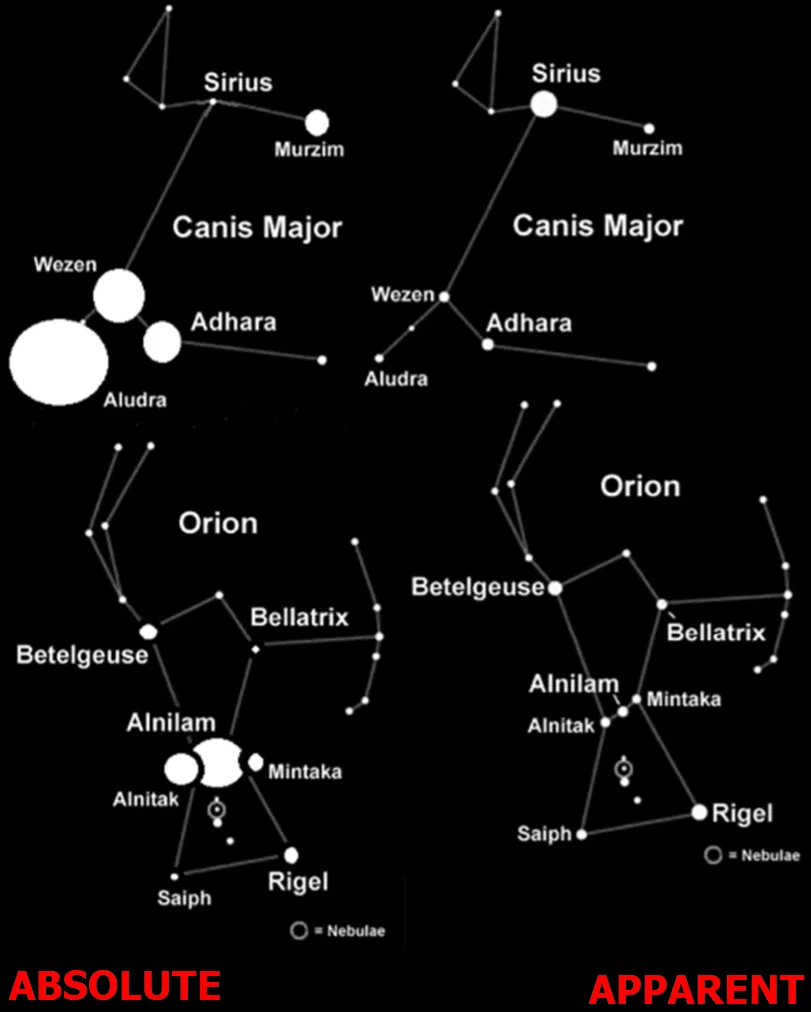
Moreover, the value of absolute magnitude is assumed to be free of extinction of the starlight caused by cosmic dust and interstellar matter. The absolute magnitude can be expressed by the following formula:
where:
m – apparent magnitude
M – absolute magnitude
d – distance to the star measured in parsecs (pc)
The value of absolute magnitude allows scientists to compare the intrinsic brightness of stars.
If we know both the apparent magnitude and absolute magnitude of the given star, we can easily calculate the distance to this star.
The basic limitation of the absolute magnitude is the determination of the light wavelength for measurements and the sensitivity of the instrument used for these measurements, which is different for various wavelengths of light due to the type of light detector. That’s why we should mention the bolometric magnitude, which measures the total radiation of the star emitted across all wavelengths of the electromagnetic spectrum. The basic difference between monochromatic and bolometric magnitude states the spectrum of light measurement. Monochromatic magnitude measures a very narrow segment of the spectrum, which is the visual band of the spectrum. In turn, the bolometric magnitude measurements include a star’s entire radiation, including also the bands unobservable due to instrumental passbands and extinction by Earth’s atmosphere and interstellar dust. In the star brightness measurements, we can use the bolometric correction, which must be made to the absolute magnitude of an object in order to convert an object’s visible magnitude to its bolometric magnitude.
IV. RELATION BETWEEN BRIGHTNESS AND LUMINOSITY
Luminosity is the rate at which the star radiates energy into space. Otherworldly is the total power output of the star and another celestial object. The relationship between a star’s brightness and luminosity can be explained by the inverse square law. It can be expressed by the following formula:
where:
b – apparent brightness of the star,
d – the distance to the star,
L – the luminosity of the star,
Luminosity doesn’t depend on the distance to the star. It states roughly how “bright” the star is, and it’s expressed in Watt units. Luminosity can be measured by the amount of flux radiation hitting the Earth and the distance to the star. The flux is energy per unit area, which can be measured i.e. by a detector attached to the telescope. Thereby we can get the distance to the star.
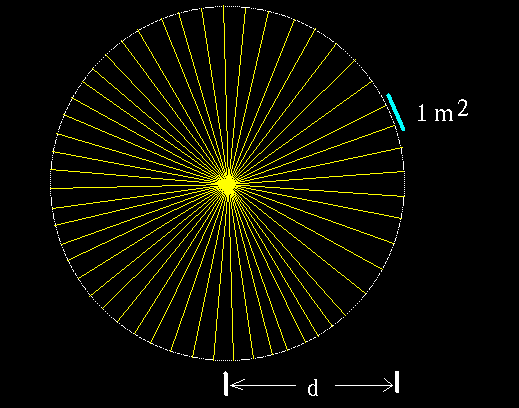
The image above shows the relation between a star’s luminosity and its brightness. Brightness decreases proportionally to the square of the distance as we move away from the star. The rate of energy that reaches the observer on Earth is apparent brightness. Apart from the magnitude scale presented above, the apparent brightness can be expressed in watts/m2. For example, the apparent brightness of the Sun is 1370W/m2. It means, that if we could have the solar panel held perpendicularly to solar rays, we would receive 1370 Watts of electricity. It’s only a purely theoretical assumption because solar rays go through Earth’s atmosphere and solar panels are not perfectly efficient. For comparison, the brightest star – Sirius has an apparent brightness of 10-7 W/m2. It means, that if you would like to light u a 10-watt bulb with the energy of Sirius you would need a 10km length of solar panel.
The consideration about Sirius as well as other brightest stars has been left for another text immediately following this one.
Mariusz Krukar
References:
- Bhatia V.B., 2001, Textbook of Astronomy and Astrophysics with Elements of Cosmology, University of Delhi, Delhi
- Duric N., 2004, Advanced Astrophysics, Cambridge University Press, Cambridge
- Gray O.R., Corbally C.J., 2009, Stellar spectral classification, Princeton University Press, Princeton
- Inglis M., 2007, Astrophysics is Easy!: An Introduction for the Amateur Astronomer, Springer International Publishing, Cham
- Jaschek C., Jaschek M., 1987, The classification of stars, Cambridge University Press, Cambridge
- Koupelis T., 2011, In quest of the Universe, Jones and Barlett Publishers, Mississauga
- Kutner M.L., 2003, Astronomy: A physical perspective, Cambridge University Press, Cambridge
- Moore P., 2002, Giant star (in:) Astronomy Encyclopedia, Oxford University Press, New York.
- Schaaf F., 2008, The brightest stars. Discovering the universe through the sky’s most brilliant stars, John Wiley & Sons, Hoboken
- Tassoul J.L., 2004, A concise history of solar and stellar physics, Princeton University Press, Princeton
- Zeilik M., 2002, Astronomy: The evolving universe, Cambridge University Press, New York
Links:
- The brightness of the stars
- https://www.scholastic.com/teachers/articles/teaching-content/all-about-stars/
- The astronomical magnitude scale
- Stellar brightness
- https://www.visualcapitalist.com/the-44-closest-stars-and-how-they-compare-to-our-sun/
- https://www.space.com/21640-star-luminosity-and-magnitude.html
- https://www.sidmartinbio.org/what-three-factors-determine-the-brightness-of-a-star/
- Apparent and absolute magnitude
- https://www.britannica.com/science/magnitude-astronomy
- Star magnitude calculator
- Star brightness calculator based on the apparent magnitude
- https://www.britannica.com/science/stellar-classification
- Libraries of the stellar spectra
- https://lco.global/spacebook/distance/magnitude-and-color/
- https://www.teachastronomy.com/textbook/Properties-of-Stars/Stefan-Boltzmann-Law/
- https://www.bbvaopenmind.com/en/science/physics/the-colour-of-stars-treasure-map-for-astronomers/
- https://www.britannica.com/science/star-astronomy/Numbers-of-stars-versus-luminosity
- https://www.cliffsnotes.com/study-guides/astronomy/the-hertzsprung-russell-diagram/mass-luminosity-relationship
- The evolutionary cycle of stars
- The life and death of the stars
- https://www.cliffsnotes.com/study-guides/astronomy/the-hertzsprung-russell-diagram/hertzsprung-russell-diagram-the-basics
- https://courses.lumenlearning.com/astronomy/chapter/evolution-from-the-main-sequence-to-red-giants/
- The life of a star
- How do we determine the life cycles of stars and tag some as “young” and some as “old?”
- https://courses.lumenlearning.com/astronomy/chapter/the-brightness-of-stars/
- Wien’s displacement law
- Astro.rug.nl: Basic properties of stars
- Plank Radiation Formula
- https://www.universetoday.com/130870/stars-different-colors/
- https://earthsky.org/astronomy-essentials/stellar-luminosity-the-true-brightness-of-stars/
- Luminosity – how far the things are
- Classifying stars
- Pulsating stars
- Long period variable star
- Stellar brightness
- https://answersdrive.com/what-are-the-factors-that-determine-the-brightness-of-a-star-7545092
- Stellar lifetimes
- Skyandtelescope.org: How do stars die and how long do stars live?
- Astronomynotes.com: Stellar evolution
- Are they planets or what?
- The difference between red giants and blue giants
- What are red giants?
- What are Hypergiant Stars Like?
- Astroquizzical.com: What’s the Hertzsprung gap?
- Earthsky.org: What-is-stellar-magnitude
- Dictionary.com: Pogson ratio
- Magnitudes – measuring the brightness of the stars
- https://astronomy.swin.edu.au/cosmos/a/Apparent+Magnitude
- https://www.phys.ksu.edu/personal/wysin/astro/magnitudes.html
- Brightness of the stars
- The stellar magnitude system
- How bright is a star?
- https://carlyfraserphotography.com/colors-of-light
- http://www.star.ucl.ac.uk/~pac/spectral_classification.html
- https://lweb.cfa.harvard.edu/~pberlind/atlas/htmls/note.html
- https://courses.lumenlearning.com/astronomy/chapter/the-spectra-of-stars-and-brown-dwarfs/
- Nice depicted spectral type characteristic
- Intrinsic colours as a function of spectral type
- Spectral type and luminosity class
Forums:
- https://www.quora.com/What-are-the-factors-that-affect-the-brightness-of-a-star
- https://astronomy.stackexchange.com/questions/36025/how-do-we-measure-the-brightness-of-the-stars
- https://www.quora.com/Does-blue-light-have-more-intensity-as-compared-to-red-light
- https://physics.stackexchange.com/questions/441695/with-the-same-power-output-which-color-of-light-give-the-most-intensity
- https://www.quora.com/When-viewed-from-Earth-a-red-star-and-a-blue-star-appear-to-be-equally-bright-What-can-you-infer-about-these-two-stars
- https://www.quora.com/How-is-a-blue-star-different-from-a-red-star
- https://www.quora.com/Is-a-star%E2%80%99s-brightness-the-same-thing-as-its-luminosity
- https://www.quora.com/Someone-says-the-Sun-seems-brighter-because-it-is-bigger-than-other-stars-What-would-you-say?top_ans=306517368
- https://www.quora.com/What-are-the-stages-in-the-life-of-a-star-and-what-happens-in-each
- https://www.quora.com/Why-are-stars-different-in-colour-and-in-brightness
- https://www.quora.com/What-is-the-chemical-compound-of-a-star
- https://www.quora.com/What-is-the-relationship-between-a-star-s-mass-and-how-long-it-stays-on-the-Main-Sequence
- https://www.quora.com/Why-do-high-mass-stars-have-shorter-life-spans-than-others
- https://www.quora.com/What-is-the-Hertzsprung-Russell-diagram
- https://www.quora.com/How-is-a-subdwarf-star-different-than-other-types-of-stars
- https://www.quora.com/What-is-the-difference-between-the-subgiant-stars-and-the-main-sequence-stars
- https://www.quora.com/What-causes-a-star-to-be-a-giant-or-a-supergiant
- https://www.quora.com/Why-do-stellar-magnitudes-get-smaller-into-the-negative-as-the-stars-themselves-get-visibly-brighter
- https://www.quora.com/How-do-you-judge-the-magnitude-of-a-star-with-any-accuracy
- https://www.quora.com/What-is-the-difference-between-apparent-magnitude-and-apparent-bolometric-magnitude
- https://astronomy.stackexchange.com/questions/19891/absolute-magnitude-and-absolute-bolometric-magnitude
- https://www.quora.com/How-is-the-size-and-luminosity-of-a-star-determined
- https://www.quora.com/What-is-electromagnetic-radiation-in-spectral-class-for-stars-Is-it-the-temperature-of-stars-or-is-it-the-colors-red-white-blue-orange-yellow-that-are-shown-in-the-HR-diagram-Because-I-am-very-confused
Wiki:
- Absolute_magnitude
- Apparent_magnitude
- Brightness_temperature
- Bolometric_correction
- Brown_dwarf
- Effective_temperature
- Hertzsprung_gap
- Hertzsprung%E2%80%93Russell_diagram
- Inverse-square_law
- Luminosity
- Magnitude_(astronomy)
- Main_sequence
- Mass & luminosity_relation
- Planck’s law
- Red_dwarf
- Red_giant
- Stefan%E2%80%93Boltzmann_law
- Stellar_chemistry
- Stellar_classification
- Stellar_evolution
- Subgiant
- Supergiant
- Variable_star
- White_dwarf
- Wien’s_displacement_law
Read also:
- How bright the starlight is?
- The role of contrast in ability of human vision
- Light around us and how to measure it?
Youtube:

