
Today I would like to discuss the process of how can we plot bulk data located in multiple Excel worksheets to QGIS and display them as the point layer.
I definitely mean the situation, when your Excel data is equipped with the geometry, which allows the QGIS to locate all points correctly. The pivot of this article is the explanation of how to cope quickly with the data located in various worksheets across the workbook. It might happen, that our data have been already categorized and put into different worksheets separately. When our workbook is comprised of, for instance, 20 worksheets we might think that you can’t handle this task relatively quickly. Nothing is more wrong. With all the steps presented below, you will be able to cope with it within less than 5 minutes!
Imagine, that your Excel workbook with some data with addresses looks like the one below (Pic. 1):
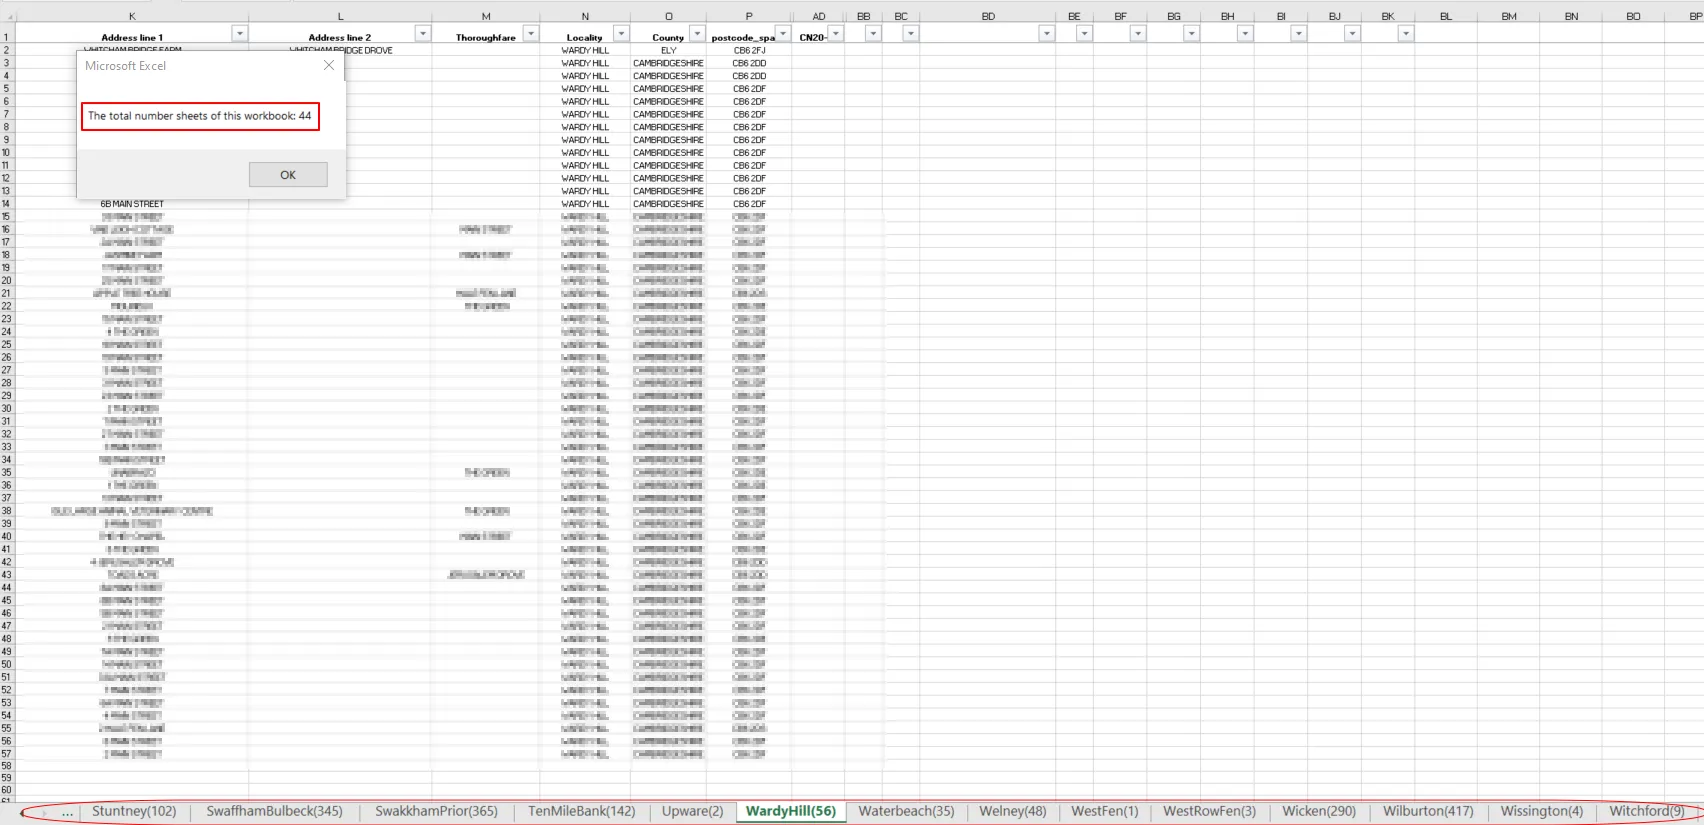
which has more than 40 sheets, calculated swiftly by the VBA code presented below.
Public Sub CountWorkSheets()
MsgBox "The total number sheets of this workbook: " & Application.Sheets.Count
End Sub
What you can do next? The first reasonable way, that comes to your mind is to put all this data together. We could do it in Excel by copying and pasting them onto one sheet, but we don’t need to do that! Moreover, the final data, which we need must be in the .csv file, if we want to make it readable for the QGIS.
What we should focus on is extracting all sheets from our workbook and saving them as separate files, preferably the .csv files. Since our initial Excel workbook includes 44 worksheets, we will get 44 other files. Furthermore, it would be vital to keep the names of our sheets, as they appear in Excel in order to avoid a potential mess and ambiguity.
There is a nice VBA code, which would do this job for us! The code looks as follows:
Sub ExportSheetsToCSV()
Dim xWs As Worksheet
Dim xcsvFile As String
For Each xWs In Application.ActiveWorkbook.Worksheets
xWs.Copy
xcsvFile = ThisWorkbook.Path & "\" & xWs.Name & ".csv"
Application.ActiveWorkbook.SaveAs Filename:=xcsvFile, _
FileFormat:=xlCSV, CreateBackup:=False
Application.ActiveWorkbook.Saved = True
Application.ActiveWorkbook.Close
Next
End Sub
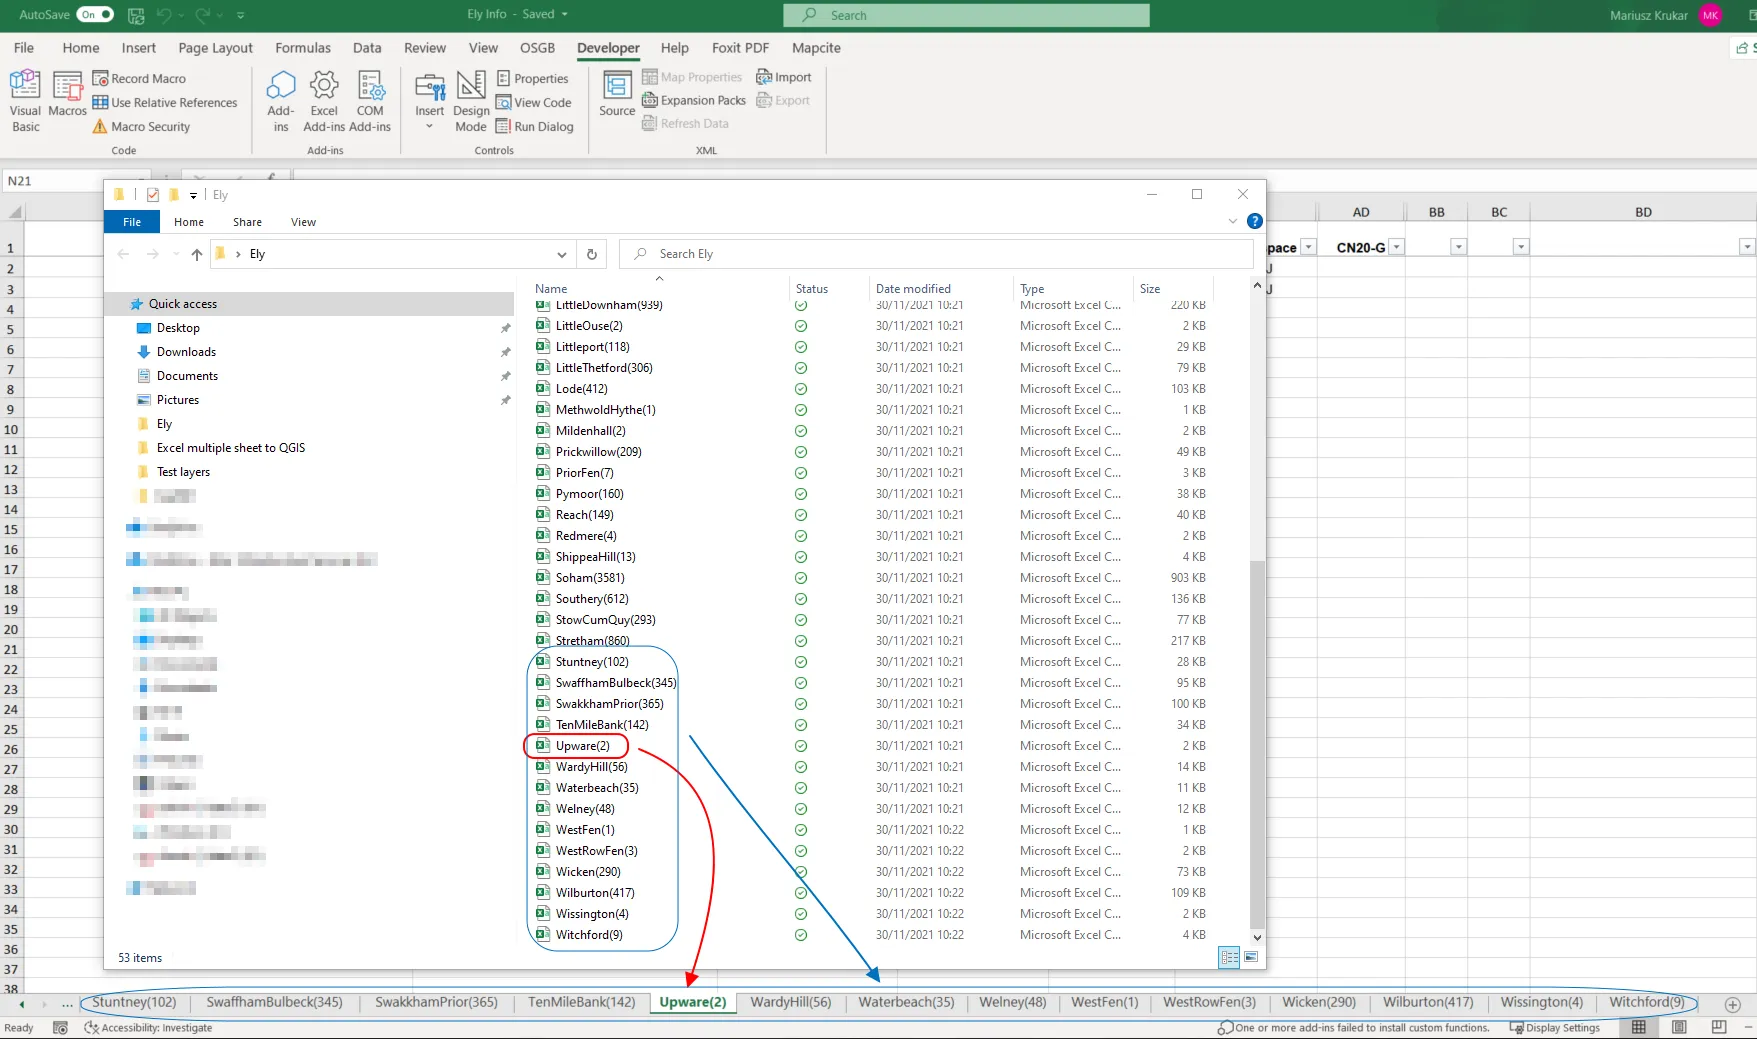
where you define the path of your new .csv files. It’s good to keep them on the same path where the mother Excel workbook is located, but you don’t need necessarily to do it. When your code is ready, just run it and give it some time (several seconds to 2-3 minutes), which depends on the total number of sheets to extract.
When everything is ready, your directory content should look like the below (Pic. 2):
Now, since everything is located in our directory, we should find the quickest way to plot all of the files in QGIS as the point layers. The reasonable option here will be the Python console. One of the codes, which we can use looks like the below:
import glob, os

# Define path to directory of your csv files
path_to_csv = "C:/my/directory/Ely/"

# Set current directory to path of csv files
os.chdir(path_to_csv)
# Find each .csv file and load them as vector layers
for fname in glob.glob("*.csv"):
# Define your CRS and columns with geometry
uri = "file:///" + path_to_csv + fname + "?delimiter=%s&crs=epsg:27700&xField=%s&yField=%s" % (",", "Easting", "Northing")
name = fname.replace('.csv', '')
lyr = QgsVectorLayer(uri, name, 'delimitedtext')
QgsProject.instance().addMapLayer(lyr)
where we should define the CRS system we are working on as well as the columns that include the geometry data. It can be respectively “X” and “Y“, “Lon“, “Lat” or “Easting“, “Northing” like in my case. You will get to know simultaneously which .csv files have the geometry missing. In this event, they won’t be plotted in QGIS at all.
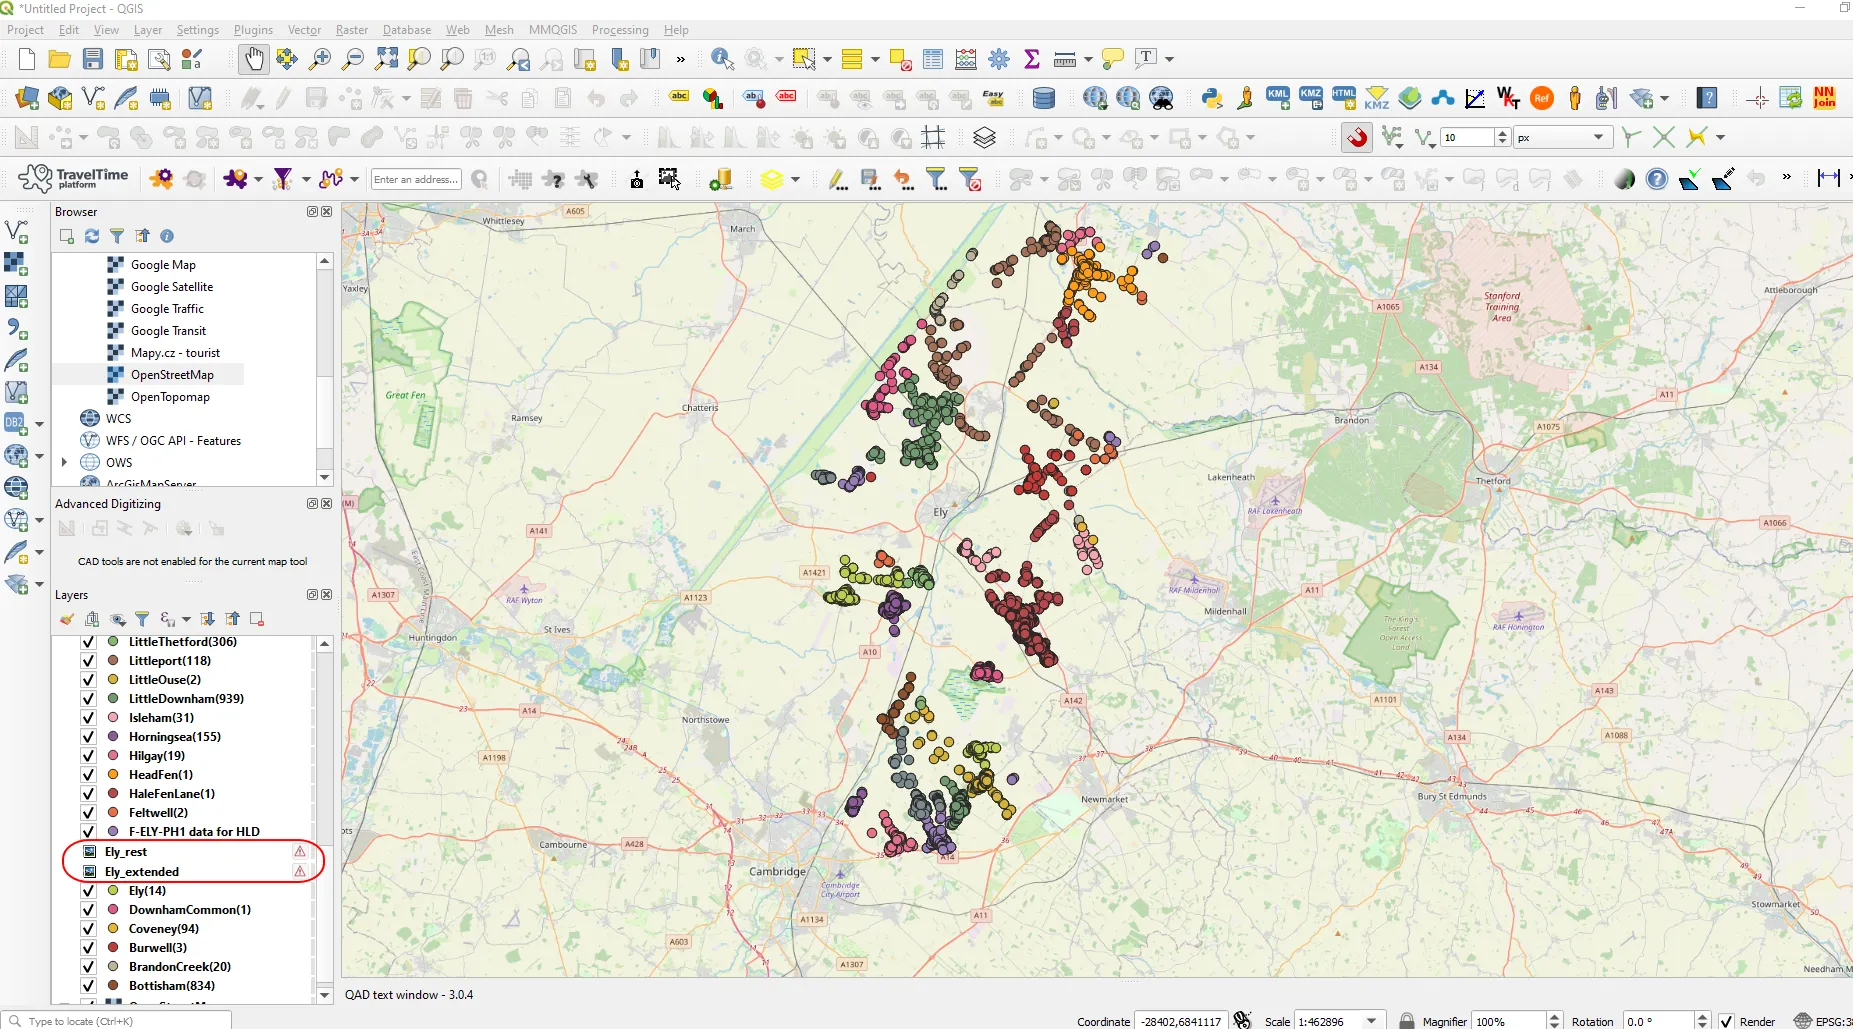
Wait a few seconds and see your result. All delimited text layers, whose geometry column titles match with those defined in the code above (“Easting”, “Northing”) are now visible in our QGIS project.
On the other hand, you can see the layers, which have not been loaded correctly because of the potential lack of geometry or at least the different names of columns defining it (Pic. 3).
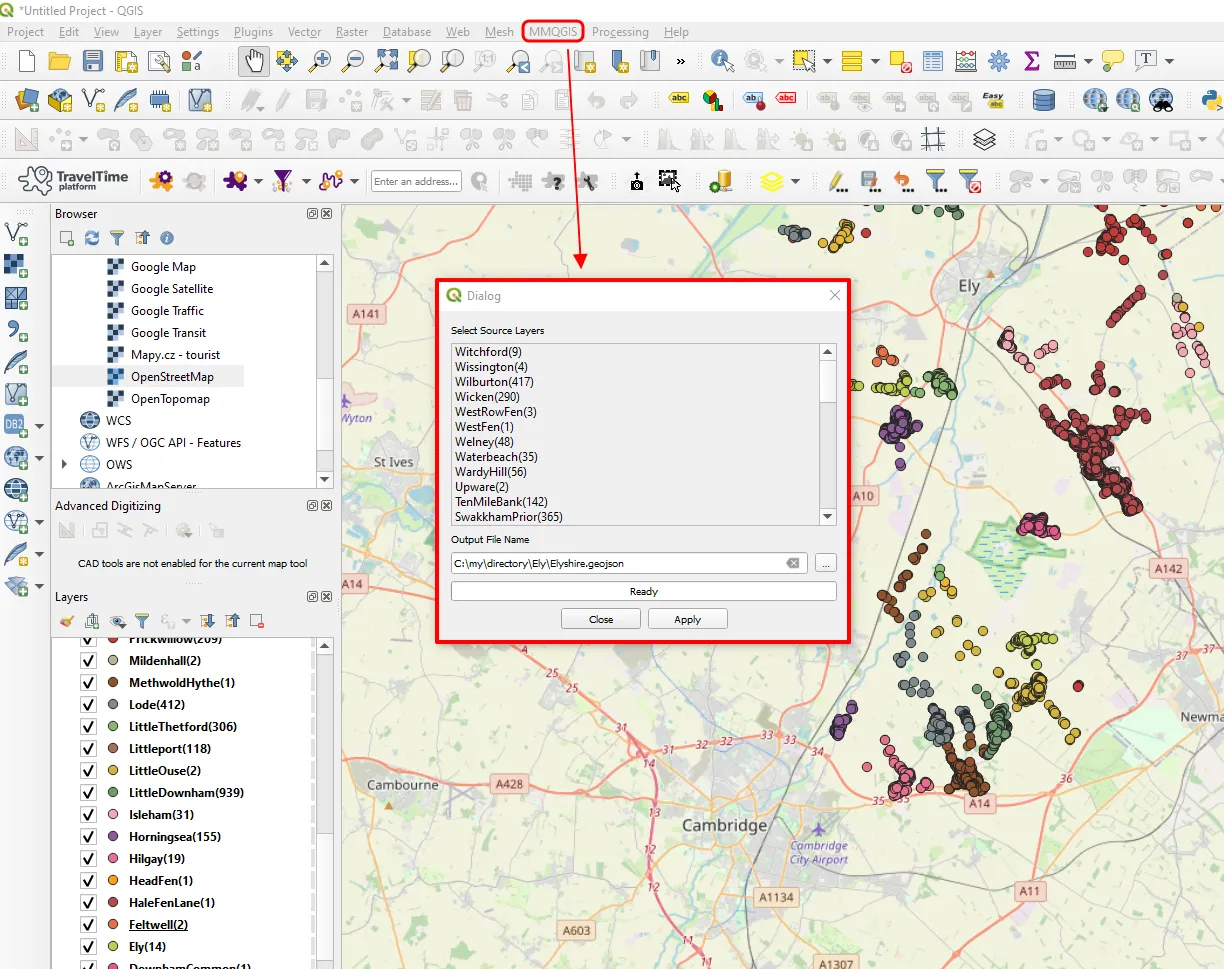
Our next step seems to be making just one point layer from these all 44 provided. In this case, we can use the MMQGIS plugin, which will do it for us quickly. Once you install this plugin, you should have the MMQGIS options.
From the MMQGIS options select “Combine” -> “Merge layers” and next your first thing after selecting all the layers you want to merge should be the definition of the output file. You have the choice between the Shapefile, GeoJSON, Spatialite, KML, or GPKG. When you define your output file, just click “Apply” and see how the algorithm is running (Pic. 4).
The data should be merged successfully, but sometimes you might see the following error:
“Error: creation of data source failed (OGR error:Failed to create directory .geojson for shapefile datastore.)”
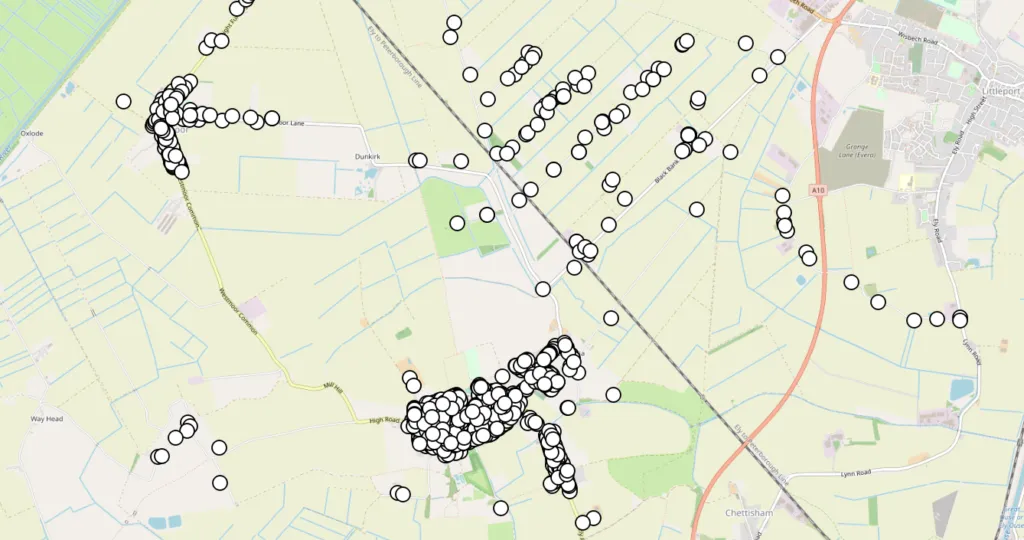
which means, that you didn’t specify the filename for the export. Even if an error such as this appears, your new file will emerge in the “Layers” panel. Now it looks like we are done. You have all the Excel data plotted to QGIS and finally merged as one layer (Pic. 5).
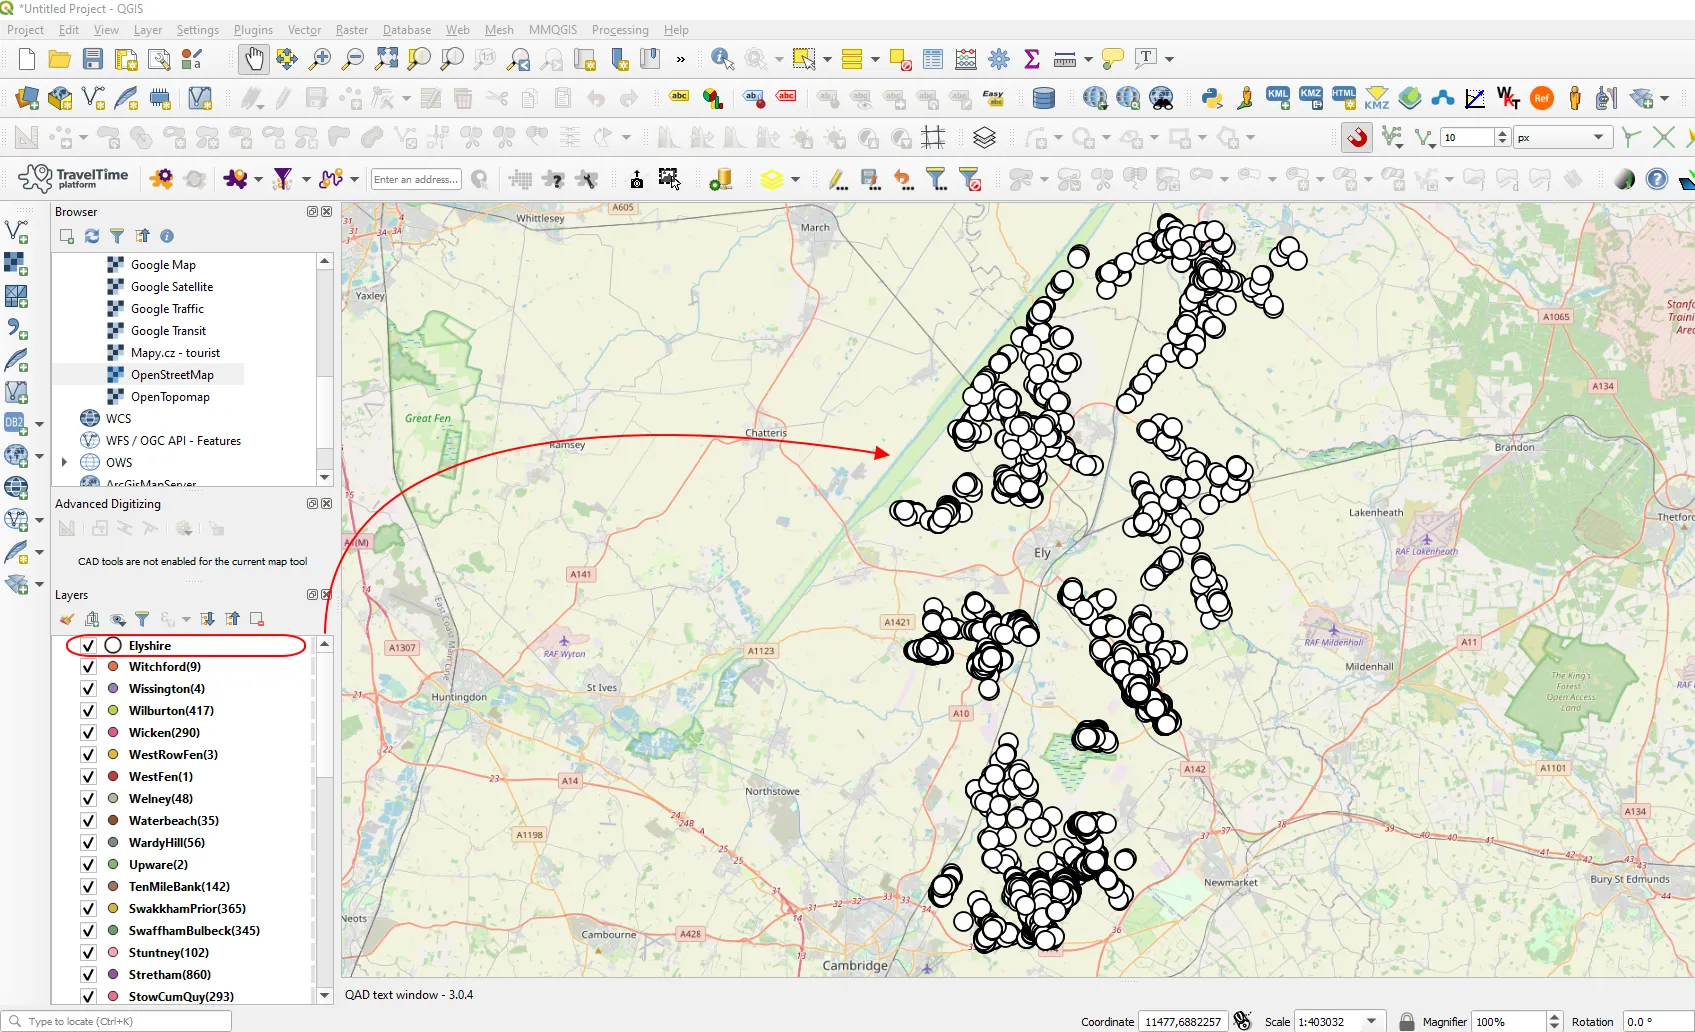
If you are not sure, that the process has been completed correctly, you can play with the styling a bit and move your final layer to the top, as you can see above.
Everything, I believe shouldn’t last more than 5 minutes, when considering some average Excel file with about 10K records as in the example provided.
Mariusz Krukar
Links:
- https://www.extendoffice.com/documents/excel/1585-excel-count-the-number-of-sheets.html
- https://www.extendoffice.com/documents/excel/2972-excel-save-export-convert-multiple-all-sheets-to-csv-text.html
- http://chris35wills.github.io/multi_csv_into_qgis/
Forums:
- https://gis.stackexchange.com/questions/212910/loading-multiple-csv-files-into-qgis-2-10
- https://gis.stackexchange.com/questions/25061/merging-multiple-vector-layers-to-one-layer-using-qgis
- https://gis.stackexchange.com/questions/93300/fixing-error-creation-of-data-source-failed-ogr-errorfailed-to-create-direct