
Checking the tsunami vulnerability in your holiday destination
The Coastal zone makes up only 4% of the world’s land area but is home to one-third of the world’s population. The Coastal zone is also the most popular destination for holidaymakers, who stay in the hotel located alongside the beach. Being on your holiday we are not always aware of the basic and underrated hazard, which is a tsunami wave.
Tsunamis are caused by the displacement of a large volume of water, generally in an ocean or a sea. This displacement of water is the outcome of submarine seismic disturbances. Submarine earthquakes have the potential to generate landslides along the steep-continental slopes, that flank most coastlines (Bryant, 2005). In addition, steep slopes exist on the sides of ocean trenches and around the thousands of ocean volcanoes, seamounts, atolls, and guyots on the seabed. Because such events are difficult to detect, submarine landslides are considered a minor cause of tsunamis (Bryant, 2014). More often tsunamis can have a volcanic origin, especially when the eruption is associated with tectonic earthquakes. In general, a volcanic eruption rarely produces a large tsunami. Probably the most devastating event was the Santorini Island eruption around 1470 BC, which generated a tsunami that must have destroyed all coastal towns in the eastern Mediterranean. Another, but very rare reason for a tsunami is an asteroid’s impact on the ocean. It was only one suspected in human history on September 28, 1014 (Bryant 2014) and possibly a few earlier whilst Chicxulub impacts in Mexico, that was responsible for the extinction of the dinosaurs. Finally, meteorological events can generate a tsunami (Bryant 2014). These tsunamis are common in temperate latitudes, where variations in atmospheric pressure over time are greatest. Such phenomena tend to occur in lakes and embayments where the resonance of wave motions is possible (Bryant, 2014).
Nowadays we have a lot of tools, that are able to assess the tsunami vulnerability for the coastal zone around the world taking into account factors like land cover, land use, slope, elevation, geomorphology, distance from the shore, and altitude above the seafloor. From our point of view, the most important factors are the altitude above mean sea level and the degree of tourist infrastructure (places to stay) in the coastal zone. I found a simple way of using very basic GIS tools to evaluate the tsunami impact on your tourist destination.
Analyses of tsunami range with respect to an altitude above mean sea level are widespread on the web. You can use both the Water Level Elevation Map and Tsunami Mapper to input the random value of sea-level rise and check the hazard dimension in your area. However, if you want to fiddle more with this issue I will show you the simple process of how to overlap the increased sea level with all places to stay displaced in your area.
You will need 3 tools: a sea level map, GIMP software, and Booking.com.
Sea level map
Basically, I found two, however, I am aware, that you can find more. One of them is the Floodmap.net server (Pic. 1), where you can check the sea level for each location. I will consider Bohol Island, where I am going on a honeymoon.
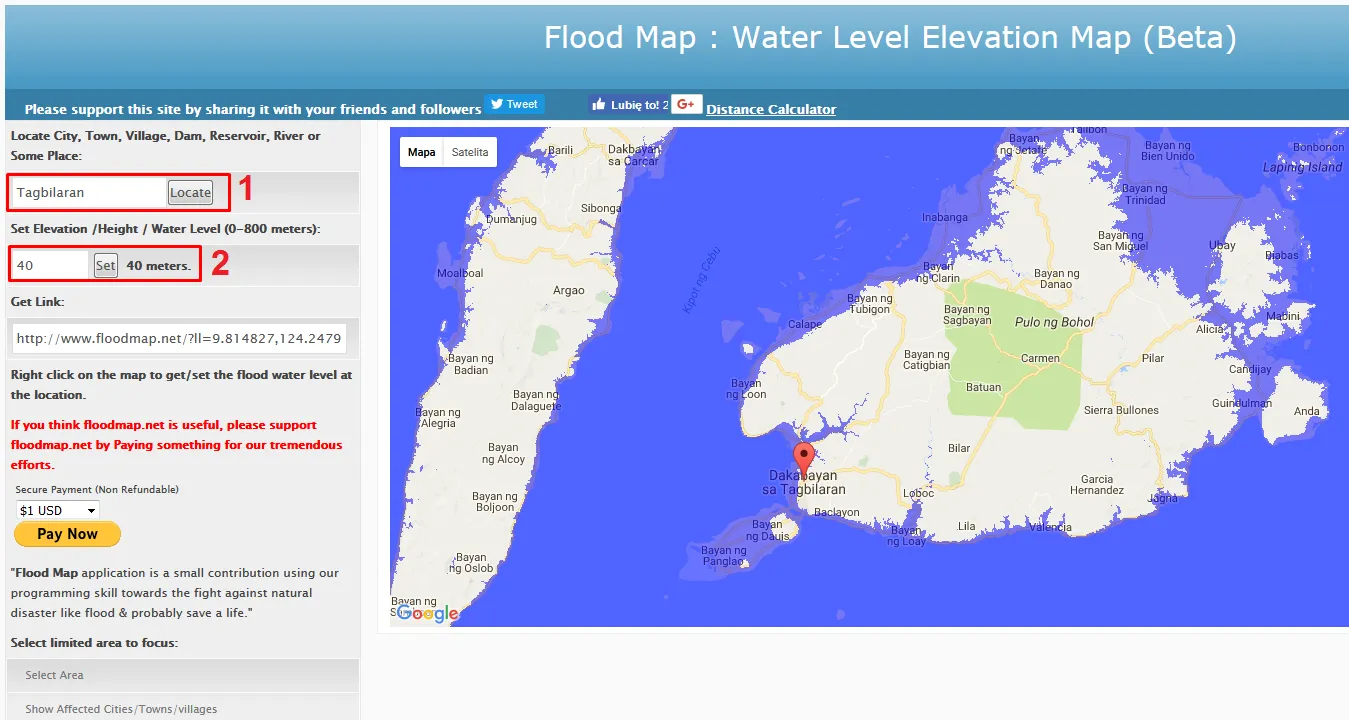
Pic. 1 The Floodmap.net main interface: 1 – Put your location, 2 – Set the water level (meters above current sea level).
This server is nice, although you can only consider one value. For instance, the sea level generator provided by Heywhatsthat.com is slightly more advanced. It allows you to use 3 values in the result (Pic. 2,3). However, it doesn’t reflect a rough sea level rise even if you put the values correctly. Moreover, you are not able to change the color values, because otherwise they are gone. Anyway, I will show you below how to use it and next how to combine it with another Google Map layer including the places to stay.

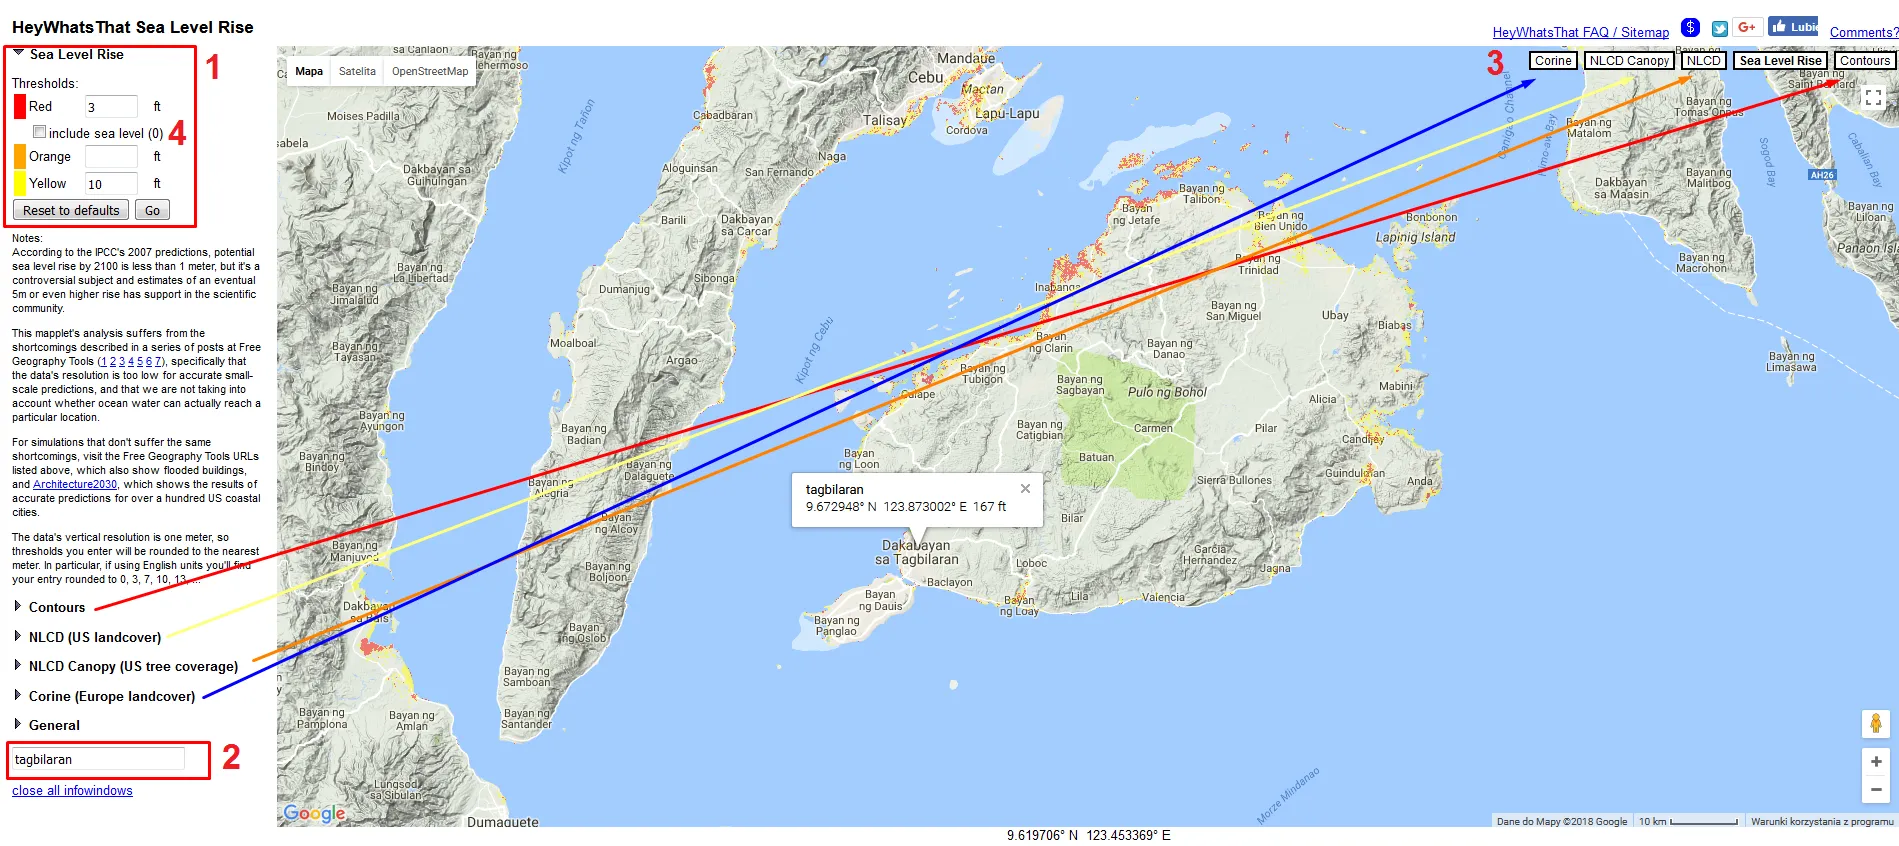
Pic. 2, 3 The Haywhatsthat.com sea level interface centered on Bohol Island with the description below: 1 – Sea level rise options with 3 variable values, 2 – The location bracket, 3 – The landcover layers available, 4 – “Include sea level” option.
At first, I am not recommending you select the “Include sea level” option, because the lowest value will cover all water areas including additional seafloor rise value (Pic. 4).
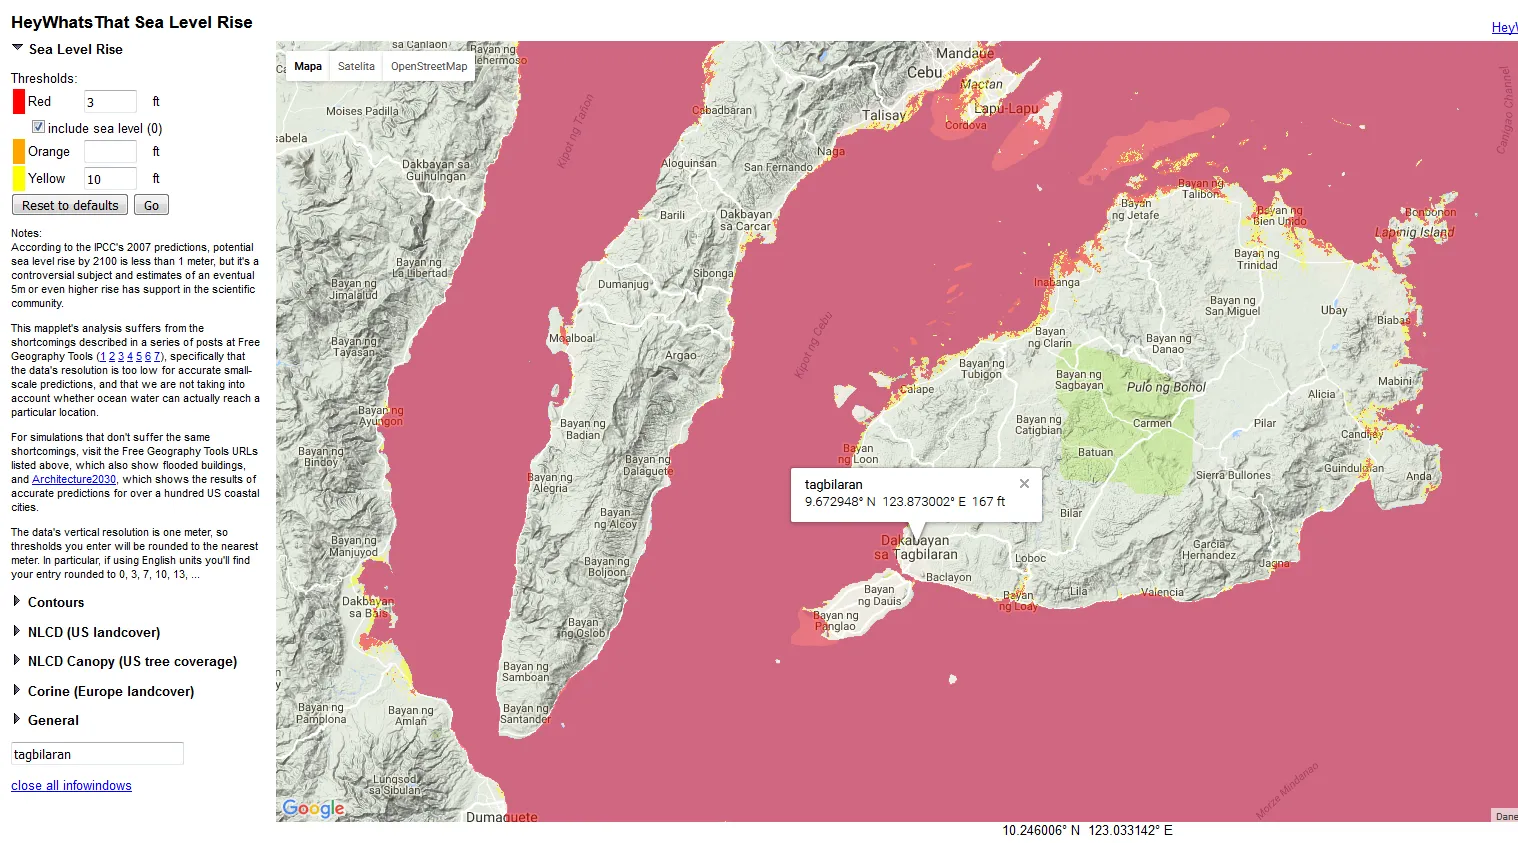
Pic. 4 The “Include sea level” value is switched on – your bottom value actually covers all water areas around islands.
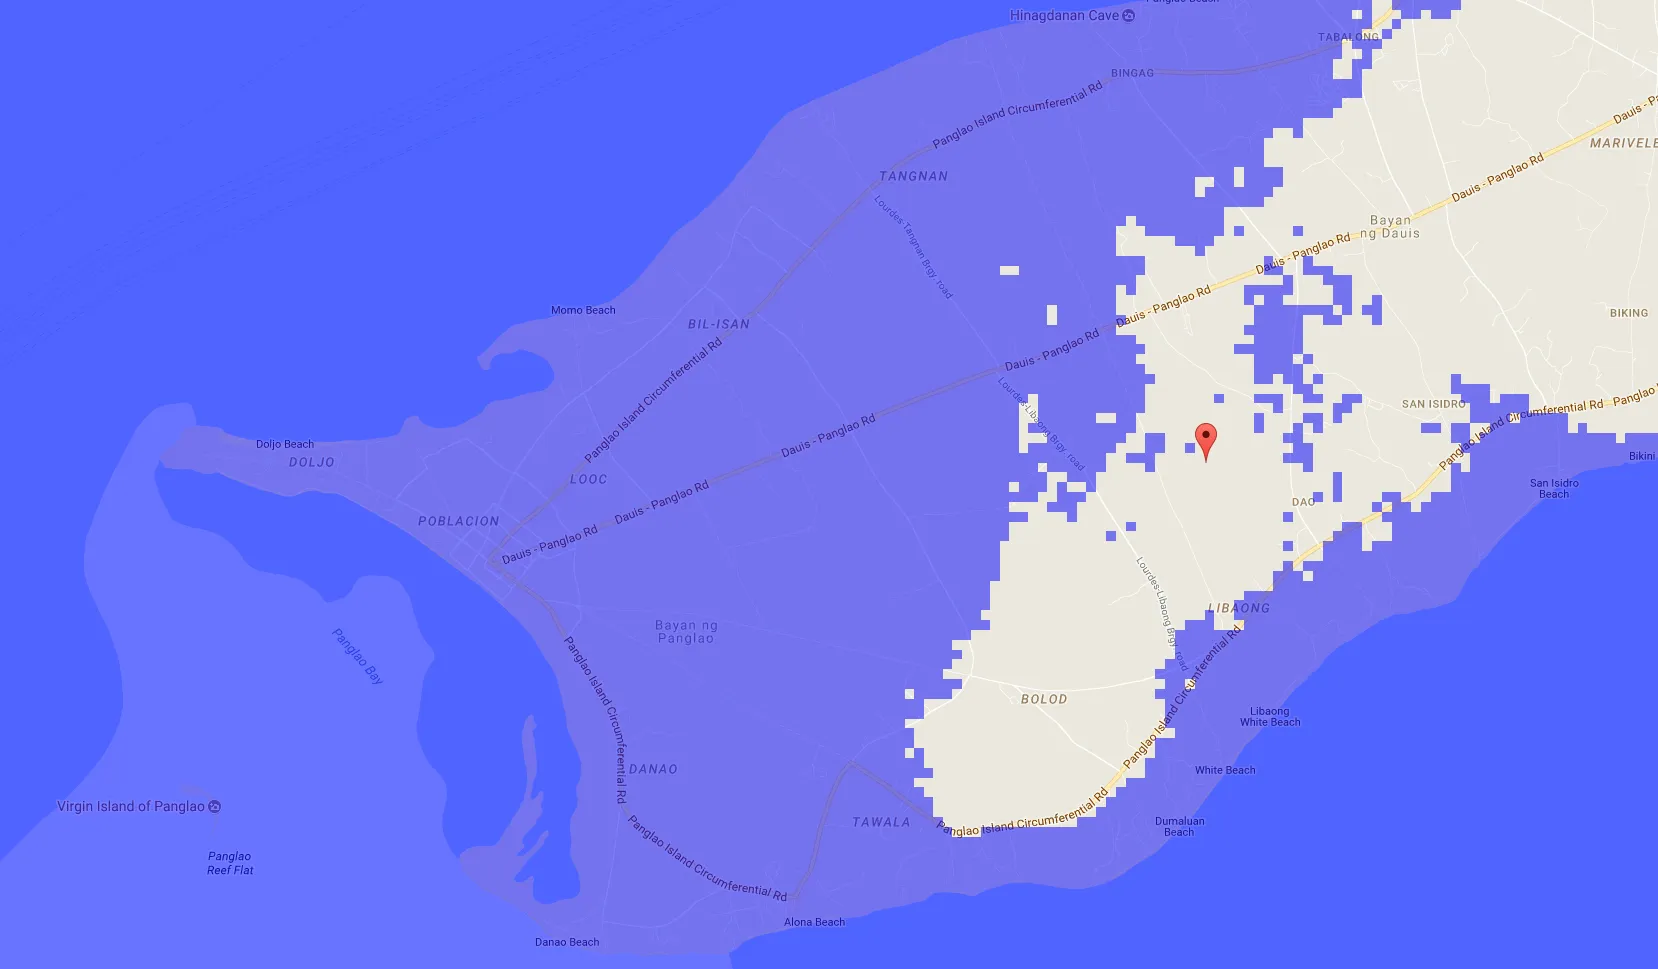
When you are ready you can zoom in on your tourist destination. See the western part of Panglao Island below (Pic. 5, 6). Panglao Island is connected by 2 bridges with Tagbilaran – the capital of Bohol island.


Pic. 5, 6 The tsunami hazard on Panglao Island (for values: 10m – red, 25m – orange, and 39m – yellow).
On the contrary, to Heywhatsthat.com sea level generator the Floodmap sea water level elevation shows a much more inundated area on this island (Pic. 7).
Pic. 7 The western part of Panglao Island is covered by tsunami water when the wave altitude is 25m.
So because of this inconsistency, I had to check this thing on Google Earth. At the outcome, I came around Heywhatsthat.com sea level generator definitely! I have found, that the typical altitude on the Island is around 30m.a.s.l. (Pic. 8). Why it hasn’t been covered in Heywhatsthat.com then?
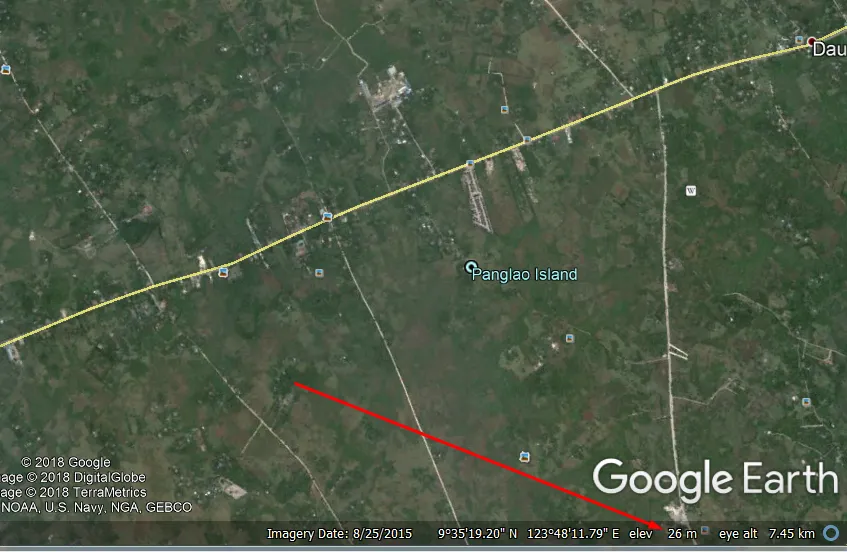
Pic. 8 The Typical altitude of Panglao island is around 25-30m.a.s.l. according to Google Earth.
Finally, I came to the conclusion, that in spite of a well-built sea level generator in Heywhatsthat.com, much better is use the Floodmap.net Water Level Elevation Map, because the data is more reliable.
Let’s go to the next step: find the map with accommodation. You can do it on Booking.com when opening the map option. The same step you can do on Airbnb and any other accommodation website (Pic. 9,10).

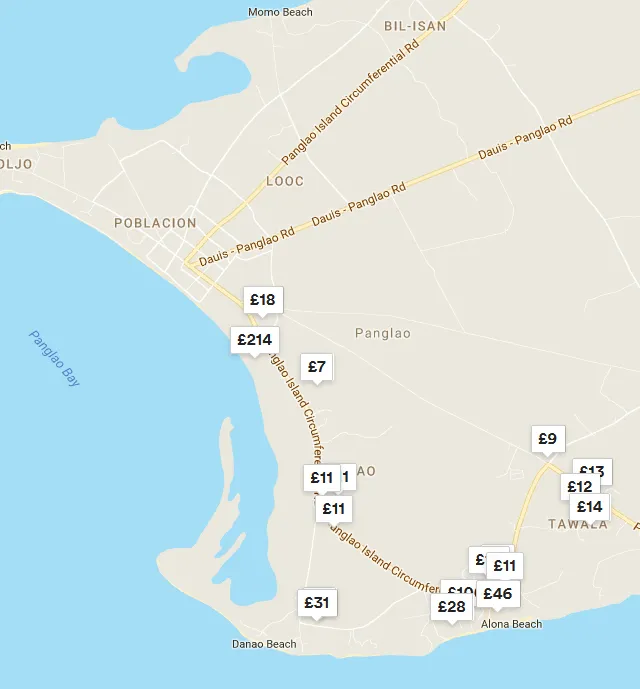
Pic. 9, 10 The accommodation on Panglao Island offered by: 7 – Booking.com, 8 – Airbnb.com
Our last step is combining both sea level and accommodation maps in the GIMP software. Open the GIMP and select File -> Open as layers -> the graph, that you have saved from the aforementioned websites before (Pic. 11).
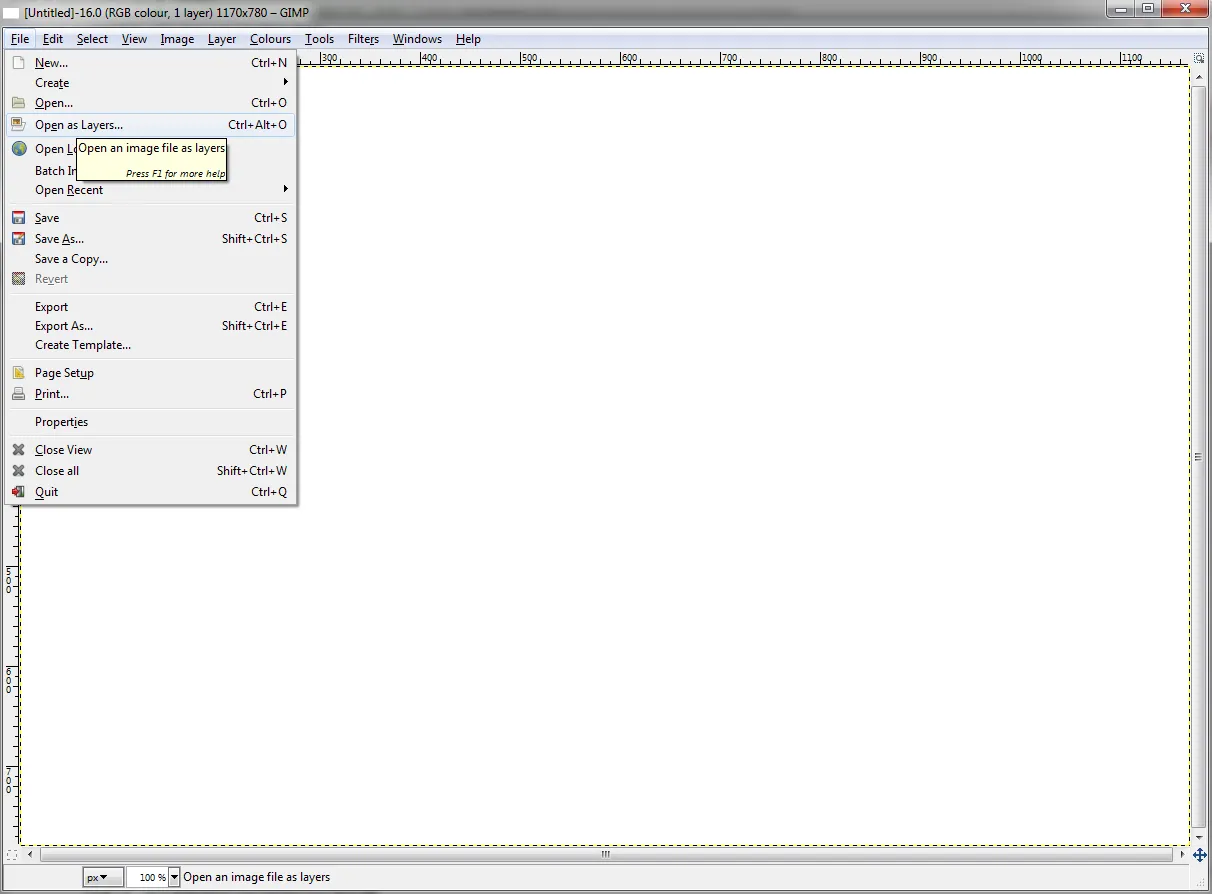
Pic. 11 GIMP – “Open as a layer” option.
Do it twice, because you need two layers to make your map ready (Pic. 12). Each layer should be visible in your “Layer – Brushes” dockable dialogue (Pic. 12).

Pic. 12 Gimp – 2 layers available when opened.
The layers are in the order, in which they have been opened. You can select the layer, that you would like to edit, marked in the blue belt (Pic. 12). Our next step is to make one of the layers transparent enough to see both layers at once. For this matter, we should open Layer->Transparency->Add Alpha Channel -> Colour to Alpha (Pic. 13).

Pic. 13 Making the layer transparent in the GIMP software.
Once you encounter this step you should have both layers visible (Pic. 14).

At the finish, you have to make them in the same position (Pic. 15). Both maps have been zoomed in on the same level, but their size is slightly different. Eventually, you should get a nice map of tourist accommodations with tsunami vulnerability.

Pic. 15 Degree of tourist infrastructure in western Panglao island with the tsunami vulnerability.
The map above is the most reliable one that I could prepare for you unlike to map created by Heywhatsthat.com, where the situation looks different (Pic. 16).
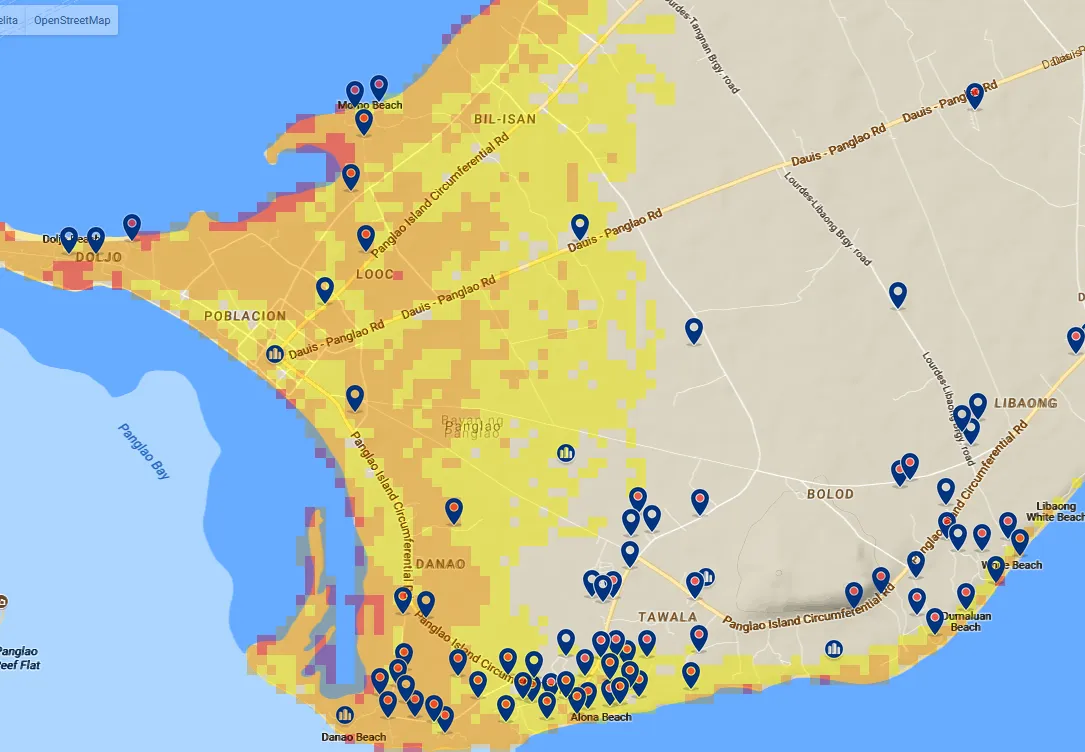
Pic. 16 The sea level map provided by Heywhatsthat.com shows a completely different tsunami estimation despite the local terrain details.
In summary, I would like to say, that this is a very simple process to create the tsunami vulnerability map for your tourist destination. In general, you can use the sea-level rise maps for many purposes. This article also shows the inconsistency between those web tools. It was found, that not all sea-level generators are reliable, and checking the altitude of the local area is required to make sure which sea-level generator is more reliable. You can expect a very detailed map, although I think, that this kind of open-source GIS software works great in this case.
Mariusz Krukar
References:
- Bryant, E., 2014, Tsunami: The underrated hazard, Praxis, International University of Malays-Wales, Kuala Lumpur.
- Bryant E., 2005, Natural Hazards, 2nd ed, Cambridge University Press, Cambridge.
Links:
- Water Level Elevation Map generator – good quality
- Heywhatsthat.com sea level generator
- How to make a transparent picture in GIMP software
- Colorhexa.com – select your color code
- Virtual tsunami generator
- Best tsunami process animations (Edumedia-sciences.com)
- The tallest tsunami in the world
- Megatsunami – wave of destruction
- http://www.sms-tsunami-warning.com/
Videos:
Tsunami at Phi Phi Islands, 2004