Excel Spreadsheet batch data geocoding for GeoJSON and JSON files
Recently I was dealing with geotagging single addresses in Google Maps and other easily accessible tools. However, the stuff, that I focused on is playing around with single placemarks only. I believe, that this operation is much more useful when we take into account not only the address but other details, related to this place.
For this purpose, I would like to show today how to make a geotagging our whole spreadsheet in order to its further display on the map. See the steps and advice below to understand how can you do this process swiftly.
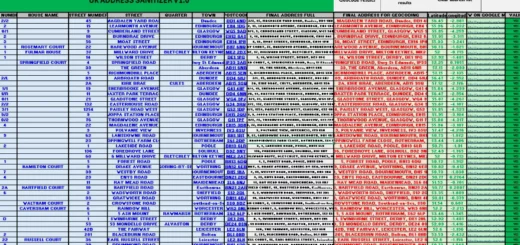
The picture below shows the simple spreadsheet containing both addresses and the details assigned to them in other columns, which we would like to have on the map (Pic. 1).
Pic. 1 MS Excel data with addresses with their details.
The aforementioned list includes column names with spaces. For the time being, I will show you the process of keeping no spaces in these names, so it should make you aware of initial MS Excel data preparation for further GeoJSON and JSON file usage.
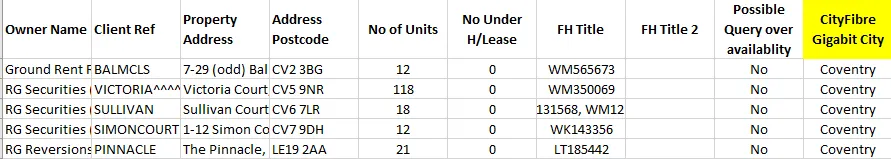
This geotagging theoretically could be done more simply via Google MyMaps. Unfortunately, Google MyMaps cannot manage a bulk list of addresses such that. Whilst these locations work on the Google MyMaps platform, there is no option to apply them outside, due to a lack of geometries.
Pic. 2 Bulk address data shown in Google MyMaps doesn’t provide the placemark geometries outside of this platform (Gis.stackexchange.com/Imgur.com).
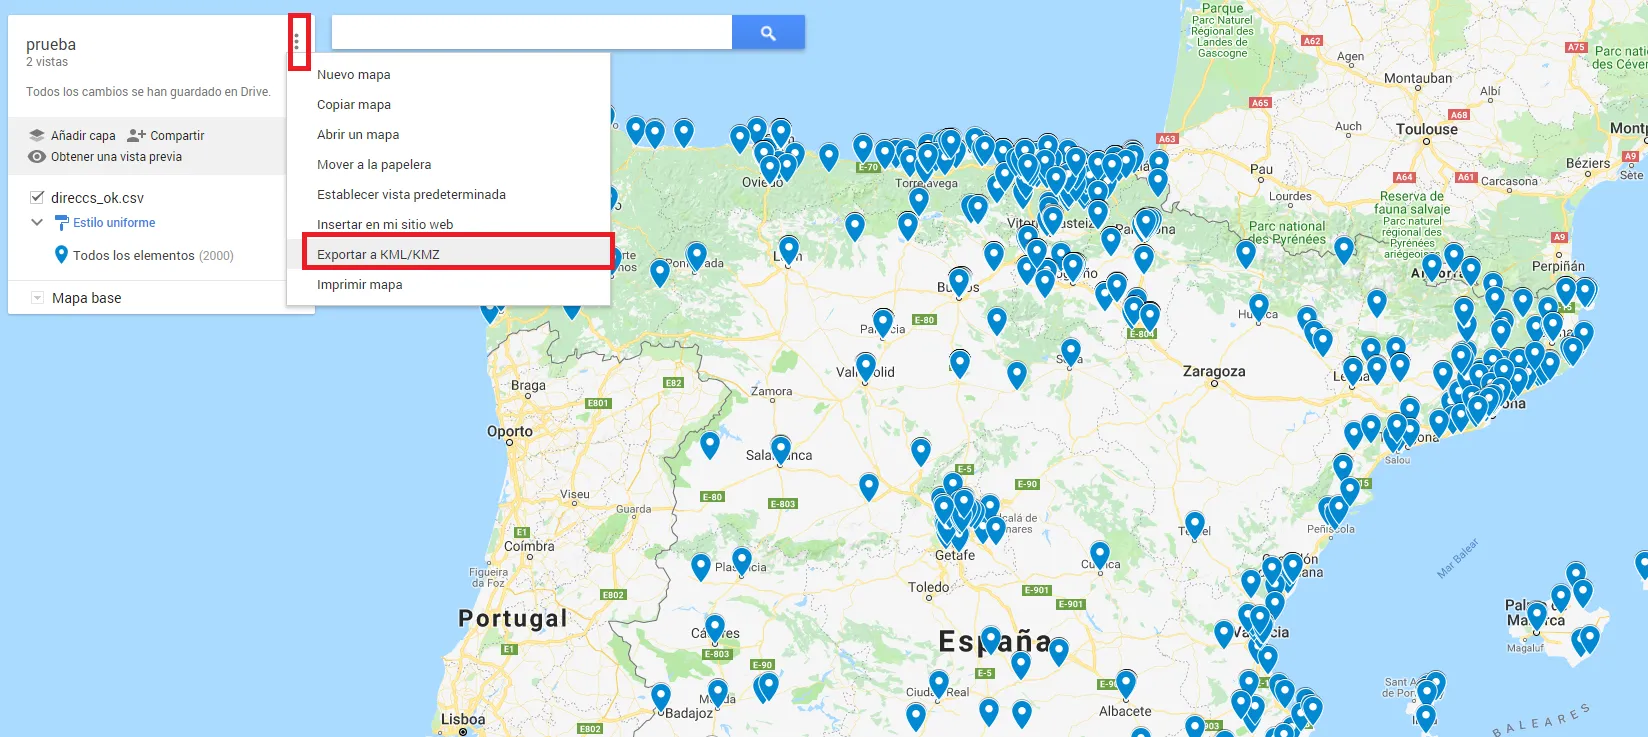
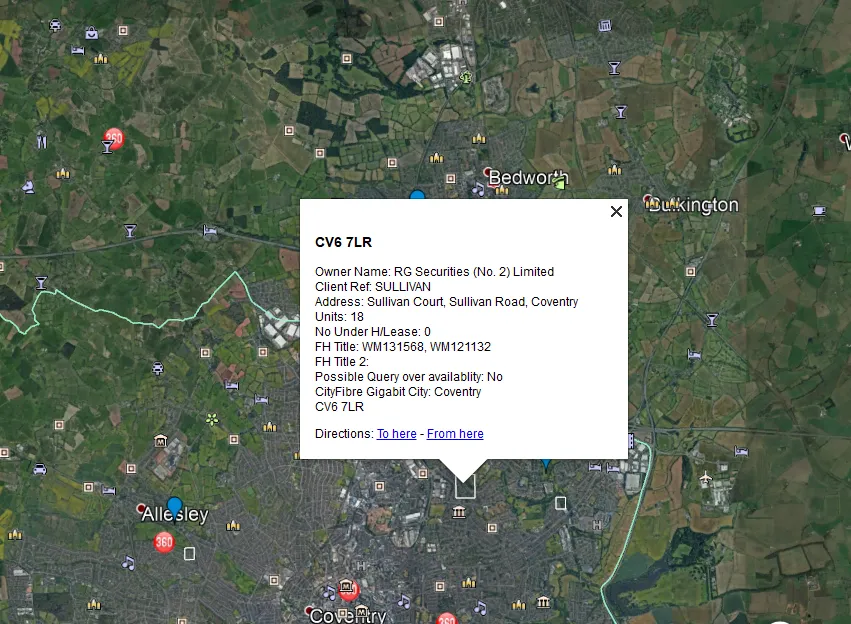
At first glance, everything looks alright. You have all the information included in the popup balloon as well as a proper placemark location (Pic. 3).
Pic. 3 Placemark popup example in Google MyMaps. All the stuff came from the MS Excel spreadsheet.
But transferring it to Google Earth is not so funny (Pic. 4). We don’t have our points at all. The only way to find them is by clicking on some of them in the folder tree at the left sidebar. Then we could see sth-like regions bounding these locations. This is not a thing, that would be desired by us. The data must be geotagged properly in a different way. We can try to save our Google Earth file as a .kml again (Pic. 5). Sometimes works, but the best way is to use another tool for proper geotagging.
Pic. 4 Popup balloon in Google Earth.
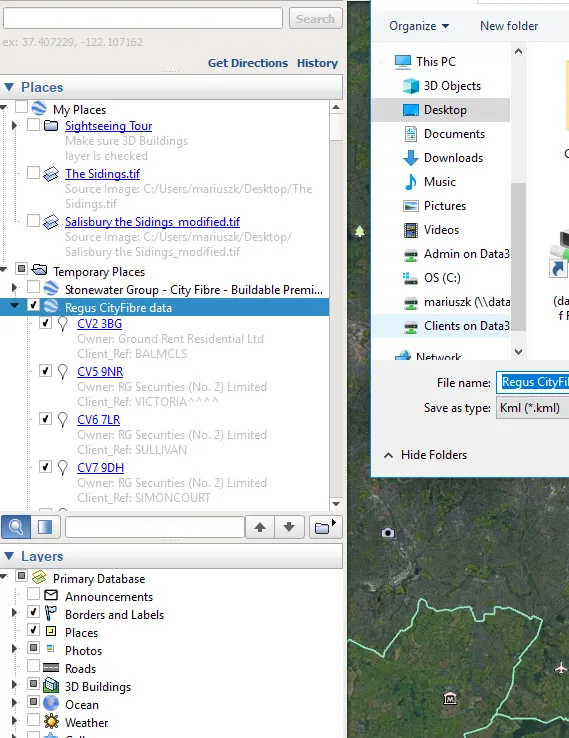
Pic. 5 Resaving the file in Google Earth using the file tree in the application’s left sidebar.
A similar issue can be spotted in the geojson.io tool. In case of instant conversion, of our .csv file to the .geojson or .json format first thing, that comes to mind is using i.e. this tool. Unfortunately, if we owe the postcodes only, this tool won’t be always able to do this job for us. Ultimately we will get an error, or even nothing has shown on the map (Pic. 6).
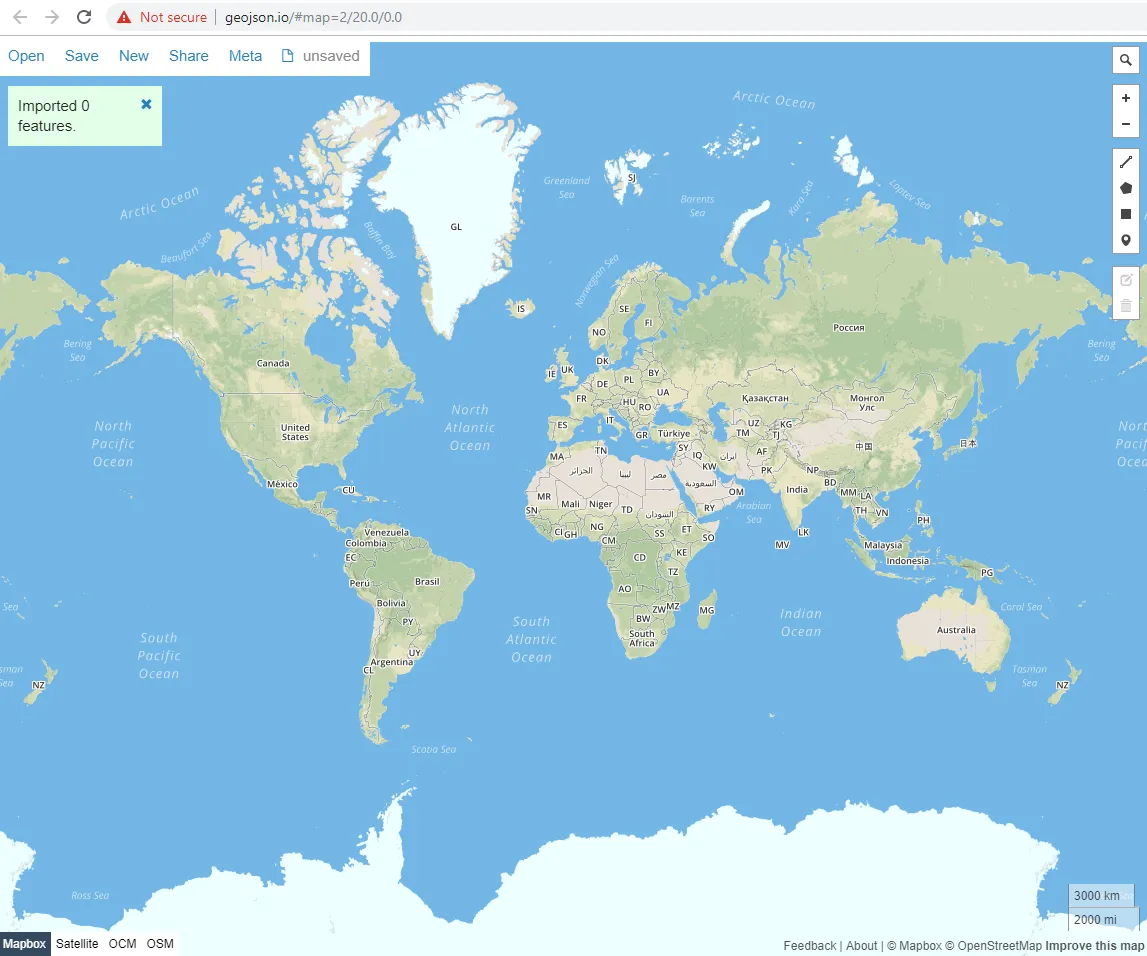
Pic. 6 Typical error at Geojson.io tool, showing that nothing has been imported to the map.
Converttocsv tool also won’t help you to solve this issue (Pic. 7).

Pic. 7 An issue with .csv to .geojson conversion caused by lack of geometries.
In this event, we must definitely find another way to assign the coordinates to our addresses first and try to convert our .csv file again. For this purpose, we can do this in 2 ways (although there are more tools on the Internet, to be honest): by MapYourList or Google Earth.
GEOTAGGING WITH MAP YOUR LIST
A decent tool, where you can quickly geotag your addresses is the MapYourList tool. There is the default data provided, although you can easily copy your stuff (Pic. 8).
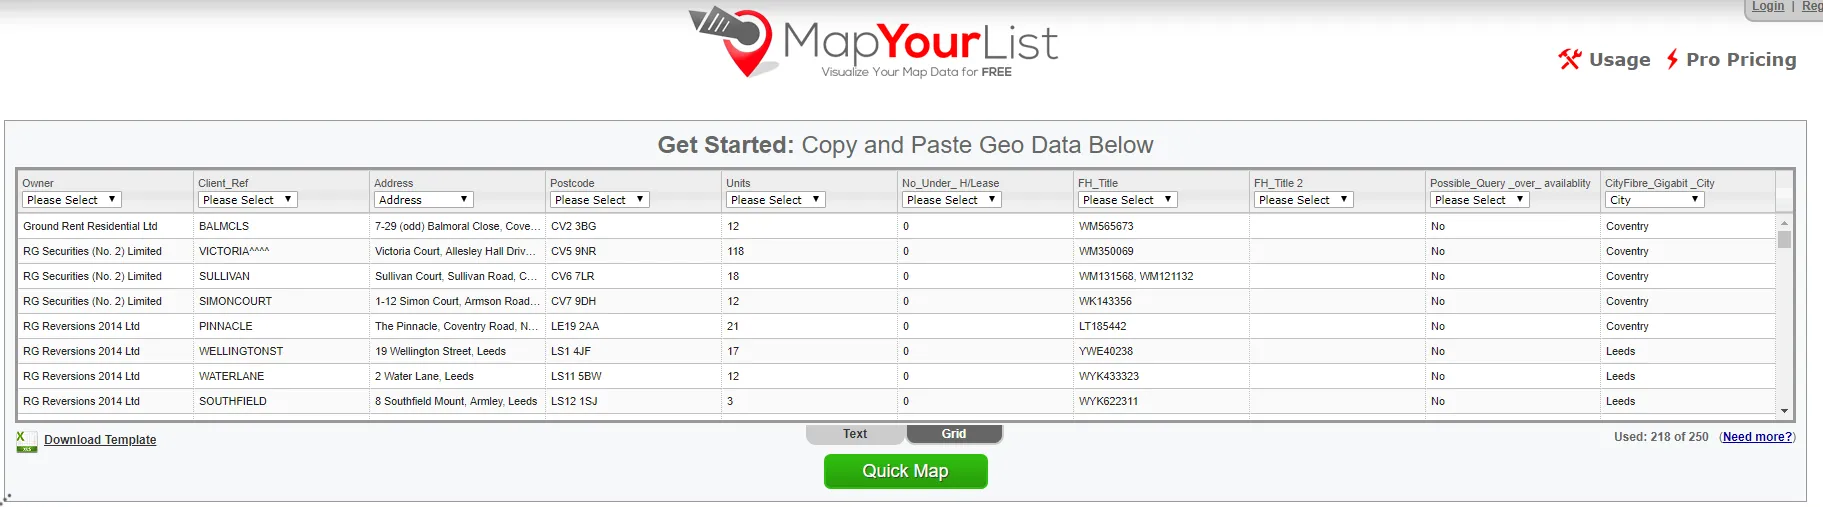
Pic. 8 Input our .csv data into the MapYourList tool.
Copying our .csv content into the MapYourList tool we must remember, that max. value of geotagged placemarks for free is 250. Otherwise, only the first 250 will be geotagged with any exceeds being omitted.
Once your data is ready, click the green button “Quick Map” below and see how your geotagging process is going (Pic. 8).
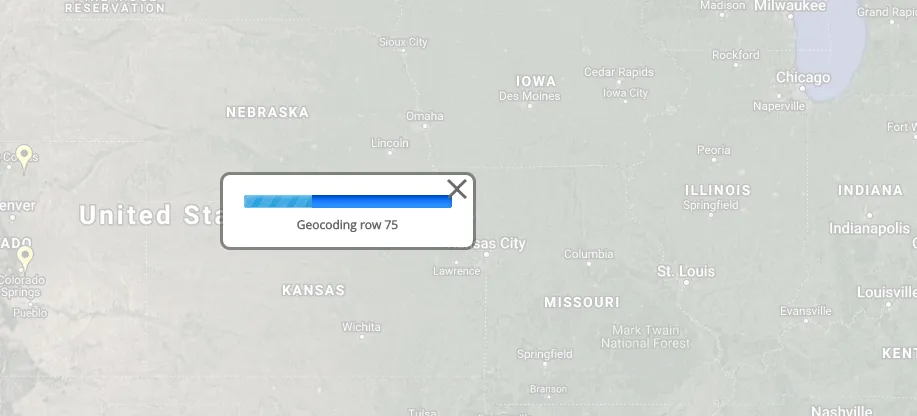
Pic. 9 Geotagging process in the MapYourList tool.
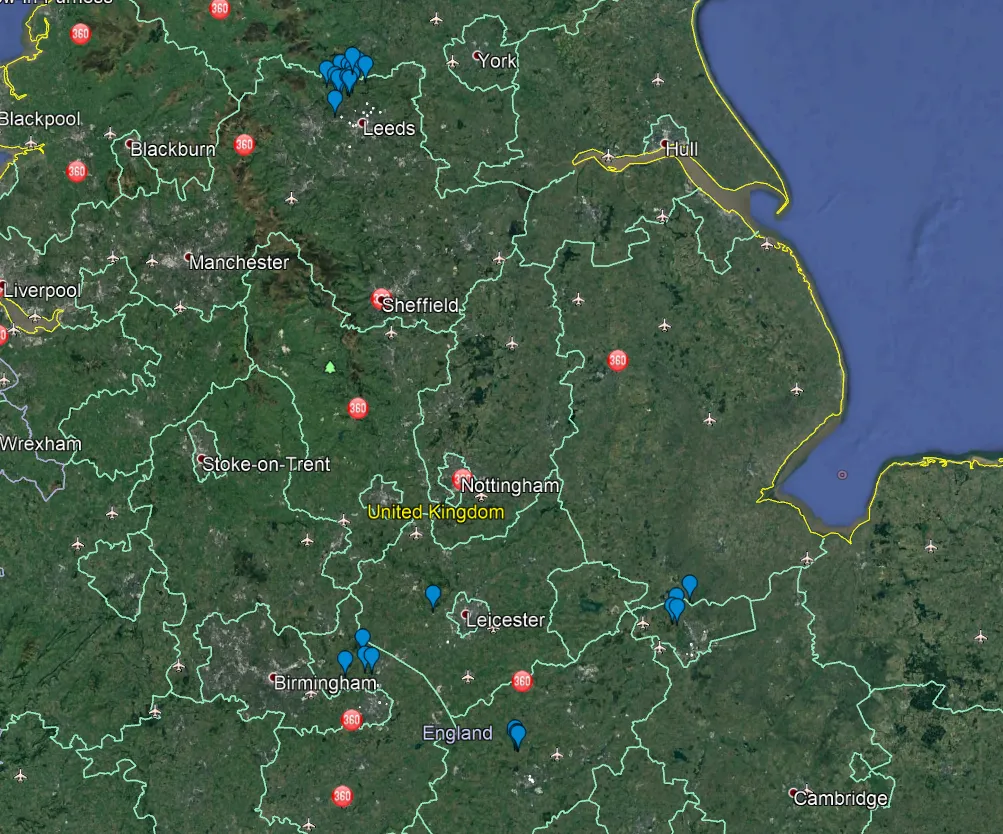
It may take a while when your list is big. Finally, you should have all the markers geotagged and visible on the map (Pic. 10).
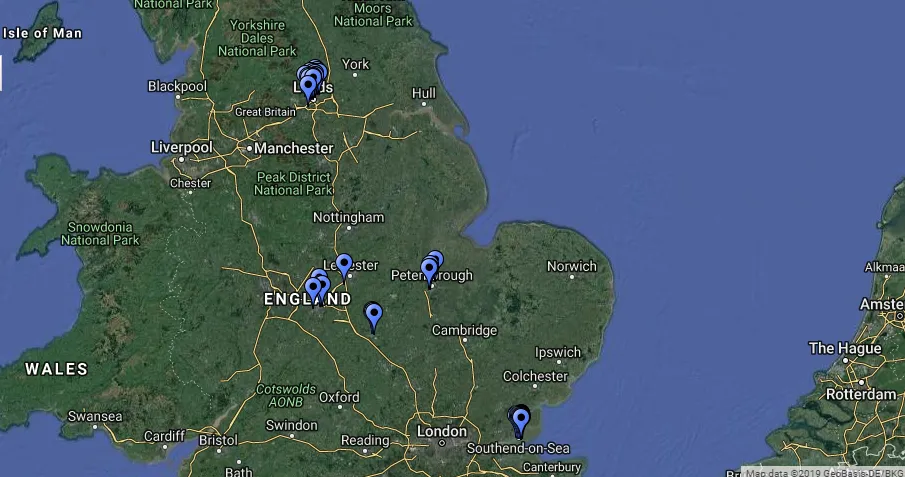
Pic. 10 Geotagged placemarks shown on the map.
The next step is saving these geotagged places as a .kml file, which is the most convenient output of the MapYourList tool (Pic. 11).
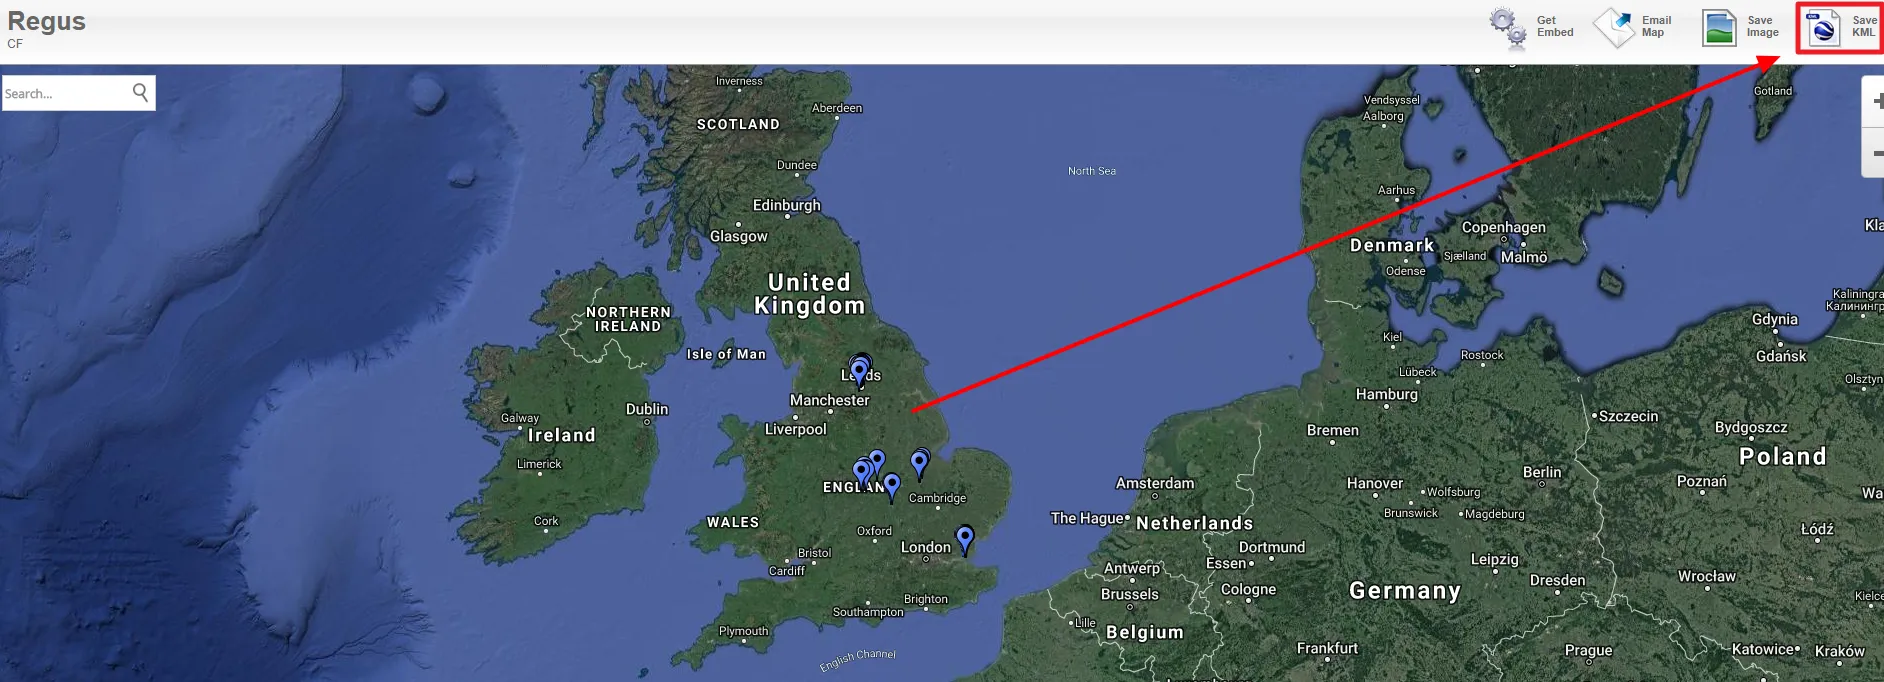
Pic. 11 Saving .kml files in the MapYourList tool.
After saving, your file is ready for conversion to the .json or .geojson format. See the example from geojson.io below for the time being (Pic. 12). I will show you also a different option later.
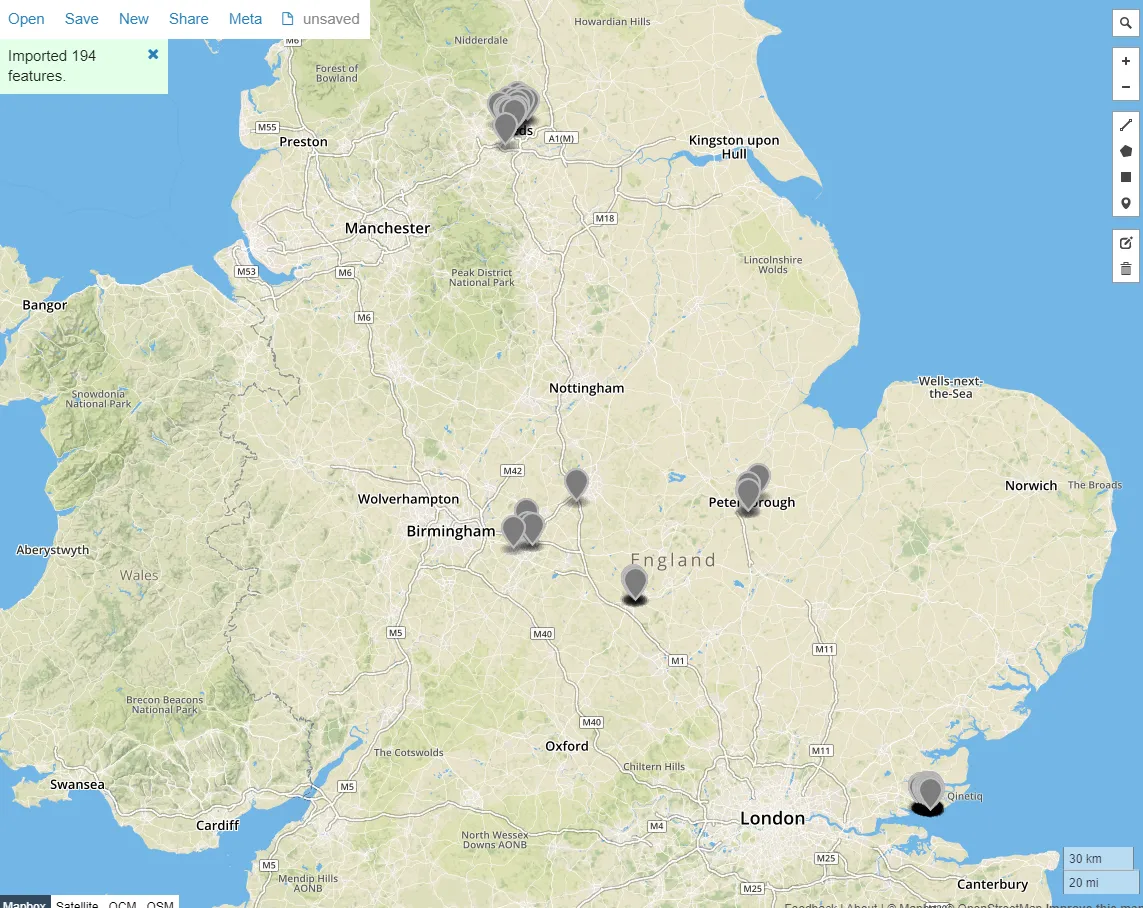
Pic. 12 Imported .kml data to the geojson.io platform.
Seeing a proper amount of features imported in the top left corner (other than 0) we are sure, that everything is alright.
If you are keen on using the MapYourList tool for more than 250 records you can split your bulk data into more than 1 piece and bind them as one after a whole process.
GEOTAGGING WITH GOOGLE EARTH
The geotagging process via Google Earth is based on the import of an MS Excel spreadsheet into this tool. Saving our data as a .csv file instead of using pure .xls (.xslx) is still required.
Compared with the MapYourList, Google Earth is capable of converting 10x more records, however as we know, this software is memory-consuming, so it can make your desktop slower for a while.
If you are coming through the “Import” option, the pivot thing is setting the Longitude/Latitude fields, which in our case should remain unknown, as we owe addresses only (Pic. 13).
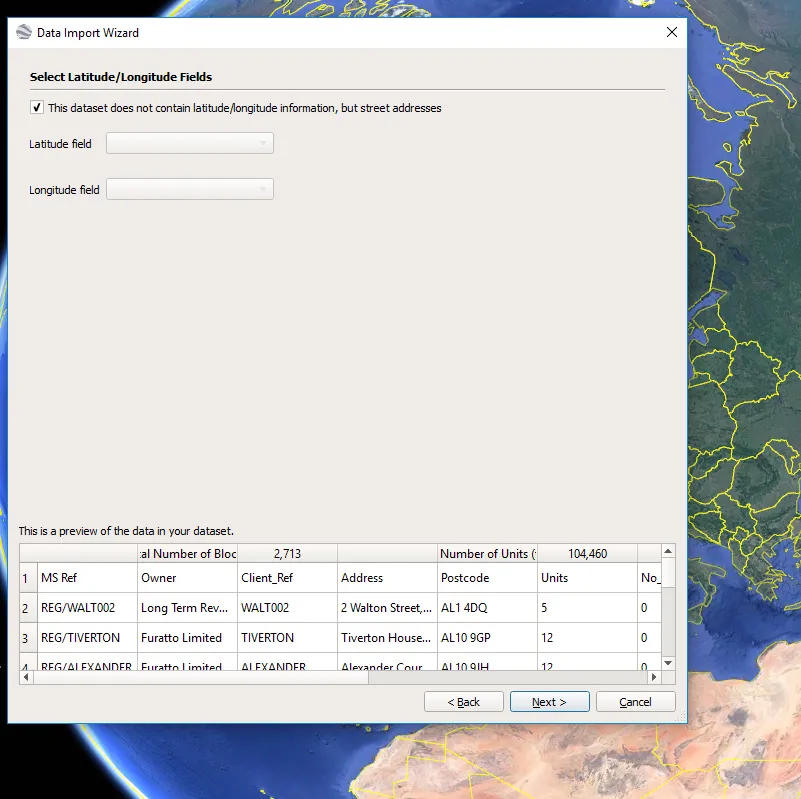
Pic. 13 Marking the Lat/Lot unknown, as we have only street addresses available in our data.
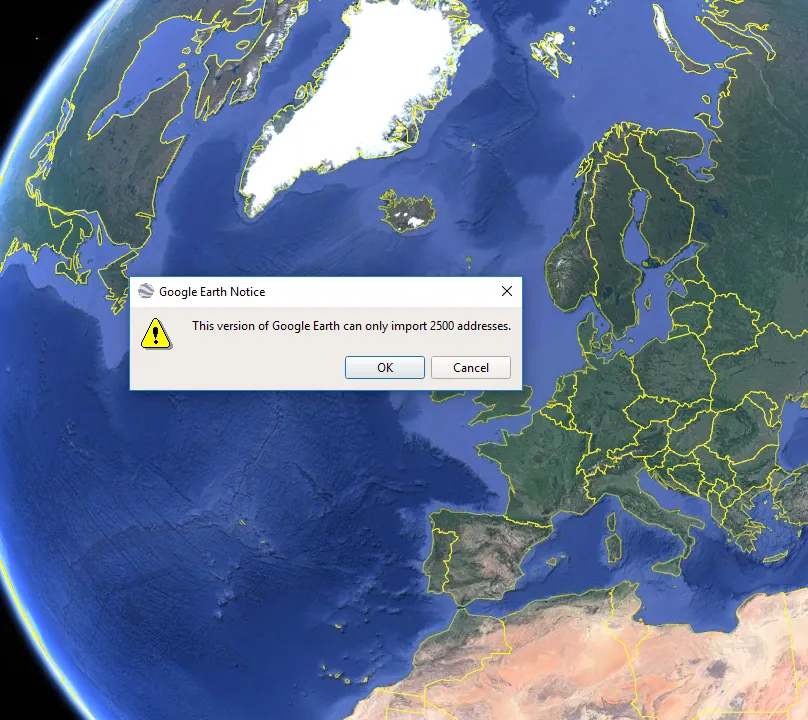
Pic. 14 Google Earth can geotag up to 2500 records (it can vary depending on the tool version).
Because our data is bigger than in the MapYourList example, we should wait longer for an output.
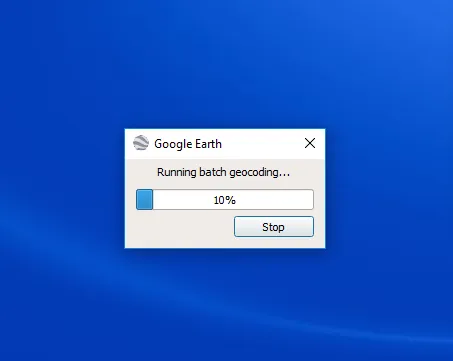
Pic. 15 Batch geocoding in Google Earth running.
Sometimes, when some addresses aren’t written properly, the application asks us about some small amendments (Pic. 16).
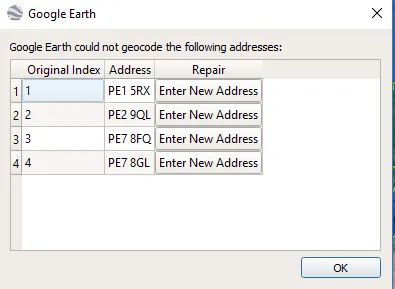
Pic. 16 Addresses alteration in Google Earth.
After these small fixes, our data should be ready to display in the application (Pic. 17).
Pic. 17 Geotagged data in Google Earth.
It looks like the geotagging issue we have already closed. Now is the time to make our data readable in the .geojson or .json format.
At the very beginning, I would like to tell you something about these 2 formats. Some people states, that the JSON and GEOJSON format is the same. It’s not true at all.
The difference between the GeoJSON and JSON formats has been clearly explained here. The code looks slightly different in order (Pic. 18).
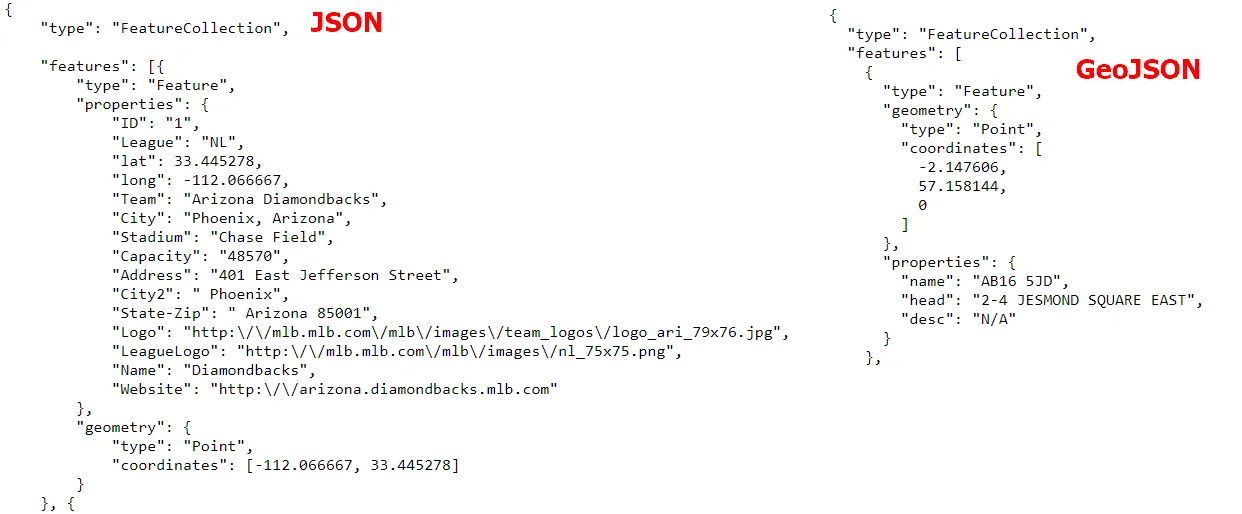
Pic. 18 The difference between JSON and GeoJSON code (gistechsolutions.com/mkrgeo.pl).
However, both formats can be used for data display purpose.
CONVERT TO THE GEOJSON FORMAT WITH GEOJSON.IO TOOL
Having our data geotagged, we can import them to the aforementioned geojson.io tool. Once everything is alright, in the top left corner, we should see a number of items imported other than 0 as well as the generated GeoJSON code on the right panel (Pic. 19).
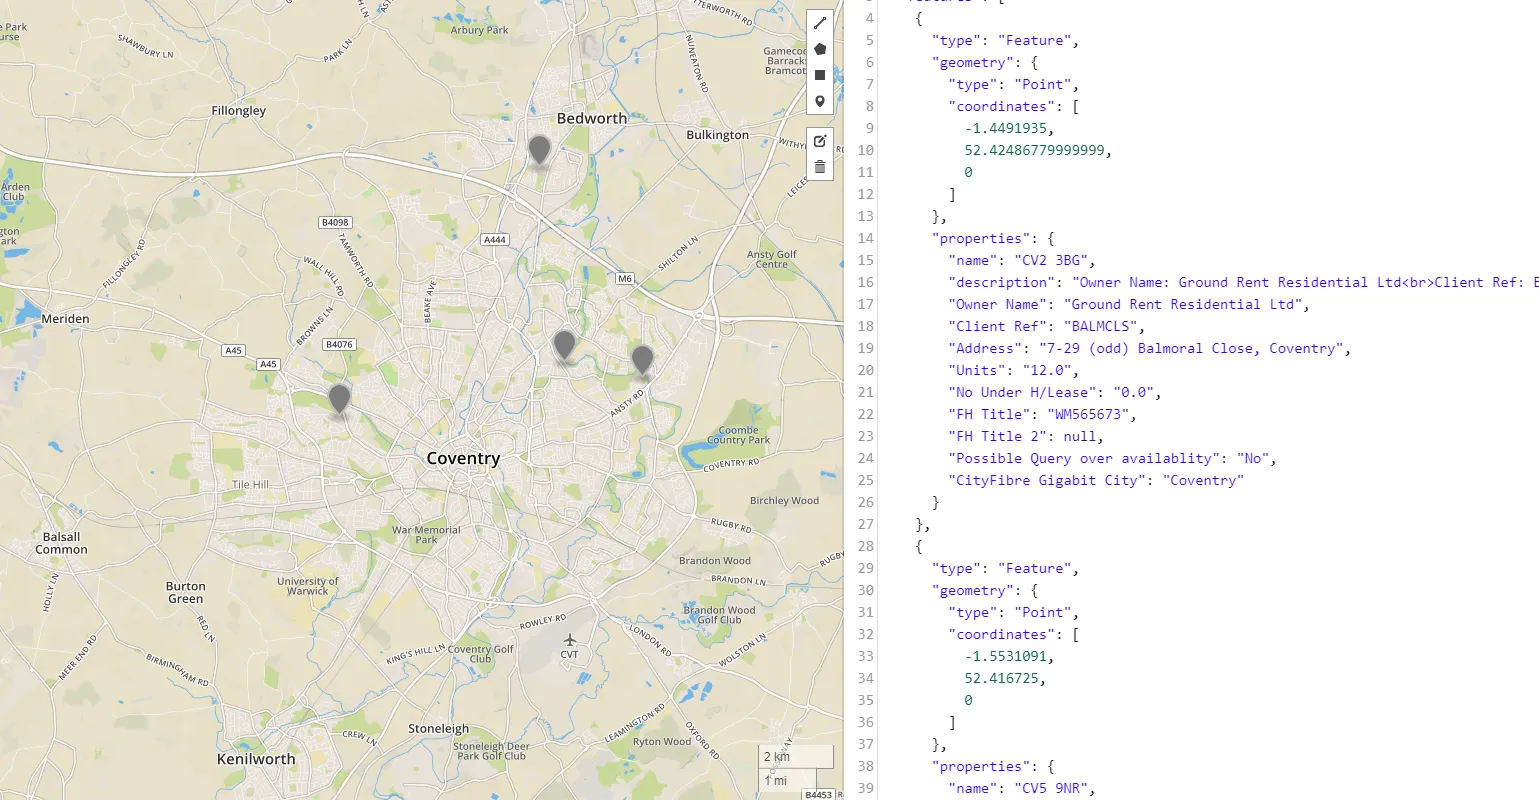
Pic. 19 Geotagged addresses with data imported to the Geojson.io tool. No spaces in the GeoJSON code are visible.
Now we can save the file in the .geojson extension, but we cannot easily show it on the JavaScript API maps, because as I discussed at the very beginning there are spaces between the “properties” names. We cannot have empty spaces in coding, so it’s advisable to change the column names initially in the MS Excel spreadsheet or put the “dash” between two separate phrases (Pic. 20).

Pic. 20 MS Excel spreadsheet with no spaces in the columns.
If we have our MS Excel spreadsheet columns sorted, then we can go through the steps shown above until we reach the geojson.io tool.
The GeoJSON code in the geojson.io tool looks nice, although after saving it’s minimalized (Pic. 21).
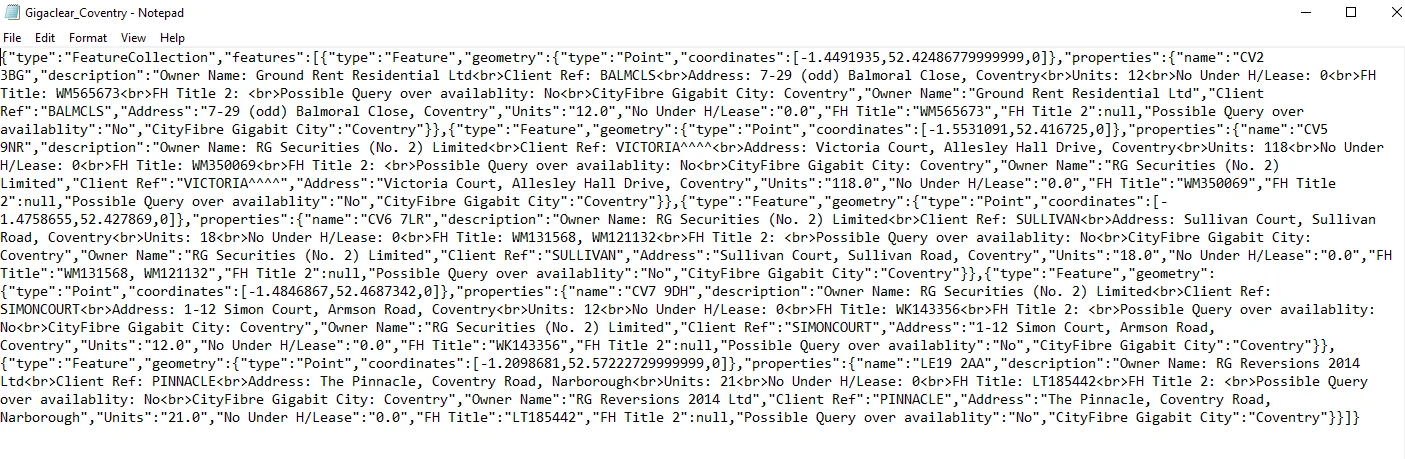
Pic. 21 Our downloaded .geojson file with minimalized code.
To have the same view as in the tool sidebar we must use the JSON Pretty Print Online tool. It makes our code pretty looking and easier to read. Alternatively, you can select and copy the GeoJSON code straight from the geojson.io right panel, paste it next to the Notepad++, and save.
CONVERT TO THE GEOJSON FORMAT WITH THE CONVERTCSV TOOL
Another easy tool, where we can quickly convert our files is Convertcsv.com.
There are 2 ways to get this issue sorted. The first one is more convenient and comes from our 1st converter, which is the MapYourList application.
Because we have already saved our .csv file there. Now this .csv file must be attached to the tool and converted into .geojson or .json format (Pic. 22).
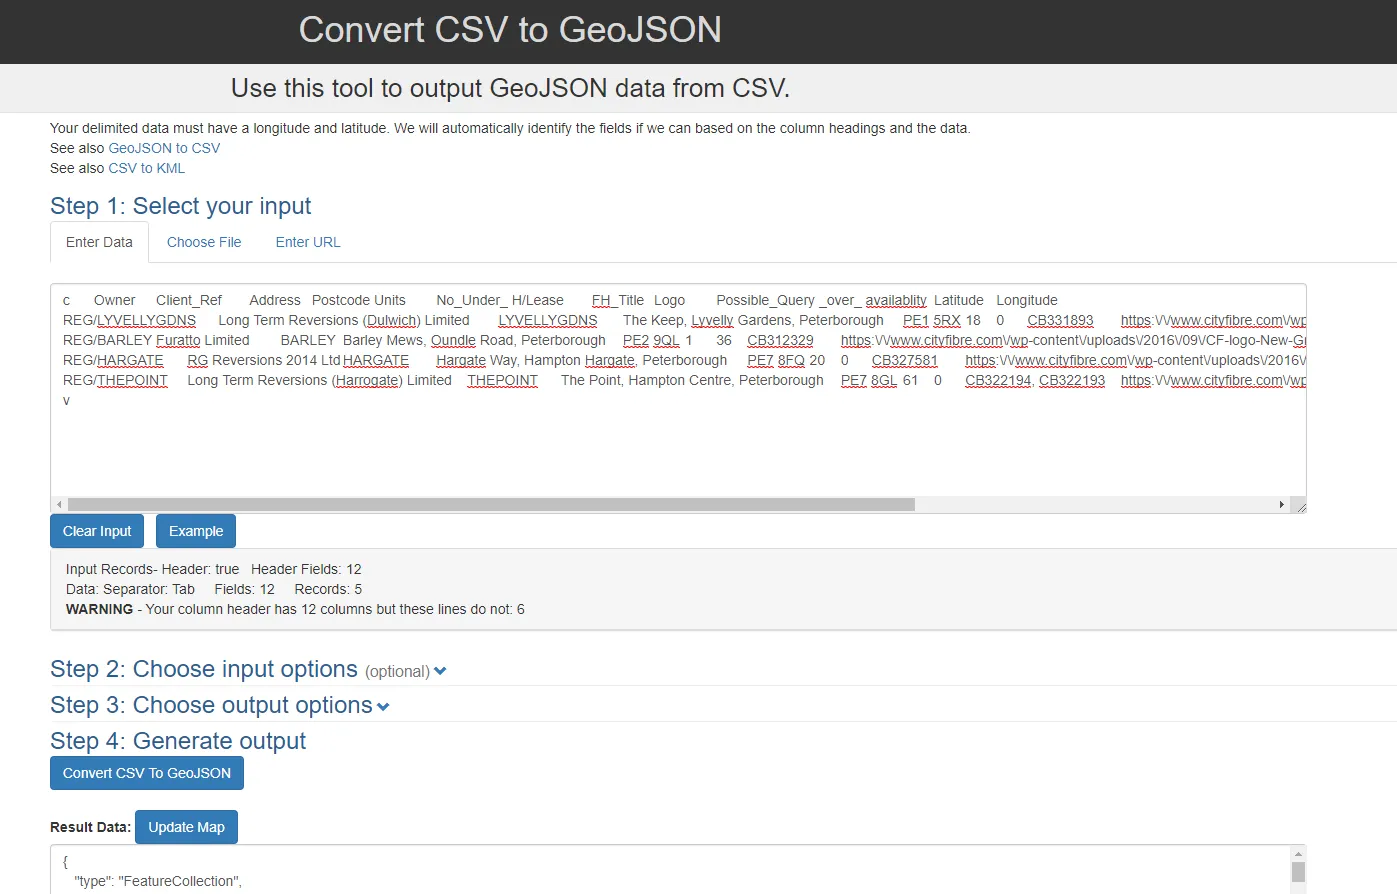
Pic. 22 Conversion from .csv to the .geojson format.
We can both paste our data when is not big or attach a whole file. In the “Result data” underneath you will see upcoming the JSON or GeoJSON code.
The code generated by the Convertcsv tool doesn’t need a pretty print option. It’s clear from the very beginning, so you can use it.
DISPLAYING OUR DATA IN THE LEAFLET OPENSTREETMAP API
Treat it as an example, because the .json or .geojson files can be easily displayed in the other Javascript map APIs too. Because recently I have been dealing with the Leaflet OpenStreetMap tool, the example will be shown on this platform.
I think the easiest way to fetch the .json or .geojson file in the map (that works also offline) is to create a variable in our .json or .geojson file and save it as a .js format (in JavaScript code) (Pic. 23).
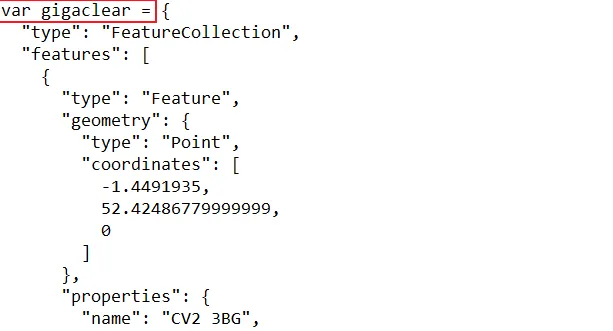
Pic. 23 This is how the JavaScript variable should look like when we want to have it fetched in our map. The variable defines our .geojson code inside.
Now, having another JavaScript code in our main map script we can launch our data (Pic. 24) on the OpenStreetMap tile.
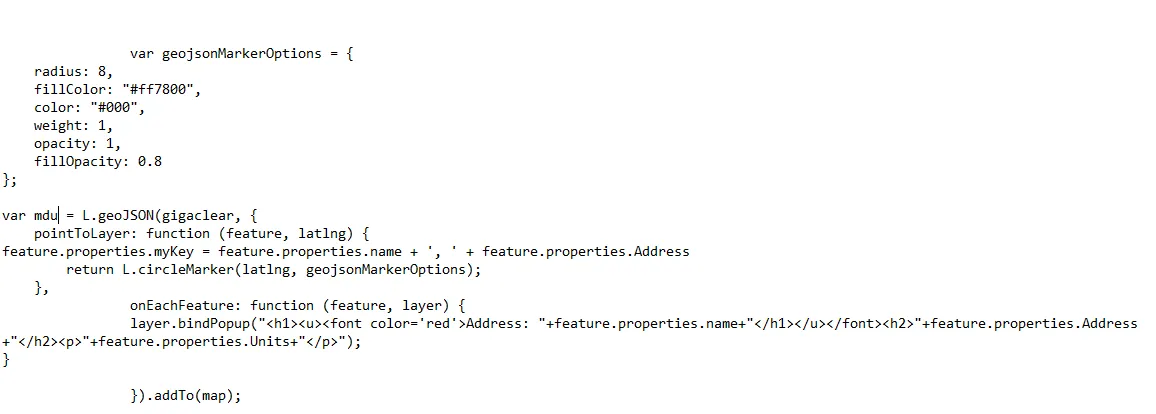
Pic. 24 Part of our JavaScript section in the main Leaflet OpenStreetMap code.
The variable (var) geojsonMarkerOptions will customize our placemarks, making them other than the default provided.
Another variable will contain the GeoJSON layer, which should come from the external .js file, where we set a variable for the GeoJSON data. The pointToLayer section determines our marker as well as its pop-up properties, based on the .geojson properties, whose names come from the MS Excel spreadsheet.
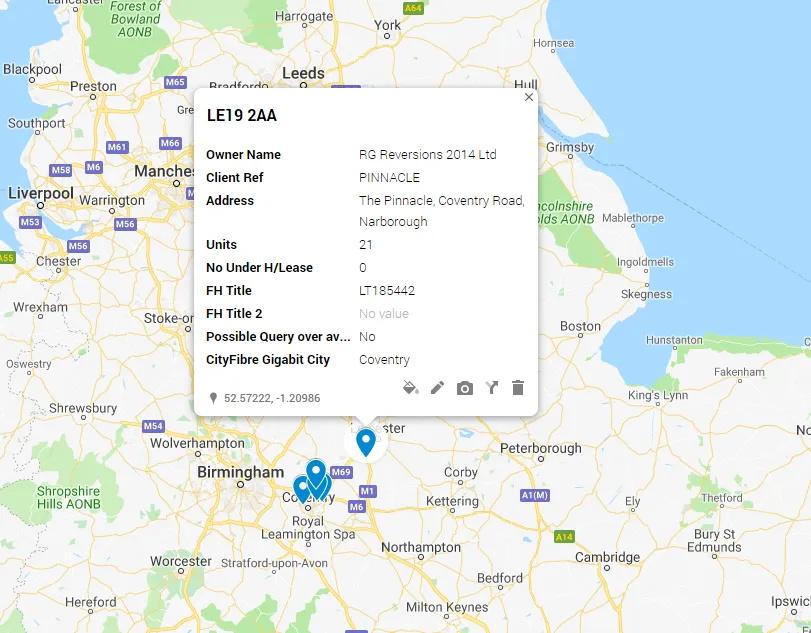
As an output, we should have a placemark with a popup window (Pic. 25).

Pic. 25 Displayed address data in the Leaflet OpenStreetMap that contains some of the .geojson file properties, coming from the MS Excel spreadsheet columns.
The names shown in the popup box come from the MS Excel spreadsheet columns. Now you know, that the very important thing is determining these column names at the very beginning, once our file is crude in .csv format. For sure, the popup field presents an example, that definitely must be tweaked up for better performance. At least you know, that the option, which I have been showing you in this article is quite easy to do.
The ways I have shown here are examples amidst more options available both in the web tools as well as GIS software. I have chosen the options, that do not require additional logins on some platforms, which could take time and also I focused on one of the easiest ways to do it. Thanks to this, you can make this georeferencing relatively quickly for your purpose.
Mariusz Krukar
Links:
- https://www.mapyourlist.com/
- http://geojson.io
- JSON-vs-GeoJSON
- http://www.json.org/
- https://geojson.org/
- https://jsonformatter.org/json-pretty-print
Wiki:
Forums:
- https://gis.stackexchange.com/questions/298570/exporting-layer-from-google-my-maps-as-kml-has-no-geometries
- https://gis.stackexchange.com/questions/115733/converting-json-to-geojson-or-csv
- https://gis.stackexchange.com/questions/68489/loading-external-geojson-file-into-leaflet-map
- https://gis.stackexchange.com/questions/199672/issue-in-loading-external-geojson-file-into-leaflet-map
My queries:
Read also:
- Input a multiple address list to Google Maps and Google Earth
- The fastest way to execute UK address list using MySQL and PostgreSQL