It’s still quite a lot of time to the 2026 total solar eclipse event, which has been already considered by me in terms of the possibility of seeing its impact on the atmosphere when the phenomenon happens below the horizon. However, the character of this path of totality requires attention far earlier than normal, as this type of situation doesn’t happen often.
The 2026 total solar eclipse is going to be specific due to several reasons, which I am going to explain in this article. All these reasons have their scientific background. Some of them could be also pioneers, observed presumably for the first time in history, taking into account the utter lack of any reports and nowadays also images. The essence of all these side phenomena going along with the totality event seems to be not only the proper attention but also the involvement of a dozen or so observers, able to manage this certain moment from different locations. I hope, that after reading this full article you will understand better my scientific intentions regarding the forthcoming unique total solar eclipse on August 12, 2026.
Before I start describing all these eclipse-related circumstances, we all should know what the 2026 total solar eclipse will look like in the geometrical sense.
- THE GEOMETRY OF THE 2026 TOTAL SOLAR ECLIPSE AND A BRIEF EXPLANATION OF THE GAMMA VALUE
The primary factor, which decides the nature of the totality path observed (or not) from the Earth’s surface is Gamma. The Gamma factor describes how the lunar (or Earth’s) shadow falls at the other body against its central alignment. Otherworldly the Gamma factor describes any “distance” of the shadow cone axis from the center of the celestial body (Earth in our case). This distance is measured as a fraction of the equatorial radius of the given celestial body. If the Earth’s radius counts roughly 6378km ( at the equator, although for the sake of simplification, we can consider Earth as the perfect sphere), it will mean, that for Gamma value 0,01, the shadow hits Earth around 64km north of the center of the planet. The center of the planet is the point, where the Sun is observed roughly overhead. It’s also important to know, that positive Gamma values mean north direction and negative south.
In order to understand the Gamma factor better, we should discuss where it comes from. For sake of simplification, we can assume, that for our current case the Gamma value is exactly 0, where the Earth’s center passes exactly through the axis of the lunar umbra. Now we could be curious how the situation will look exactly like a saros later. The saros is the period between two successive very similar eclipses or the period when the Sun, Earth, and Moon return to the same relative geometry. The length of the saros is 6585.3 days (18 years 11 days and 8 hours). After this period roughly, we can observe the Sun, Earth, and Moon in pretty much the same configuration. However, the saros period should be considered not only as the 223 synodic months period but also as the 242 nodal months (draconic months). The draconic months are the average period between two consecutive transits of the Moon through the same node. Because the lunar orbit is tilted about 5.14° against the ecliptic plane, it crosses this plane twice a month – during the ascending and descending nodes. The last lunar month which comprises the changing Gamma value is the anomalistic month, which corresponds to the perigee to perigee period. The position of the line of lunar apsides spins around its axis in about 3233 days (8.85 years), which means that the Moon will take a longer journey between one perigee and another, which is called the anomalistic month. Concluding, these three types of lunar months are not perfectly commensurate with one another. It turns the particular moment in the given saros slightly different than a saros earlier or later. In practice, the Moon’s node shifts about 0.48º eastwards with each saros cycle. In terms of the eclipses, we consider the saros cycle, which includes all the lunar saros resulting in any eclipse occurrence both lunar and solar. Usually, the saros series begins when the New Moon occurs about 17-18º east of the node. Then the average absolute gamma value is +1.55. Being granular, it varies between 1.53 (for total solar eclipses) and 1.57 (for annular solar eclipses). The lunar shadow misses Earth at about 3500km distance. If the absolute value of the Gamma is equal to or lower than mentioned earlier, the eclipse is visible from the Earth’s surface, usually somewhere nearby polar regions. For a lunar eclipse, if the absolute Gamma value is higher than 1.55, the penumbra misses the lunar surface completely. At the second saros, the lunar shadow falls about 250-300km closer to Earth, which will result in a slightly larger eclipse magnitude observed. Next, after about 10 saros cycles (over 180 years) the shadow or antumbra will occur near the pole. After another 700-1000 years, the central solar eclipse will be observed, however, every single saros will make them displaced with respect to the Earth’s center by about 250-300km. After other several ages, the shadow occurs in the opposite polar region and leaves the Earth’s surface in successive saros. The last 10 saros periods round off the saros cycle effectively, as the penumbra goes gradually away from our planet. Another Gamma value variation is related to Earth’s position against the Sun. It was found, that the Gamma value changes tend to be larger when Earth passes its aphelion. In the opposite configuration – the perihelion, the Sun’s apparent motion is higher and may reduce the eastward shift of the node. This situation is driven by the eccentricity of Eart’s orbit. Formerly it causes even reversing the direction of the Gamma value for nodes falling around the moment of perihelion.
Regarding the saros 126, which part is the 2026 total solar eclipse (occurring at the descending node), we should consider also another feature, typical for high absolute gamma values. Looking at the pattern below, as well as here we can see the gamma value relation with the solar azimuth, at which the greatest eclipse takes place.
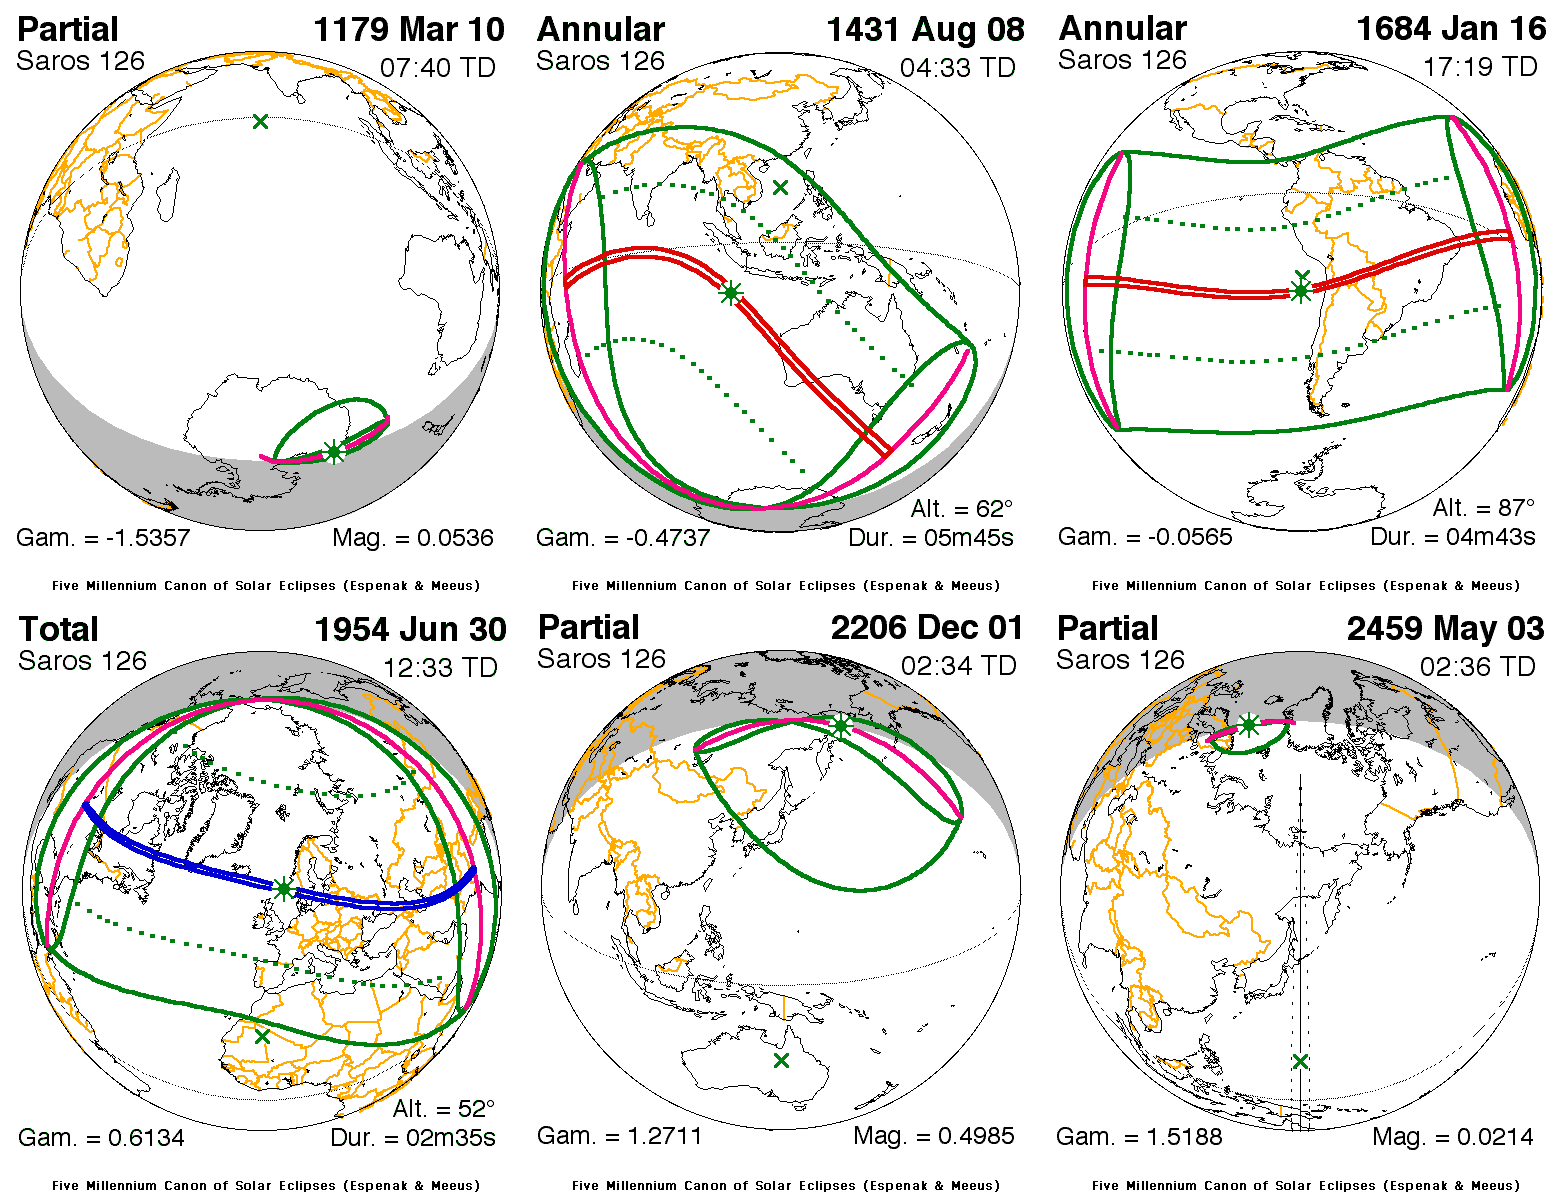
For eclipses with a gamma absolute values about 0.9 and higher, we can see the umbral path movement just at one part of the day (morning or afternoon) instead of throughout a whole day (from sunrise to sunset). In order to grasp it better, I presented the examples below, which include 3 eclipses (Pic. 2).
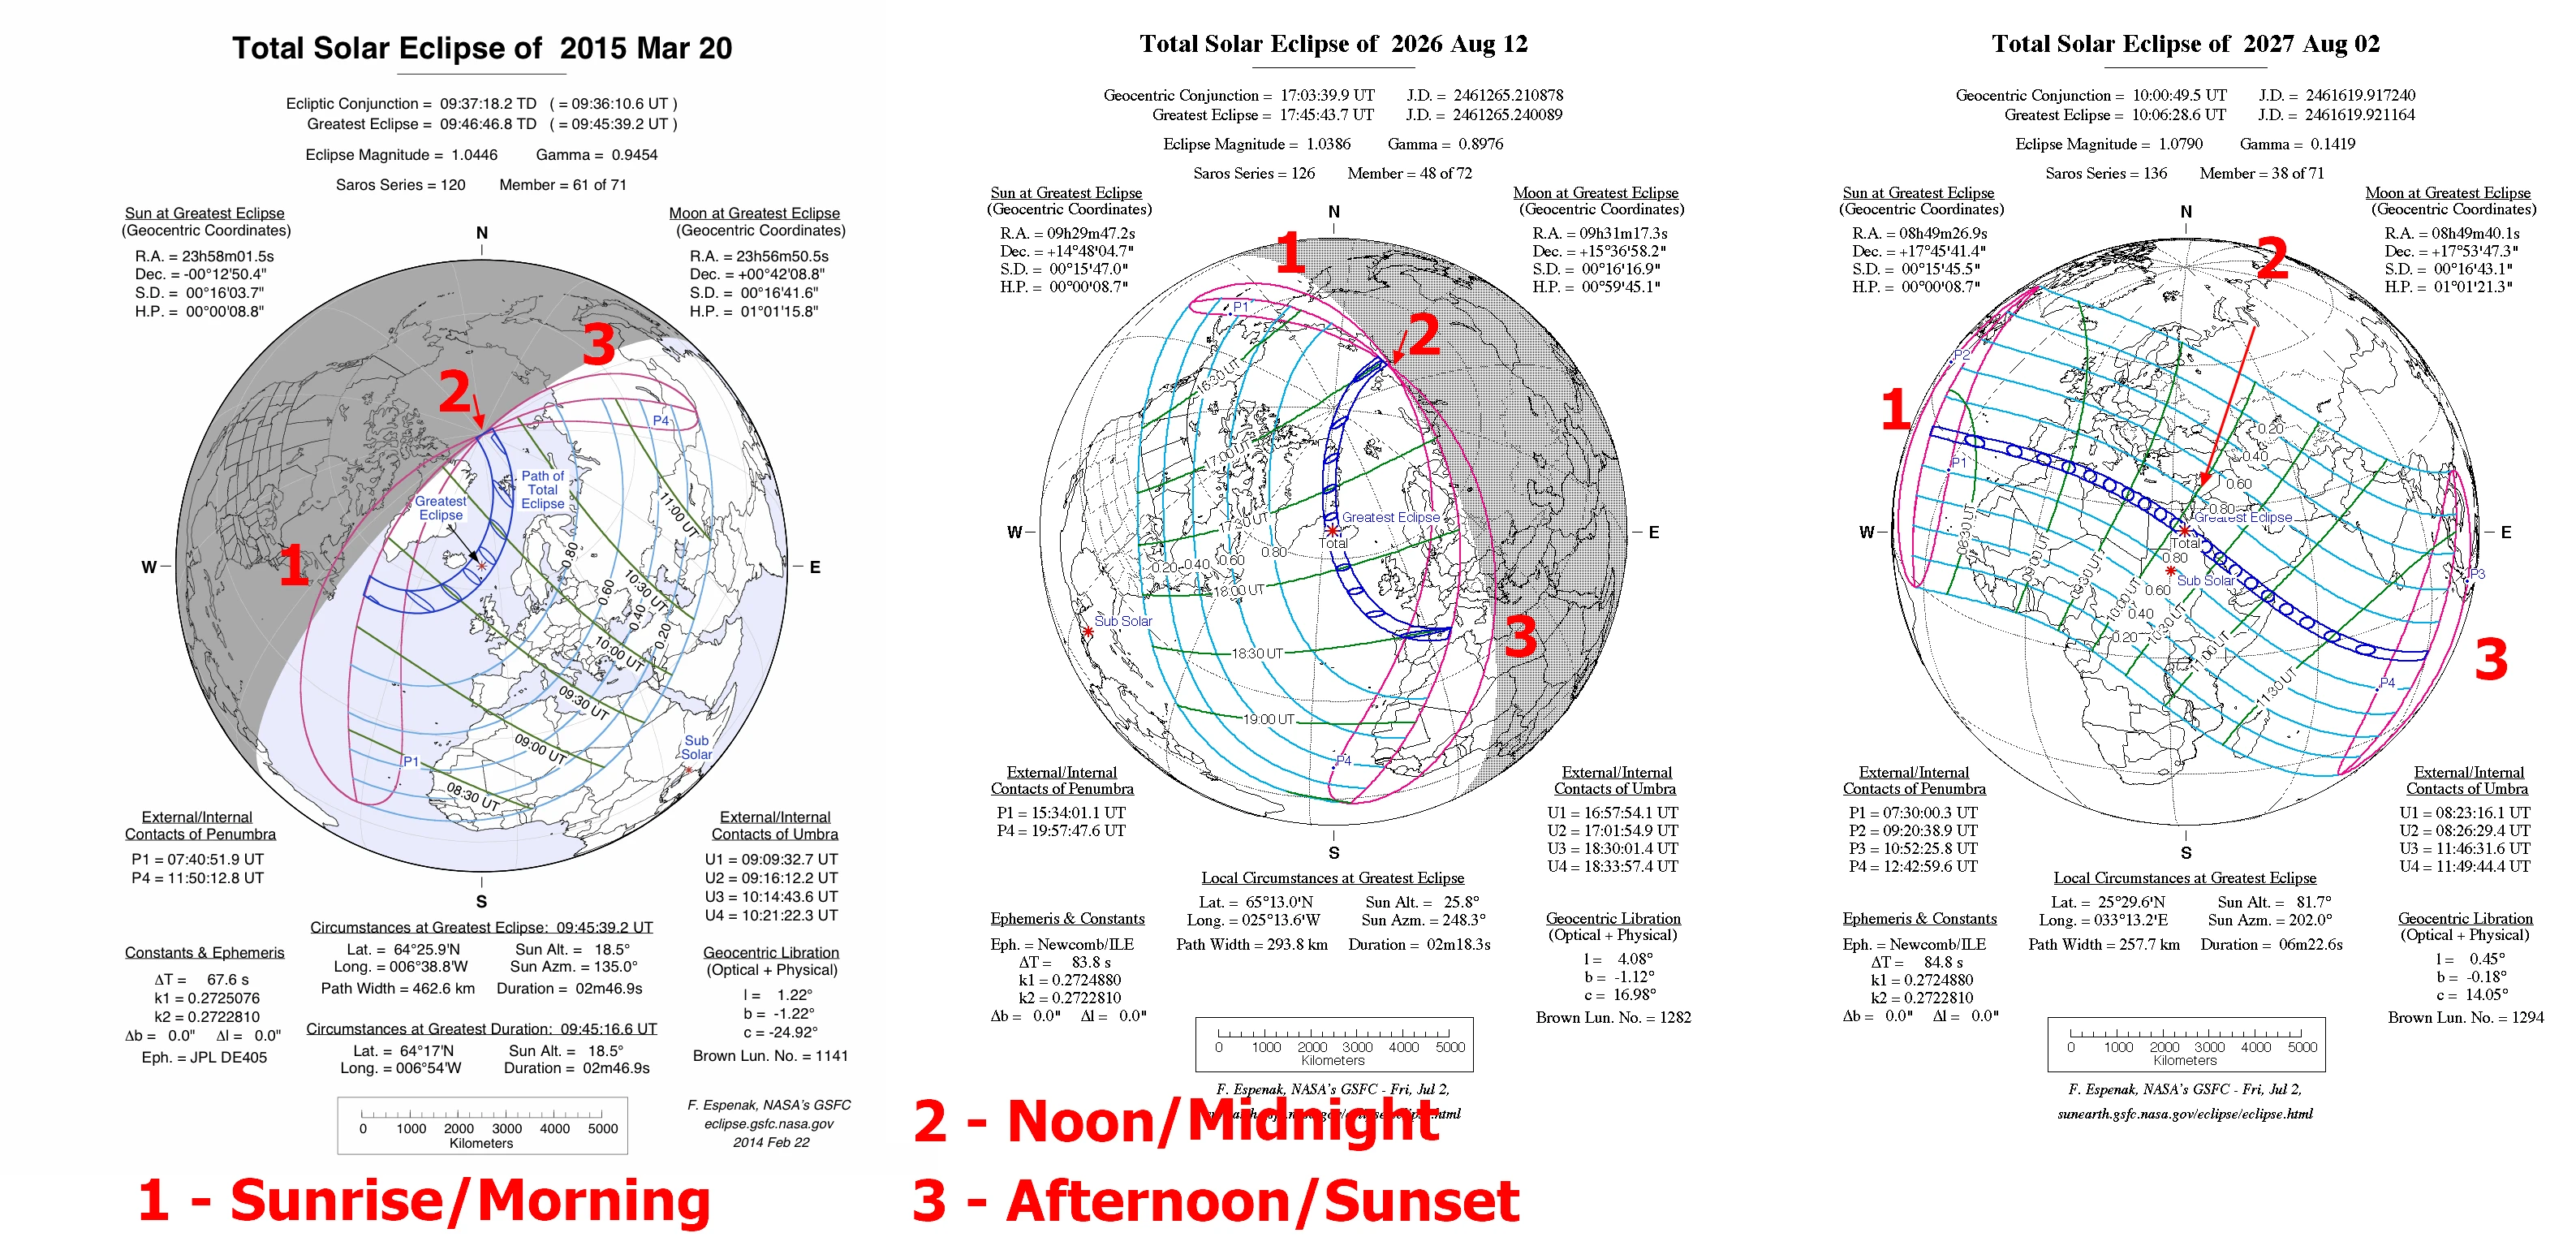
Obviously, the Gamma value is not only one factor here, and all the geometry aspects related to this situation as well as the general shape of the umbral (or antumbral) path across the Earth’s surface will be definitely explained in the future. This thread is much longer and requires a separate paper for a detailed explanation of all these components. For the 2026 total solar eclipse, it’s enough to know how the high gamma value shapes the Moon’s shadow way in the considered part of the Globe.
The 2026 total solar eclipse will occur in the northern hemisphere and almost a whole event will take place during the afternoon hours. This is the specificity of this eclipse as shown in the pattern above (Pic. 2) and below (Pic. 3).
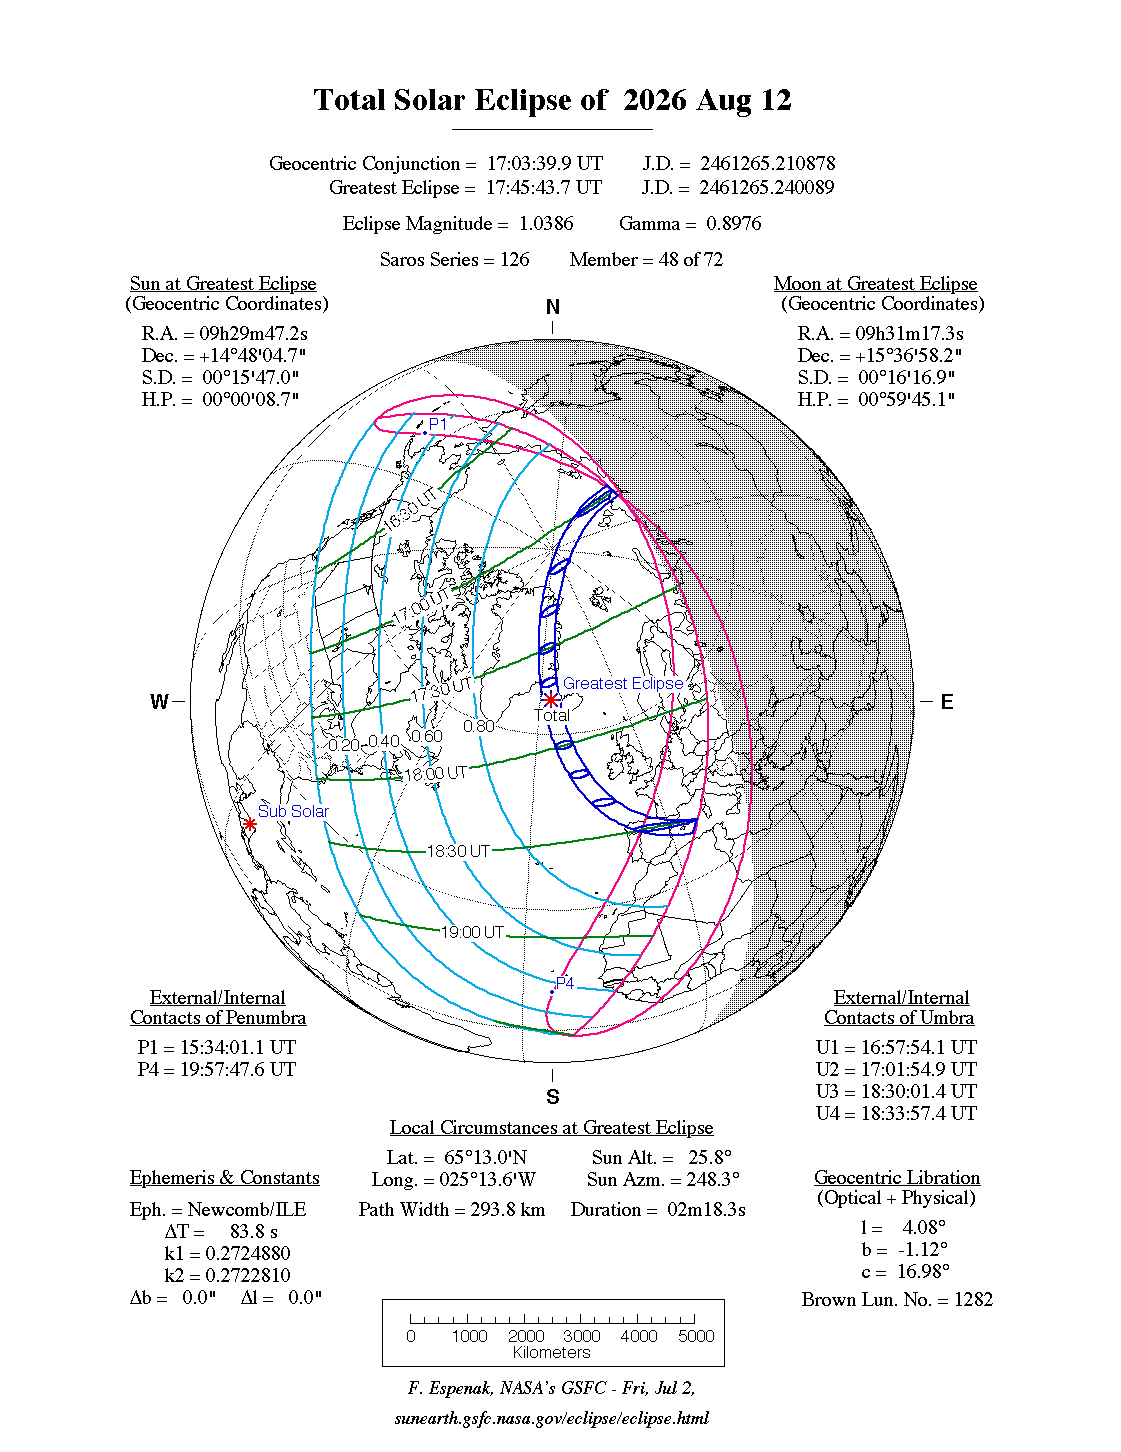
The eclipse begins briefly after midnight local time and shifts shortly towards the western sky sphere which participates as the afternoon event upon its disappearance at sunset east of the Balearic Islands. The High absolute Gamma value means also a deep partial eclipse in the areas beyond the eclipse path. Due to Earth’s curvature, the distance between the areas with a certain eclipse magnitude is longer between the umbral path and terminator line than outside of the umbral path. Considering the 2026 total solar eclipse, all the areas located beyond the path of the shadow will experience a deep partial eclipse with a magnitude of at least 0.83. Umbra will move close to the northern limit of Earth’s disk, although due to the descending node combined with summertime in the northern hemisphere, the central duration will fall a bit south, as you can see in the attached video below. The video clearly depicts the umbral movement at the descending node, which could be seen by an observer standing on the Moon.
The simulation of the 2026 total solar eclipse for an assumed observer standing on the Moon (credits: Dominick Ford/in-the-sky.org).
Watching the simulation above, you can better understand what I meant by writing “beyond the umbral path”. It’s the area between the path of totality and Earth’s terminator defined here by its limb. This part of the planet will be shaded by a deep penumbra, which will make it relatively darker than the area located outside of the eclipse path, towards the geometric center. The smaller amount of light in that area will be caused not only by the eclipse magnitude but also by the low altitude of the Sun. In turn, this will be the difference between the area falling within i.e. 0.9 eclipse magnitude, and the same area on the other side of the umbral path. It may be noticeable in sky surface brightness measurements.
Another thing is the quite significantly curved path of totality, which is predominantly driven by Earth’s rotation. It’s also the subject of detailed explanation in the future.
After this sample of geometry, the essence of the 2026 total solar eclipse should be more clarified for you.
2. IMPORTANT OPTICAL OCCURRENCES ACCOMPANYING THE 2026 TOTAL SOLAR ECLIPSE
In terms of the rareness of the 2026 total solar eclipse, which arose out of its geometry discussed earlier, there are several valuable optical responses possible to watch both within the path of totality as well as within the illuminated atmosphere of our planet. They were listed and described below in detail.
I. TOTAL SOLAR ECLIPSE AND AURORA BOREALIS (NORTHERN RUSSIA) – In the theoretical sense it could be the best occasion to see these two spectacular phenomena at once. I don’t want to conjure you, that it’s fairly possible, especially without any reasonable explanation of the aurora occurrence.
If we want to consider the visibility of the total solar eclipse and aurora borealis at once, we should have some knowledge about the brightness relation between the sky during the total solar eclipse and the maximum possible brightness of the aurora. The aurora is caused by the interaction of atmospheric gases with solar wind particles. Otherworldly it’s a collision between energetic electrons and molecules in the Earth’s ionosphere. As a result, we can see a beautiful display of the lights in the sky, where oxygen gives the green and red light and nitrogen a blue and purple light accordingly.
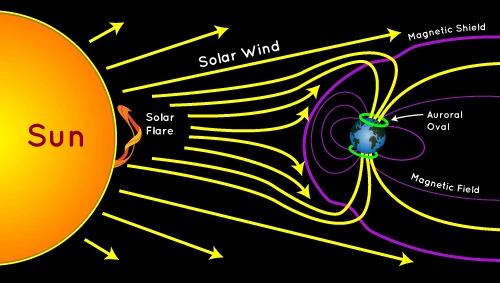
The brightness of the Aurora, the same as the airflow is defined by the International Brightness Coefficient (IBC) – the convenient logarithmic classification system, which includes effectively 5 levels of light radiance expressed in the Rayleigh (precisely – the kiloRayleigh – kR) units. The Rayleigh is a radiometric unit, which defines the photon flux and measures a faint light emitted in the sky. In order to better understand the Rayleigh radiometric measurements, it’s vital to convert them to some photometric units, as discussed in this article. Conversion between radiometric and photometric units is not straightforward due to the spatial distribution of light, which plays a pivot role here. The biggest correspondence of the Rayleigh unit can be with the S10vis unit, which measures the intensity (surface brightness) corresponding to one star of 10th (visual) magnitude per square degree of the sky (Kraus, Mc-Graw Hill, 1966). Turning the S10vis unit, we should receive 6.9 * 10-7 Nits – 0,00000069 Nits. The Nit replaces the basic SI unit for luminance, which is candela per square meter (cd/m2), and defines how much light an object emits. The Lux unit measures how much light is received from an object (Pic. 5).
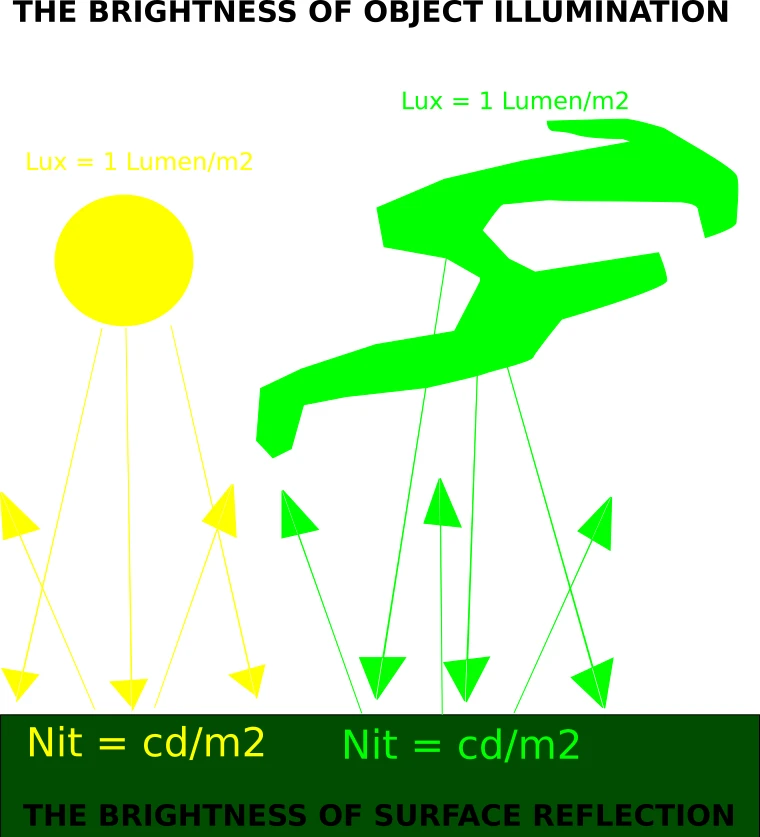
If we want to receive the number of Lux from Nits, we should multiply the Nits by the Pi value. If in our case the S10vis unit counts 0.00000069 nits then 0.00000069*3.3.14159 = 0.0000021676971 Lux.
1 Rayleigh unit should correspond to 0.07 S10vis units. In this case, the 1 Rayleigh will be equal to 0.000000151738797 Lux. In this transformation, we also should remember the Angstrom – a metric unit of length, which is also used for measuring the visible light wavelength (between 4000 and 7000A). The aforementioned conversion applies to monochromic radiation at 5577A, which as a standard reference corresponds to a strong green oxygen line (Omholt, 1971). We obviously have some exceptions, where aurora might have a red border or shine in red, although for our concerns, we can take the green oxygen as the primary color of this phenomenon.
Another, closer approach can be played between the S10vis and mag/arcsec2 unit, as both of them measure the surface brightness. In extreme cases (estimation for diffused galactic light), the surface brightness might be as low as 9 S10vis unit, being equal to +25mag/arcsec2.
Having this basic knowledge about the transformation between the radiometric and photometric units, we can finally describe the classification of aurora brightness.
The first level (IBC0) applies basically to the situation when the human eye is unable to see the shining object (or area) properly, being defined as the “subvisual”. It’s related predominantly to the night sky (except for stars and other celestial bodies), whose intensity reaches about 250R along with the corresponding radiance at 557.7mm (Shaw et al., 2009) or alternatively. The aurora brightness is classified between 4 remaining IBC levels, where:
IBC1 – corresponds to the faintest and usually, patchy aurora, which is about 3-4 times brighter than the normal airglow (Mieghem, 1961). It describes the aurora activity up to 2 Kp-index. This scale is equal to the object or area of the sky, which has a white appearance. A good example here can be the Milky Way, in which predominant light radiance is equal to 1kR (upwards to a few kR) or 70 S10vis unless we consider the galactic equator, which lifts up these values to the range between 160 and 640 S10vis. This level remains mostly beyond the ability of human vision when an observer is located in a light-polluted area. The surface brightness varies here between +23,5 and +21,5 mag/arcsec2.
IBC2 – this level features the commencement of color vision, obviously under the sky free of light pollution. Here the observed aurora looks like a homogeneous arc. This level corresponds to about 10kR or 700 S10vis brightness indicating i.e. thin moonlit cirrus clouds. The surface brightness, in this case, hovers around +21mag/arcsec2. The aurora activity corresponds here to the 3 Kp-index with pale green coloration visible.
IBC3 – this level corresponds usually to a bright display i.e. moonlit cumulus cloud. The brightness here reaches 100kR or 7000 S10vis or the range between +19 and +18 mag/arcsec2. In the case of the aurora, we can see a bright and colorful aurora display, in which bright stars don’t shine through, as it reaches 0.0151738797 Lux brightness, like twilight glow when the Sun is about 11 degrees below the horizon. It can be the 5-7 Kp-index with constant display and obvious coloration. It does happen quite often in polar regions.
IBC4 – The brightest level, where in extreme cases the light intensity might be equal to full moonlight, reaching about 1000kR or 70000 S10vis with surface brightness reaching about +16mag/arcsec2. In turn, the objects are bright enough to cast a shadow, which means total illumination of the scene. The occurrence of such bright aurora is rare, unfortunately. If occurs for 8-9 Kp-index. The brightest auroras can reach 0.151738797 Lux, whereas the overhead full Moon illuminance is 0.267 Lux. In practice, this value will be equal to the twilight glow when the Sun is around 8,5 degrees below the horizon. In extremely rare cases an observer can read the newspaper, as happened in 1859 when some people were even awoken by auroral light (Green et al., 2006) or in East Asia in 1770 being “As bright as a night with a full moon” (Ebihara et al., 2017). Everything is possible when we have no light pollution or moonlight. Aurora can shine through thin clouds too. The extremely bright auroras happen when we experience the discrete auroras. They usually form discrete auroral arcs and can be found deep inside the aurora oval or at the poleward border of the wide (so-called double) auroral oval (Yahnin et al., 1997). The auroral oval is a narrow horizontal band of light up to hundreds of kilometers long, usually oriented from geomagnetic east to west (Considine, 2005).
The aurora represents some specific forms, featuring their own particular emission lines and bands, therefore it’s hard to translate the intensity of aurora to total emission, thereby hard to measure the brightness. On the other hand intensity of a particular auroral form depends on the direction, from which it is observed (Omholt, 1971).
Next to the brightness, important is also the duration of the aurora. Short-lived aurorae (up to one hour) seem to be much more frequent than long displays (Chamberlain, 1961). This is important from the eclipse point of view because we won’t know until the last time about the aurora’s appearance within the eclipsed section of the sky. On the other hand, short-lived auroras often have high intensity. The greatest concentration of aurora occurs during some brief outbursts with vivid motions of rayed bands. We should also remember the location against the magnetic field lines. Usually, when watching aurora further from the zenith, it can look fairly faint unlike those observed directly along the magnetic field lines (Romick, Belon, 1967). The auroral zones encircle the geomagnetic poles at roughly 23 degrees (Omholt, 1971). They appear also within these zones but with less frequency and intensity. Moving equatorward from the auroral zones, their intensity and frequency fall abruptly. From a big distance, aurora can be perceived as some luminous cloud with a certain surface brightness.
The typical development of the aurora along the magnetic fields starts from emerging the homogeneous arc, classified as the IBC2 level, and elongating approximately along the E-W direction, which next after at most several hours can turn into an intensive form of bands moving rapidly across the sky. The aurora can shift throughout the entire sky even within minutes. Finally becomes fainter and irregular (Pic. 6).
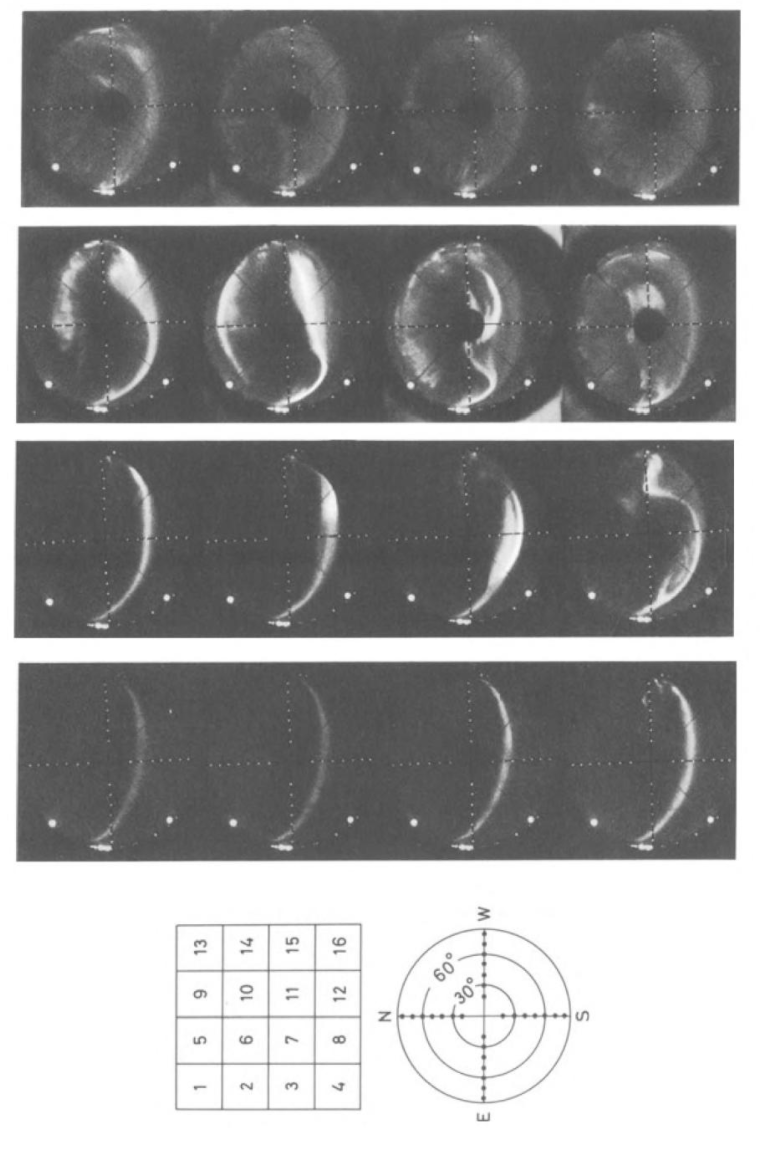
The intensity of aurora is primarily caused by sunspots, especially large sunspot groups passing across the solar central meridian as seen from Earth (Craig, 1965). Furthermore, the aurora display tends to recur after about 27 days, which corresponds to the synodic rotation period of the Sun in its low latitudes (Dixon, 1939). Some correlations might be also with the 29.5-day lunar period, however, it’s only explained by much better conditions for aurora observations during the moonless night. The solar sunspots are marked by intensive magnetic activity which is released by the gassy ejection and solar wind. Next, the solar wind shapes the conditions in the magnetosphere. The solar wind varies in intensity and depends on solar activity, which changes in its cycles. Nowadays the Sun entered its 25th solar cycle. Every solar cycle lasts around 11 years and includes solar maximum as the period of greatest activity and solar minimum as the moment of least solar activity in the given period. The solar maximum for the 25th cycle is going to fall around the 2025 year (Pic. 7), which is perfect in terms of considering the 2026 totality.

The prospect of the total amount of sunspots in 2026 is really promising, as we shall expect more than 100 in the 2nd part of the year. It makes a big likelihood for the brightest auroras possible to happen, driven by great magnetic storms. At time of high activity, the aurora might cover a whole sky poleward or even stretch to the zenith, which would be really beneficial in terms of the eclipse. We are definitely talking about the Kp-index 8 and 9 auroras, where the Kp-index is the semi-logarithmic scale based on the average variation of the magnetic field (Bone, 2007).
The aurora brightness comparisons made above with their strong correspondence to the brightness of the twilight glow, refer mostly to the sky in the solar direction. The sky located at the zenith is significantly darker, therefore the aurora shouldn’t be washed out at the same moment, as concerned above. For the observer, it should appear earlier after sunset and be visible a bit longer at dawn.
Taking into account the eclipse path location, especially its commencement in northern Russia, the important factor is definitely the magnetic pole location, which travels across the Arctic Ocean (Pic. 8). In 2026 the pole will be located closer to the Severnaja Zemya and Taymyr Penninsula, which is to experience the eclipse as a first near the midnight sun moment.
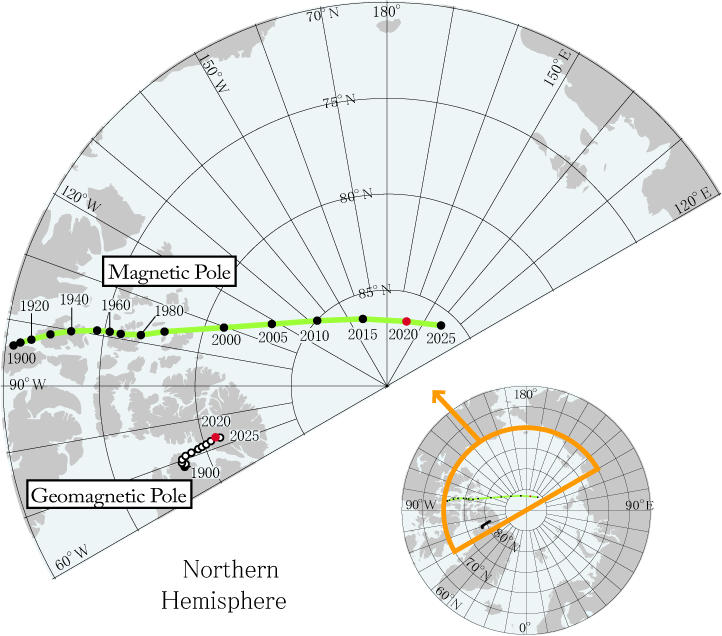
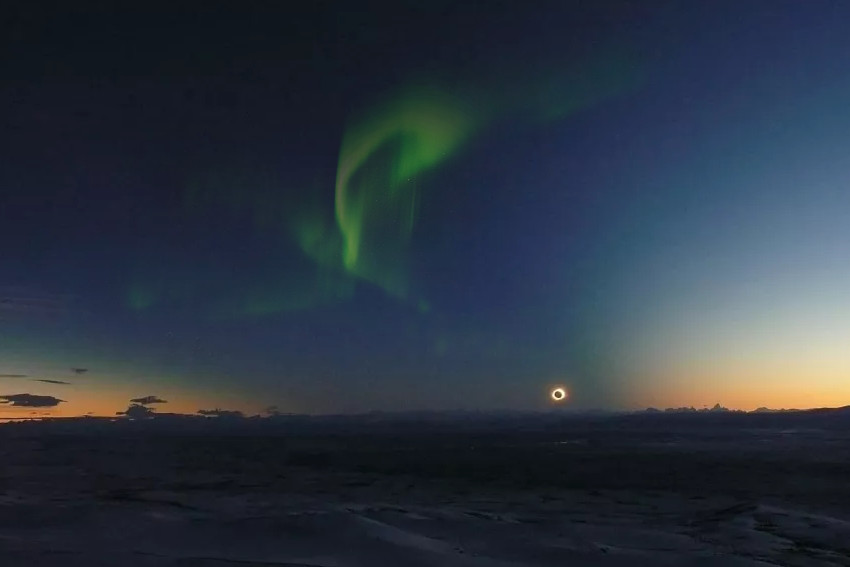
Therefore, the aurora oval should be pushed southwards. For an observer watching the totality at midnight from the Taymyr Peninsula, aurora presumably could appear at the southern part of the sky, high above the horizon, where the sky is the darkest. Having the fish-eye or wide-angle lens, the observer could be capable of catching the totality and aurora in the same frame (Pic. 9).
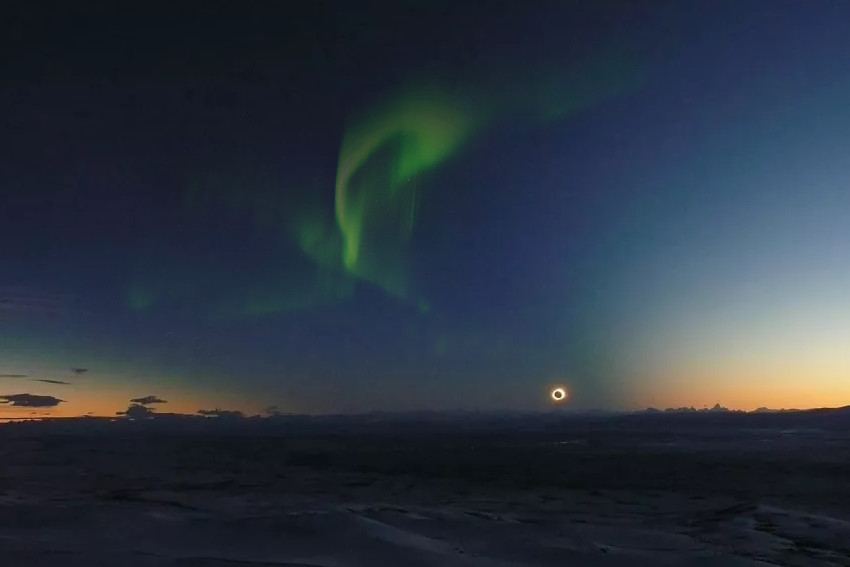
The totality at Taymyer Penninsula will have very similar geometry to the one observed near Coyhaique in Chile in 2010 (Pic. 9). The most spectacular would be the aurora happening just next to the eclipsed Sun as shown above (Pic. 9), however, the sky’s surface brightness in that direction, as well as the aurora’s oval position, should be concerned here.
At this stage is very important to consider the moment of the first (or last) aurora appearance against the twilight. It’s widely assumed, that aurora starts to be clearly visible or possible to detect towards the end of the nautical twilight when the Sun is 12 degrees below the horizon. Obviously, we know, that the end of the nautical twilight is a significant mark for the brightness of the sky, as an observer can see the directly illuminated ozonosphere in the geometrical sense. Regardless of this factor, the nautical twilight is not a decisive moment for the detection of the aurora same as its visual performance. Because the nautical twilight glow reaches at most 0.00806 Lux at its end is not able to draw out the aurora details, unless it appears closer to the solar azimuth and low above the horizon.
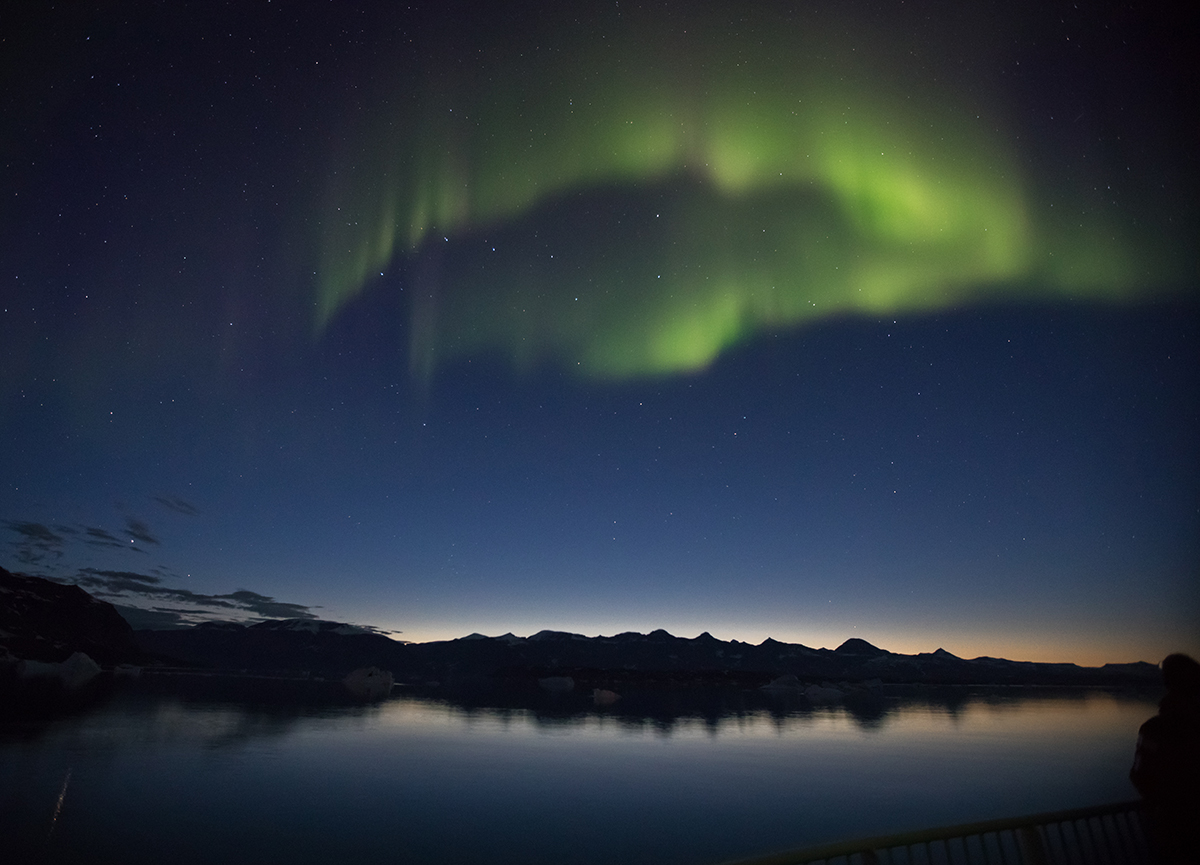
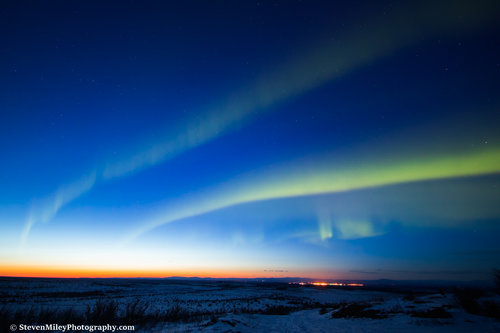
The situation starts to change, as the brightness of the nautical twilight glow hovers over the full Moon’s brightness. Because the strongest aurora reaches illumination like a full Moon, this time is somewhat the barrier marking the moment, when even the strongest aurora becomes visually fainter. In a practical sense, the full Moon doesn’t ruin your chances of seeing quite a good aurora event (Pic. 12).
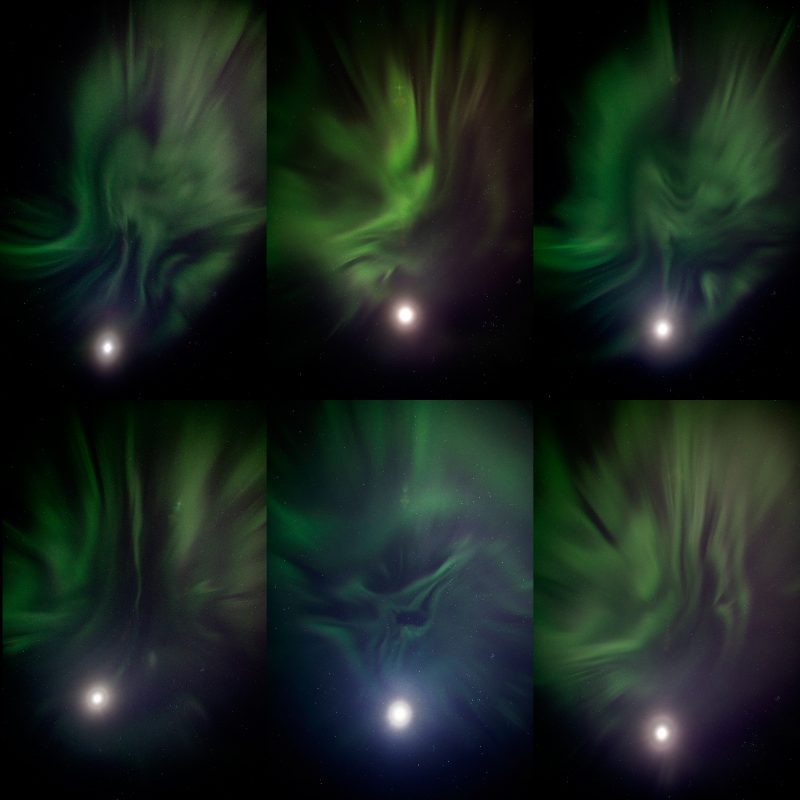
Of course, the full Moon can draw out the faint aurora considered i.e. level IBC2.
The solar position of 11 or even 10.5 degrees below the horizon still enables us to have a good aurora spectacle then. The situation starts to change beyond this point, making the event faint on the brighter side of the sky, whereas the antisolar direction can be still good for enjoying the strong aurora (Pic. 13), although its appearance is getting limited quite quickly, as the directly illuminated part of the stratosphere concerned moves upwards bringing more and more scattered sunlight.
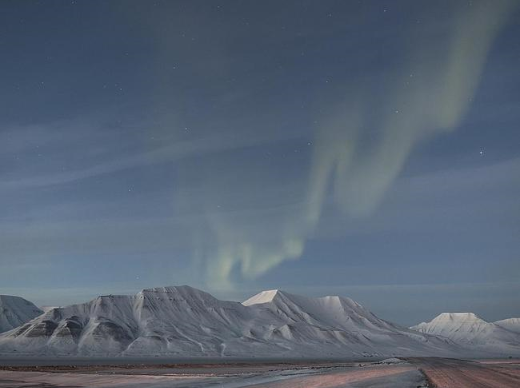
The event as presented above (Pic. 13) happens quite rarely. We should be aware, that most aurora structures peter out at this moment of nautical twilight. For as much as the standard aurora (with index IBC3) is concerned, we shall expect it to disappear at a solar position about 8 – 8,5 degrees below the horizon. It comes at least from my own webcam observations from the Abisko National Park webcam, where the aurora was predominantly gone at the mid-nautical twilight. Regrettably, the scarcity of this data cannot define roughly the moment, at which the aurora is drowned out by the twilight sky. There are 3 reasons behind the insufficiency of this data: lack of good weather between January and late March 2021 – the concerned period of the observation series, and not favorable azimuth of webcam bearing, which is north. As a result, twilight encroaches on the frame as the day gets longer. Finally, the moment of solar activity falls near the minimum, resulting in relatively poor aurora development (Pic. 14, 15).
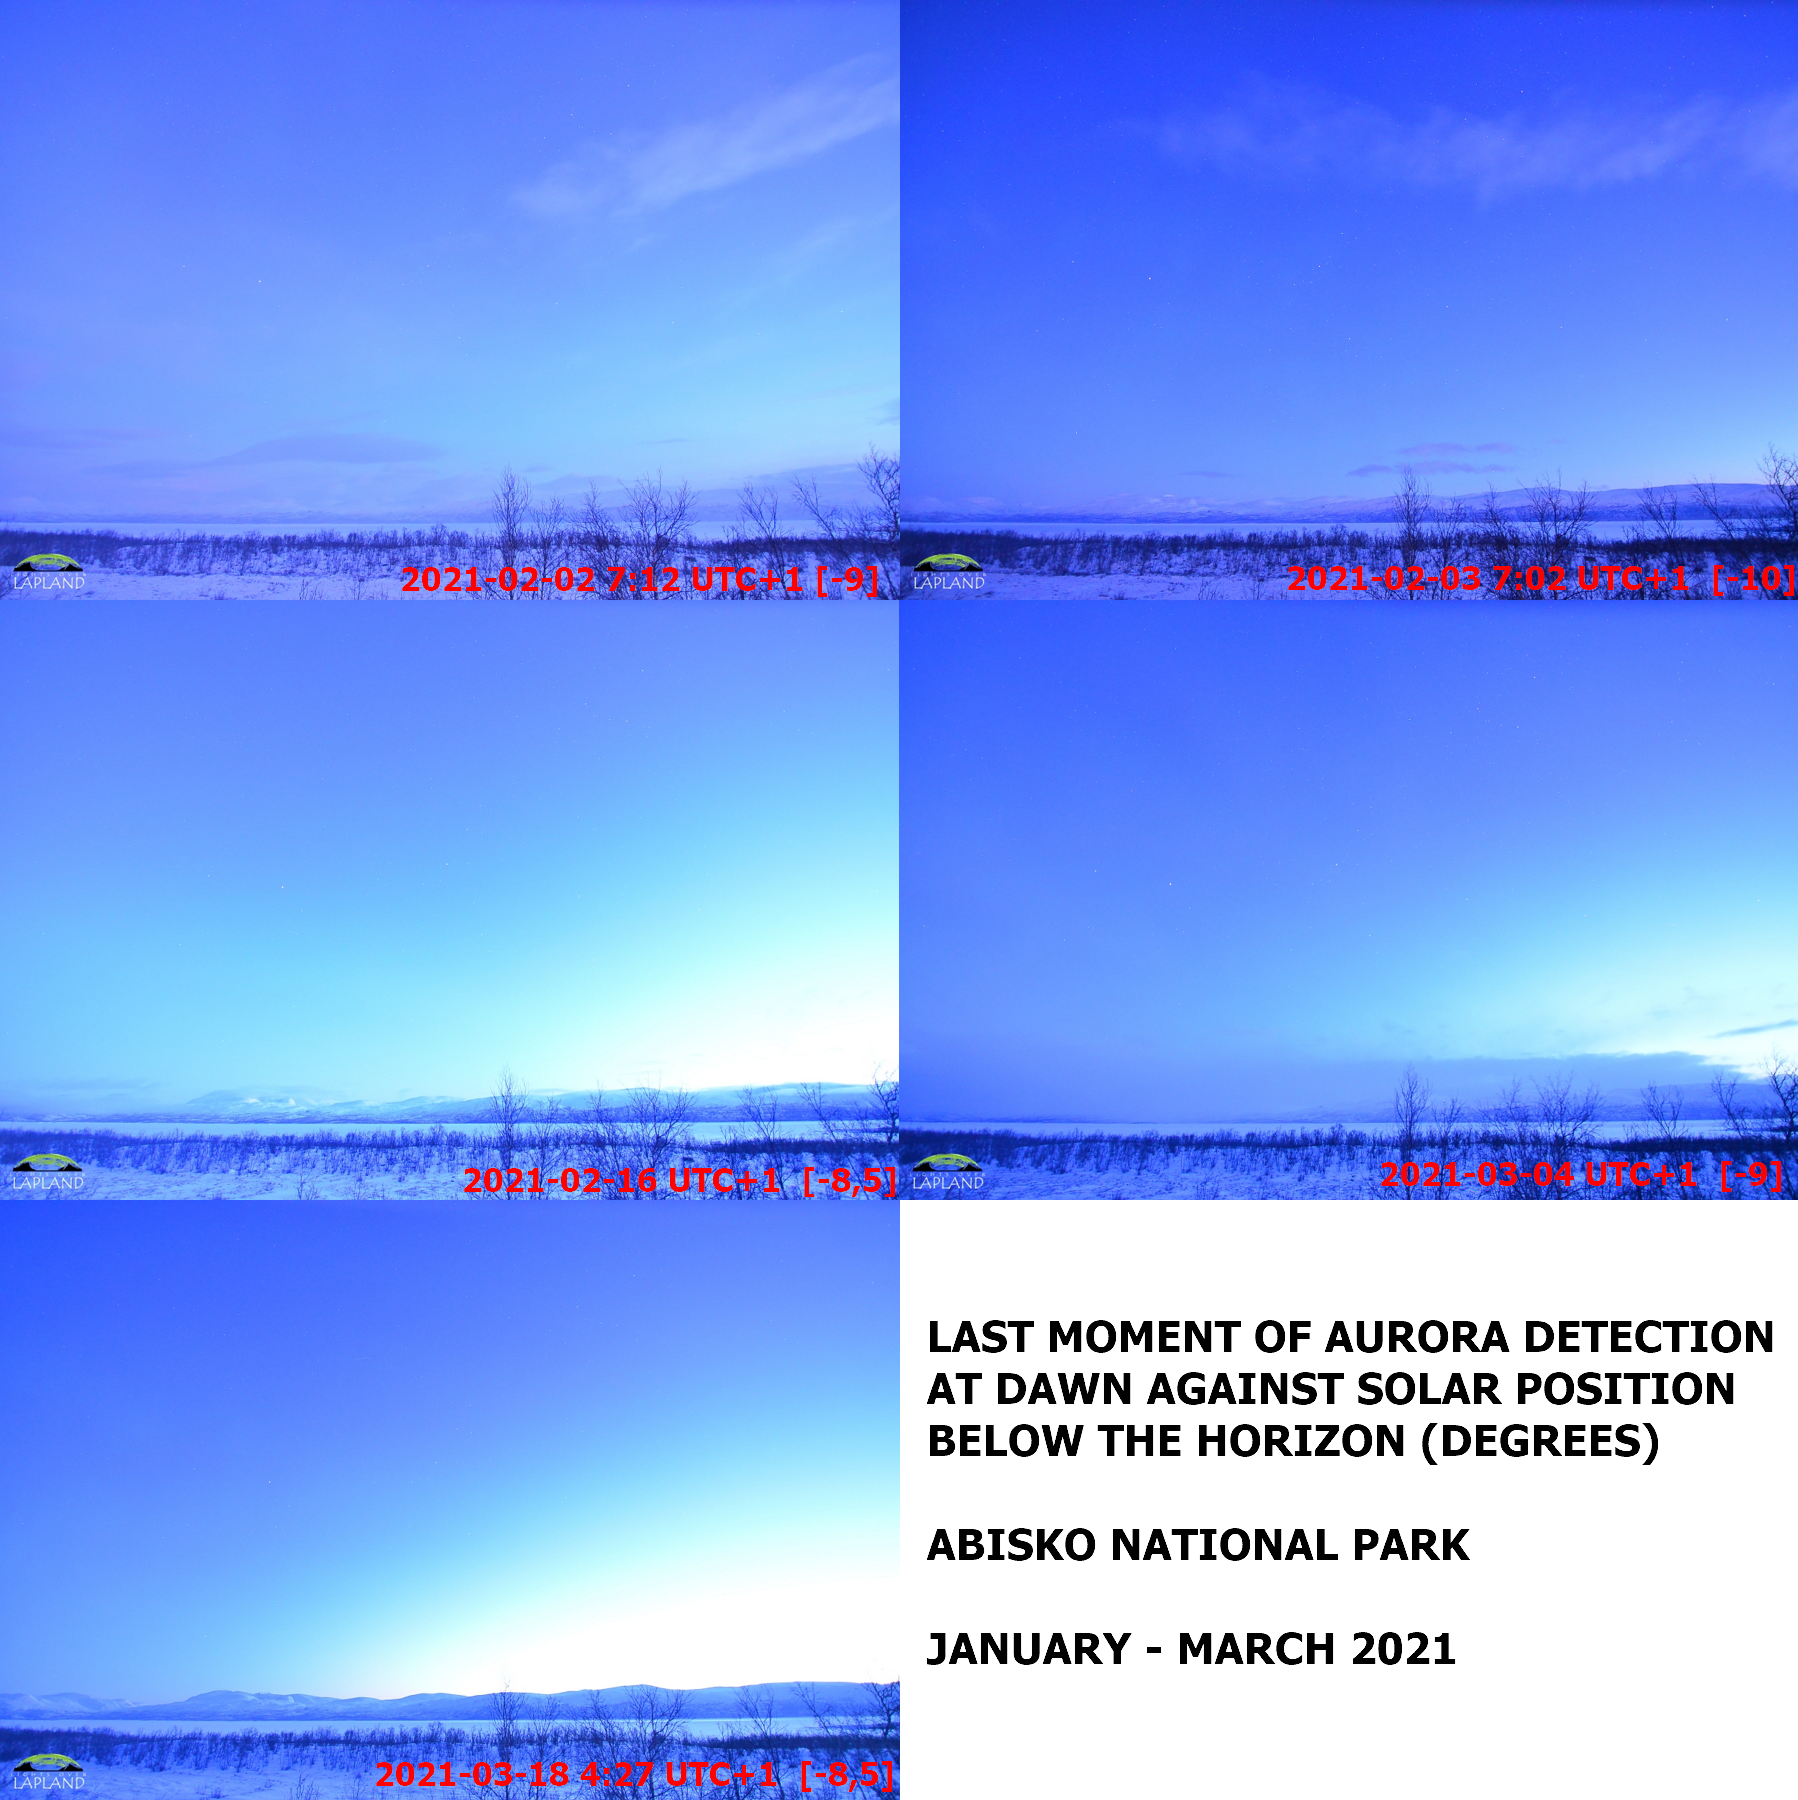
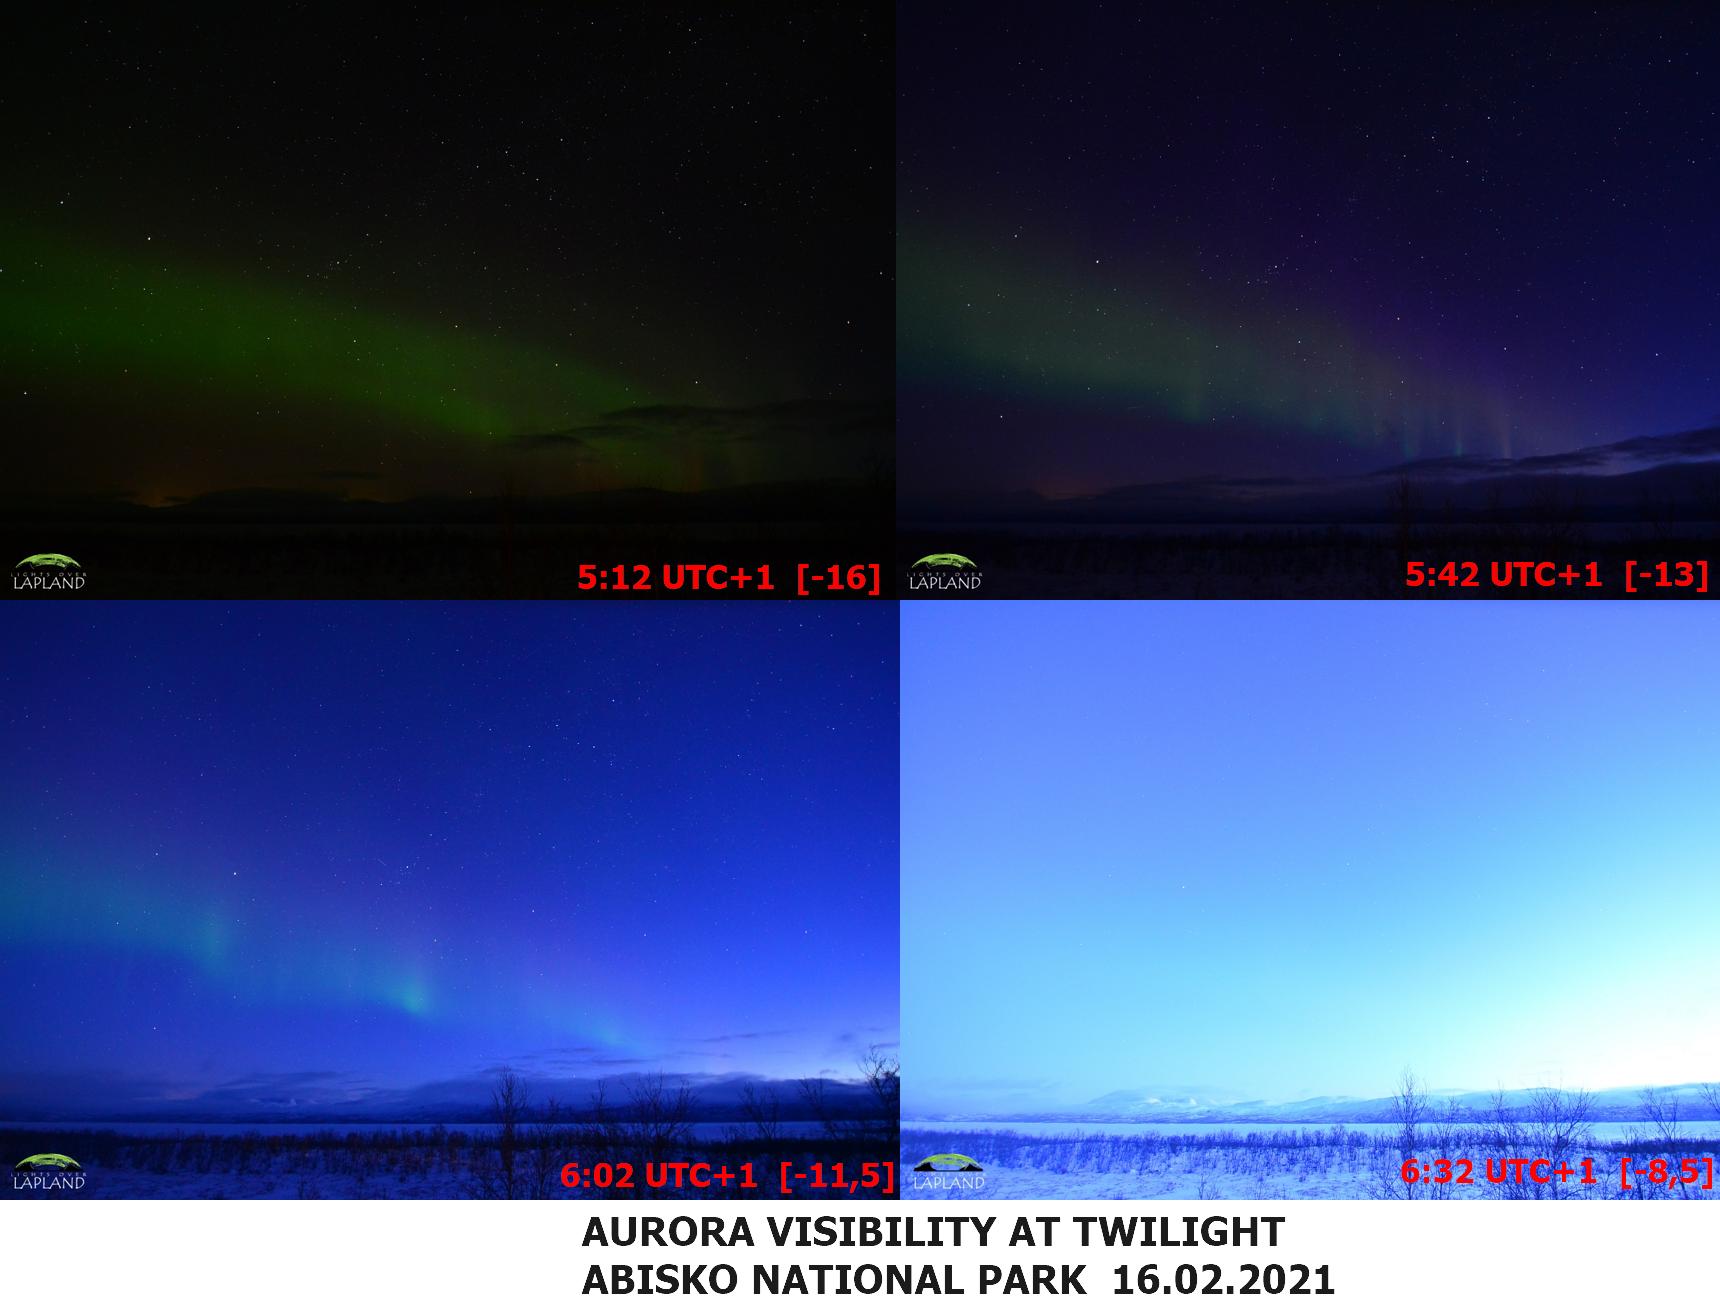
As an assumption, I would extend the aurora visibility by at most one degree, although it definitely requires further observations, especially on-site. Even so, it would mean, that the aurora becomes invisible to an observer yet during the nautical twilight. Unfortunately, there is no evidence for aurora visibility at civil twilight, which excludes the appearance of this phenomenon along with a total solar eclipse occurring high in the sky.
The aurora occurrence is a very wide topic, which will be definitely discussed here in the future, as it’s not only eclipse-related. I just wanted to bring some general view on the brightness against the twilight sky, which is the pivot thing in terms of the aurora occurrence along with totality. For August 2026, in Russia we could have the situation as per the pattern below (Pic. 16):
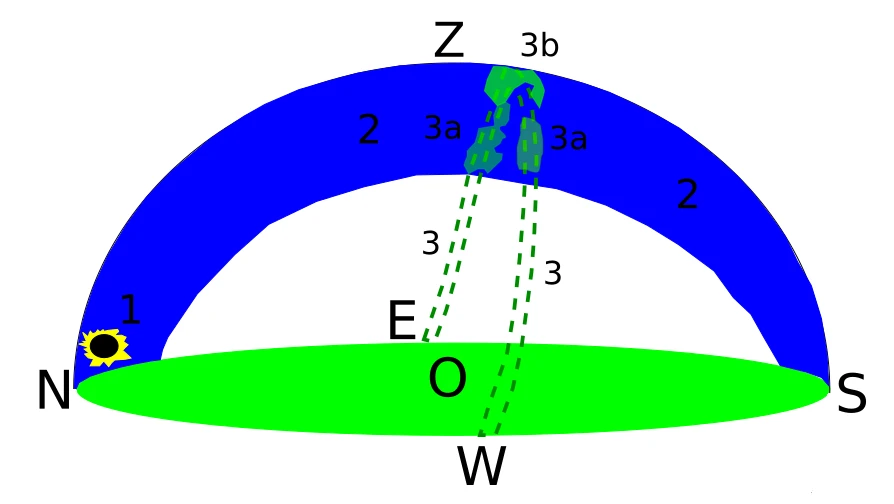
Considering the movement of the magnetic pole towards Russia in 2026 (Pic. 8) we shall expect the aurora oval to be visible just about East and West cardinal points. The best chance to see the aurora is believed to be a bit south of the Zenith, very high above the southern horizon, preferably 75-80 degrees. It would be fantastic, as this section of the sky seems to be the darkest at the moment of totality. The whole situation wouldn’t last for long, and only near the zenith, we could enjoy some faint aurora appearance.
II. TOTAL SOLAR ECLIPSE BELOW THE HORIZON AND NOCTILUCENT CLOUDS (NORTHERN & CENTRAL RUSSIA) – Unlike the aurora, which results from its own light, the noctilucent clouds reflect the sunlight. They are also appreciably lower than the aurora since the first phenomenon can be floated between 80 and even 640km above ground, and the second one forms somewhere between 75 and 86km above the ground. These clouds are composed of tiny crystals of water ice, which perfectly reflect the sunlight from the Sun located shallow below the horizon. There are a few theories on how these clouds are produced. The one reasonable explanation says that they are formed with water vapor which comes to the upper atmosphere through gaps and the dust originated from tiny meteors coming from space. The water vapor is lifted from the troposphere by powerful thunderstorms and the airflow over mountain ranges. Regardless of it, the moisture of the mesosphere is very little and states about one hundred millionth that of air from the Sahara Desert. These clouds form under very restricted conditions. They need an environment with a very low density, which is typical for the mesosphere. The temperature must be as low as -120°C or even lower. It happens only during the summertime in the local hemisphere when the mesopause is cooler than during the winter (mesopause anomaly). It’s driven by the summer-to-winter circulation, which happens in the middle of the atmosphere. In warm months, the polar air close to the ground gets heated and rises upwards. Next, this rising expands, as the atmospheric pressure is lower with the altitude. As a result of warmth, these air masses can reach extremely high altitudes in Earth’s atmosphere and cool it down adiabatically. When the temperature drops below -120°C it enables the cubic ice crystals to condense around small dust nuclei and form the night-shining clouds. These nuclei are often meteoric debris. Meteors shine at around 100km altitude, which keeps their remnants suspended in the upper atmosphere for a period of up to three years (Bone, 2007). During hot summers, the temperature in the upper mesosphere can plunge down even to -210°C. The temperature threshold is usually reached around mid-May in the northern hemisphere. The whole season for noctilucent clouds depends on the weather during the summer period (especially temperature) and lasts upon mid-august on average (reports from north-west Europe) with the peak just after the summer solstice (accordingly between the third week of June and the second week of July). Noctilucent clouds have various structures and vary from an hourly to a daily basis because of changes in the gravity waves. These waves create something like a wave-covered surface (covering sometimes several levels) that moves in total usually towards the west direction. Sometimes they can propagate in different directions, disappearing and reappearing or changing the scale (Dalin et al., 2004). Noctilucent clouds feature short and long wavelength structures. The short ones are usually quite unstable in their lifetimes and their instability is very similar to the Kelvin-Helmholtz structure (Fritts, 2014).
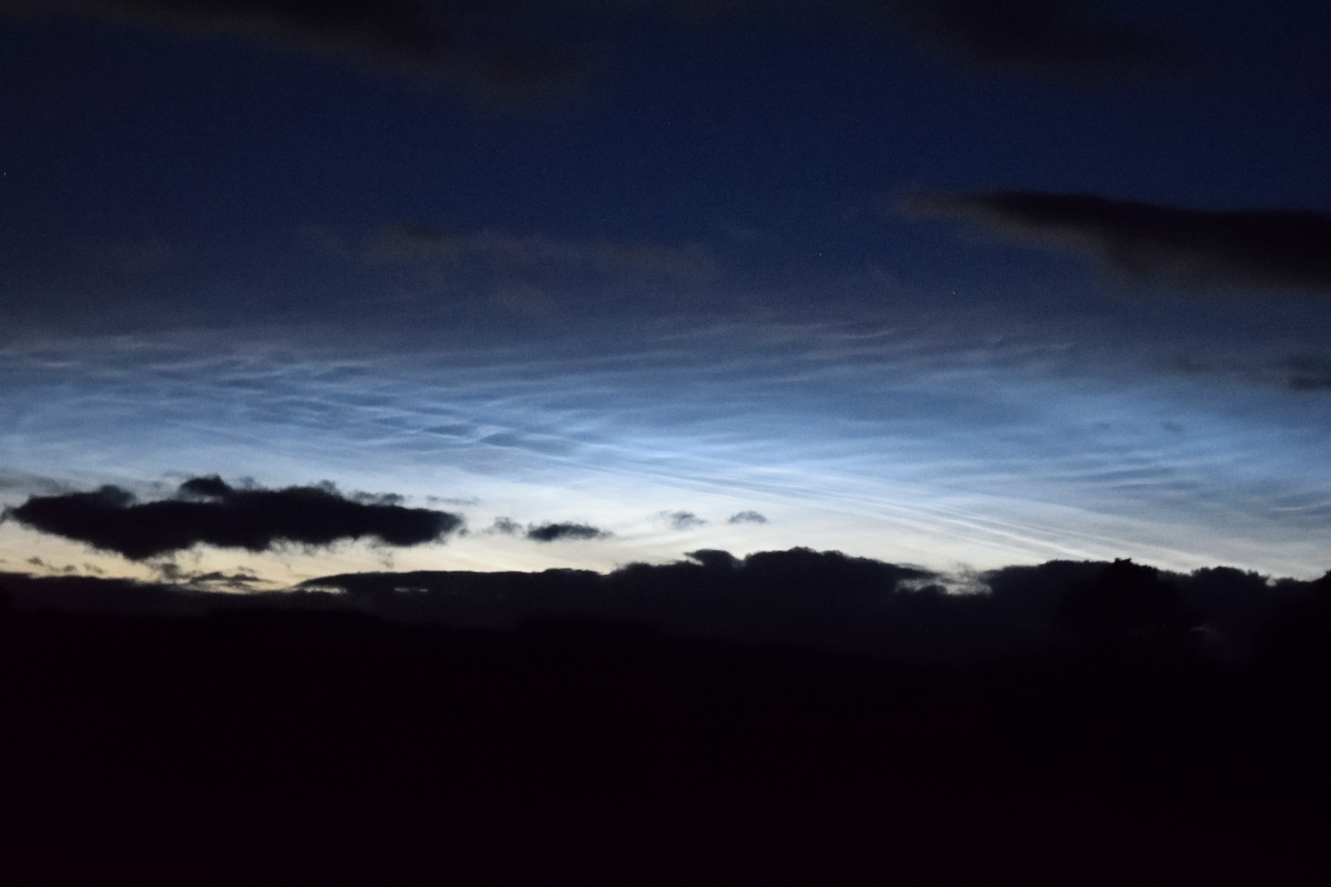
The life cycle of these structures rarely exceeds 10 minutes. Long wavelengths (between 20 and 70km) are rather stable and can persist even more than an hour. The speed of noctilucent clouds can occasionally reach even 200m/s (Ludlam, 1957). The polar mesospheric clouds structures appear as thin, decayed cirrostratus and cirrus clouds with white or silvery-blue light. A bright observer will notice that visually the polar mesospheric clouds represent 3 sets of tints. Since the very typical one is mentioned above, there are another 2, which are modified by the Earth’s atmosphere. At the very top of the section, where all noctilucent cloud structures appear, we can spot some reddish tinge. This is the “place” in the mesosphere, where the Sun rises or sets. The mechanism is analogous to a sunset saw from the ground. The rays must come through the thickest atmosphere layer possible, hence the long wavelengths prevail. The same analogy applies to the noctilucent clouds seen just above the horizon. They don’t look bluish at all there. Their color is mostly yellow or even orange. It brings the same effect to the Earth’s atmosphere. The light reflected by them passes through a massive chunk of the atmosphere, so a similar extinction and shift towards longer wavelengths are observed.
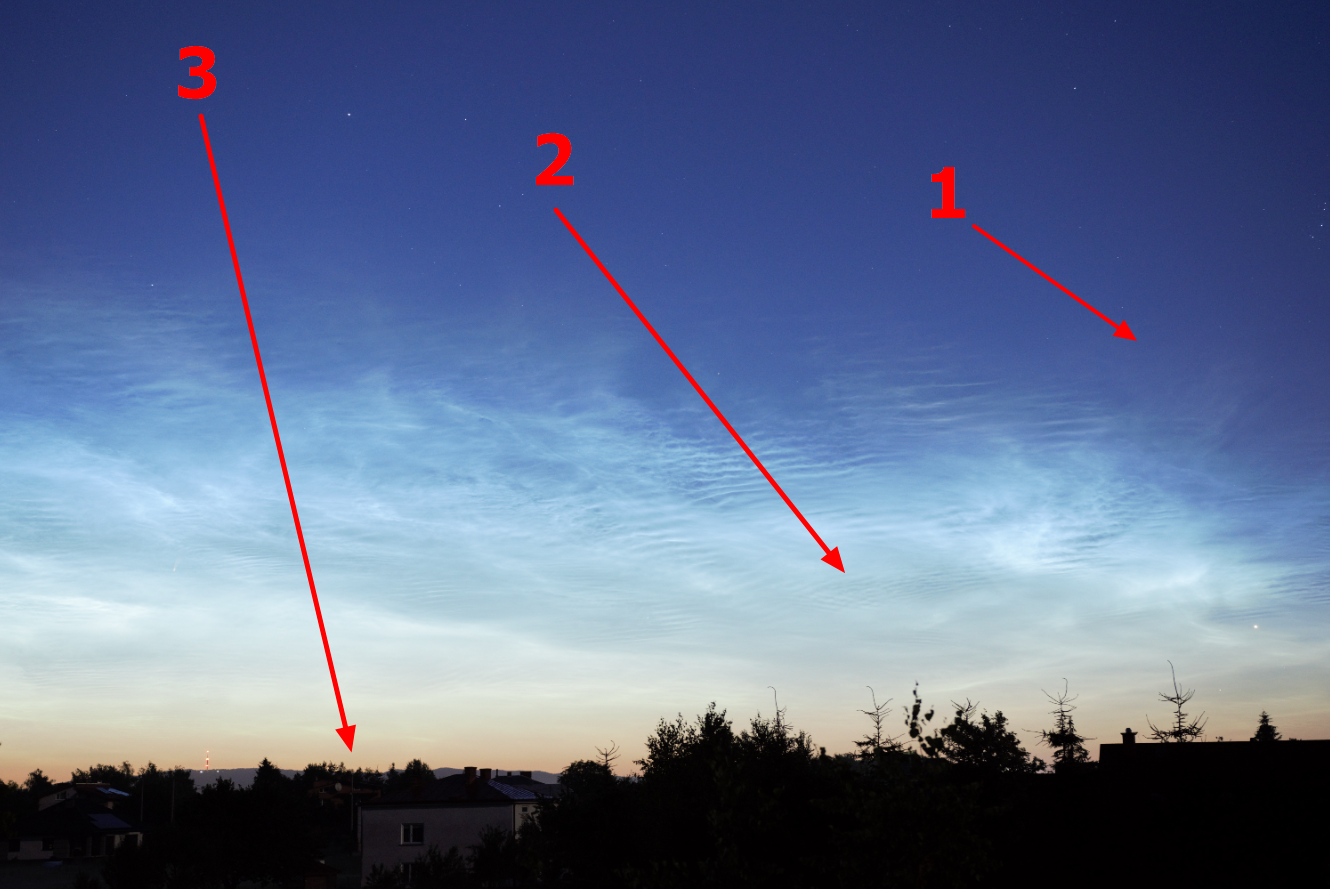
The polar mesospheric cloud structure can be also shaped by the dissipation of ice in the mesosphere. The ice can form as a single and continuous layer stretching along tens of kilometers. Within these forms, the ice is highly concentrated, which results in higher albedo translated into a significant brightness. A combination of the factors described above makes polar mesospheric clouds quite elusive throughout the night period. They also change within a wider range of time, covering the whole season or several seasons, which is driven by their subtlety.
Noctilucent clouds are very sensitive to any changes in their environment, which might basically decide their presence in the sky as well as their structure and brightness. These changes apart from temperature and water vapor might be gravity waves, planetary waves, and even solar activity. Regarding the last one, it was found, that the most intensive noctilucent cloud’s appearance is characteristic for the lowest solar activity period, presumably because of the generally lower atmospheric temperatures prevailing at these times (Bone, 2007). Another reason behind it might be the ultraviolet radiation from the Sun, which is known to vary cyclically with the solar cycle and peaks during the highest solar activity. UV radiation breaks water molecules apart, which reduces water supply to form noctilucent clouds. In turn, they are less bright or less often visible. The newest research informs about the constantly increasing frequency and intensity of noctilucent clouds, which are probably caused by climate change. It appears to be driven by increasing greenhouse gas concentration in the mesosphere. It has been said that higher methane concentration leads to an increment of moisture by producing water vapor when methane breaks down by sunlight in the upper atmosphere. Another greenhouse gas – carbon dioxide radiates heat toward space and causes the cooling of the mesosphere. The result is visible very well by the intensified appearance of polar mesospheric clouds including also its increasing brightness and extending the area and period of visibility.
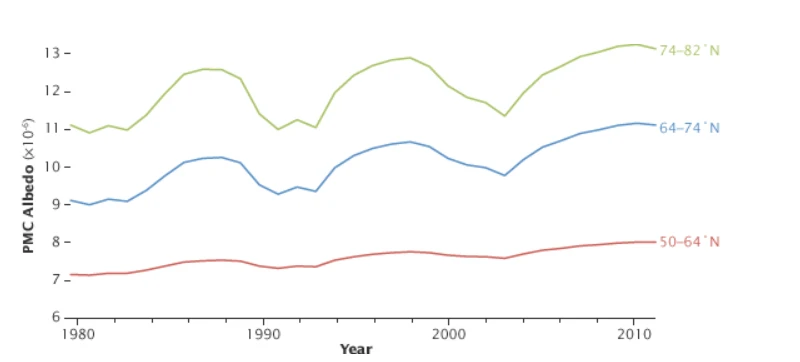
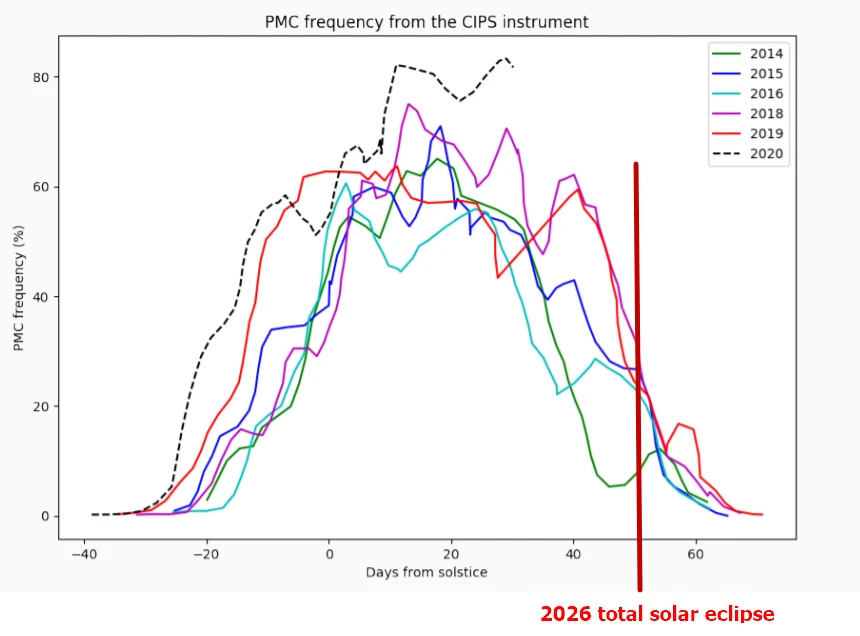
From our point of view important is, that the forthcoming 2026 total solar eclipse falls just above 50 days after the summer solstice when the probability of polar mesospheric clouds occurrence can be still quite high (Pic. 17). We have on average about 15% of probability, that the eclipsed twilight will coincide with the polar mesospheric clouds occurrence, although the peak of the solar cycle might bring this value further down to about 5% or so. It’s still enough to consider this phenomenon from two points of view – its geometry and brightness.
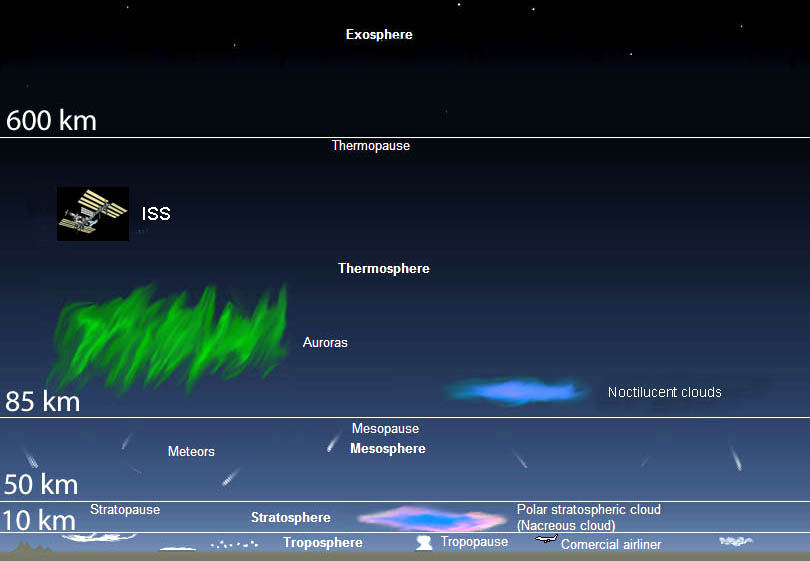
In terms of noctilucent clouds geometry, I mean mainly the level of their deck, which varies between 75 and 85km above ground, making them the highest clouds in the Earth’s atmosphere. I would like to explain their geometry much wider in the future in relation to the whole twilight period. For now, the pattern presented below should be sufficient (Pic. 21).

These clouds remain visible under specific conditions, which come from their optical properties. Admittedly, the finest and thickest NLC structures can be really bright, although they are never bright enough to shine during daylight. They start to be visible when the Sun is at least 4 degrees below the horizon. Thinner polar mesospheric clouds are usually visible upon the end of civil twilight. Predominantly they are visible between 50 and 65 latitudes. They can’t be observed inside the polar circles, because the Sun is never deep enough below the horizon. At the edge of the polar circle, the noctilucent clouds season might be broken up between two smaller periods, as it starts in mid-May and lasts till mid-August. Therefore, the polar mesospheric clouds are barely visible about 5 weeks before the solstice, as the Sun goes about 4-5 degrees below the horizon, and they start to be visible again after mid-July. To be more precise, if an observer is located near the edge of the Arctic Circle even up to the 71 latitudes (Ludlam, 1957), he is able to watch the polar mesospheric clouds usually after the mid-summer period, somewhere between late July upon the noctilucent clouds disappear completely. The same situation applies to the Antarctic Circle in the opposite sequence.
Despite that noctilucent clouds tend to occur in extensive sheets, usually the part of the sky, when we can see it is very restricted to the narrow segment above the horizon. This segment becomes wider, as the Sun goes closer to the horizon.
The noctilucent clouds can be visible until the Sun is as deep as 16 degrees below the horizon. It’s explained by their altitude, which also determines the zone of visibility (Pic. 22, 23). If the polar mesospheric cloud is visible roughly above your head at the zenith, the other observers can see it in a circle of 800-900 km away (Dietze, 2016). It’s possible because of their strong contrast with the sky, as they reflect a lot of sunshine.
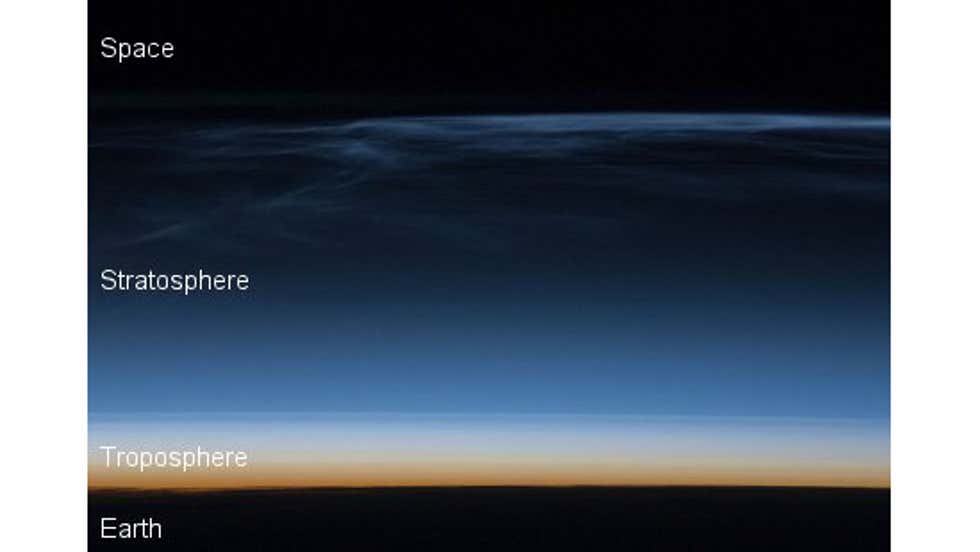
As the Sun is closer to the horizon, the segment of the sky, where the noctilucent clouds are visible gets wider. The best pattern is presented below (Pic. 24), where you can clearly see the dependence of the NLC segment of visibility from the solar depression.
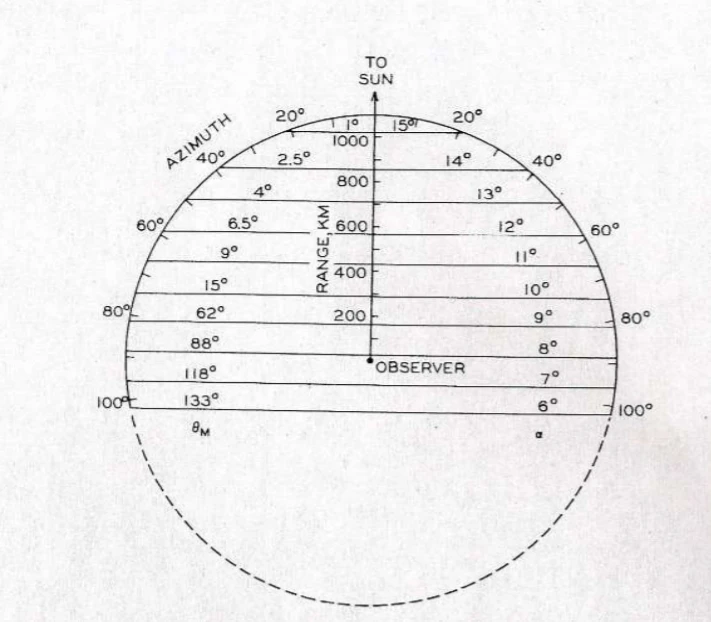
As the Sun goes closer to the horizon, the section of the sky, where the polar mesospheric clouds are visible gets wider. When the Sun is about 8 degrees below the horizon, we have almost half of the sky covered by these clouds. Obviously, we are not exactly sure about the total coverage of the sky by these clouds, because we can see only the visible ones. When the Sun reaches a 6-degree depression, it covers almost two-thirds of the sky. For 4 degrees, their limit of visibility is pushed further, although at this moment they become too faint to be distinguishable to an observer. Another thing is, that as the sky gets brighter due to lower solar depression, we are successively unable to see the noctilucent clouds towards the solar azimuth (Pic. 25).
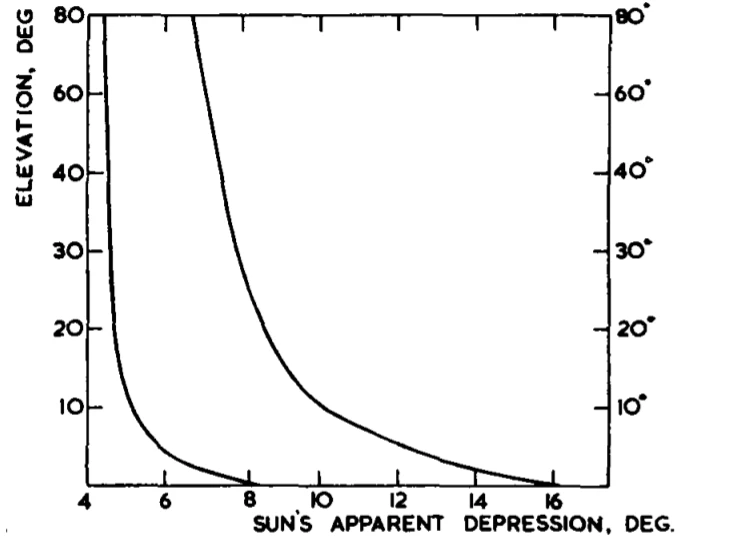
The pattern above shows the 12 degrees of solar depression interval, during which the noctilucent clouds can appear anytime in any part of the twilight oval. When the Sun is lower than 16 degrees below the horizon, they fade out altogether. On the other hand, predominantly, the polar mesospheric cloud’s visibility reaches the edge of the civil twilight. However, during spectacular displays it’s not a problem to spot them upon solar depression reaches 4 degrees (watch the video below), or even they can nearly follow the sunrise or sunset. The graph above (Pic. 25) applies rather to the brightest appearance of the noctilucent clouds. The brightness is a key feature from our point of view, as we are considering observing them along with the occurring total solar eclipse in 2026.
The brightness of polar mesospheric clouds marks the basic division between them. It has been classified into 5 levels of illumination (the NLC brightness scale), where the most important is level 5 covering the structures able to illuminate objects noticeably and even cast shadows in extreme cases.
The brightness of noctilucent clouds is predominantly caused by the increase in water vapor concentration and often goes along with the lengthening of the NLC season (Klostermeyer, 2002). The brightness of noctilucent clouds is approximately 5-10 times less than the brightness of the diurnal sky (Sharonov, 1965). The brightness of the twilight sky is different and changes dynamically along with solar depression. It’s a nice subject for discussion in a separate article. If the brightest noctilucent clouds fade out at solar azimuth, when Sun is about 8 degrees below the horizon, their illuminance is not bigger than 0.348 Lux. It leads to the conclusion, that in extreme cases, the noctilucent clouds might be brighter than the full Moon. It’s only far-reaching simplification only for the purpose of this writing, at least because of the structure of these clouds. If we are talking about the brightest polar mesospheric clouds possible to spot, we should know, that their brightness is not uniform across the whole sheet. They feature more and less bright structures.
Next to the brightness, the probability of noctilucent clouds occurrence seems to be also very important. Usually, they tend to reach lower latitudes above vast landmasses. It’s predominantly driven by the following factors:
– enhanced gravity waves developed from the effective airflow above mountain ranges,
– stronger warm air uplift caused by intensive heating of the ground. The ground gets warmer much quicker than a large waterbody
– finally, human emission, which the effect, methane is released into the atmosphere, and more water modules are produced in the mesosphere,
Because northern and central Russia is part of a colossal landmass (Eurasia), the noctilucent clouds occurrence during the 2026 total solar eclipse below the horizon is really likely, especially when we combine it with their season lengthening described above.
This celestial occurrence could look like below (Pic. 26). In addition, an observer would be able to see the solar limb reddening perfectly, just near the umbral edge.
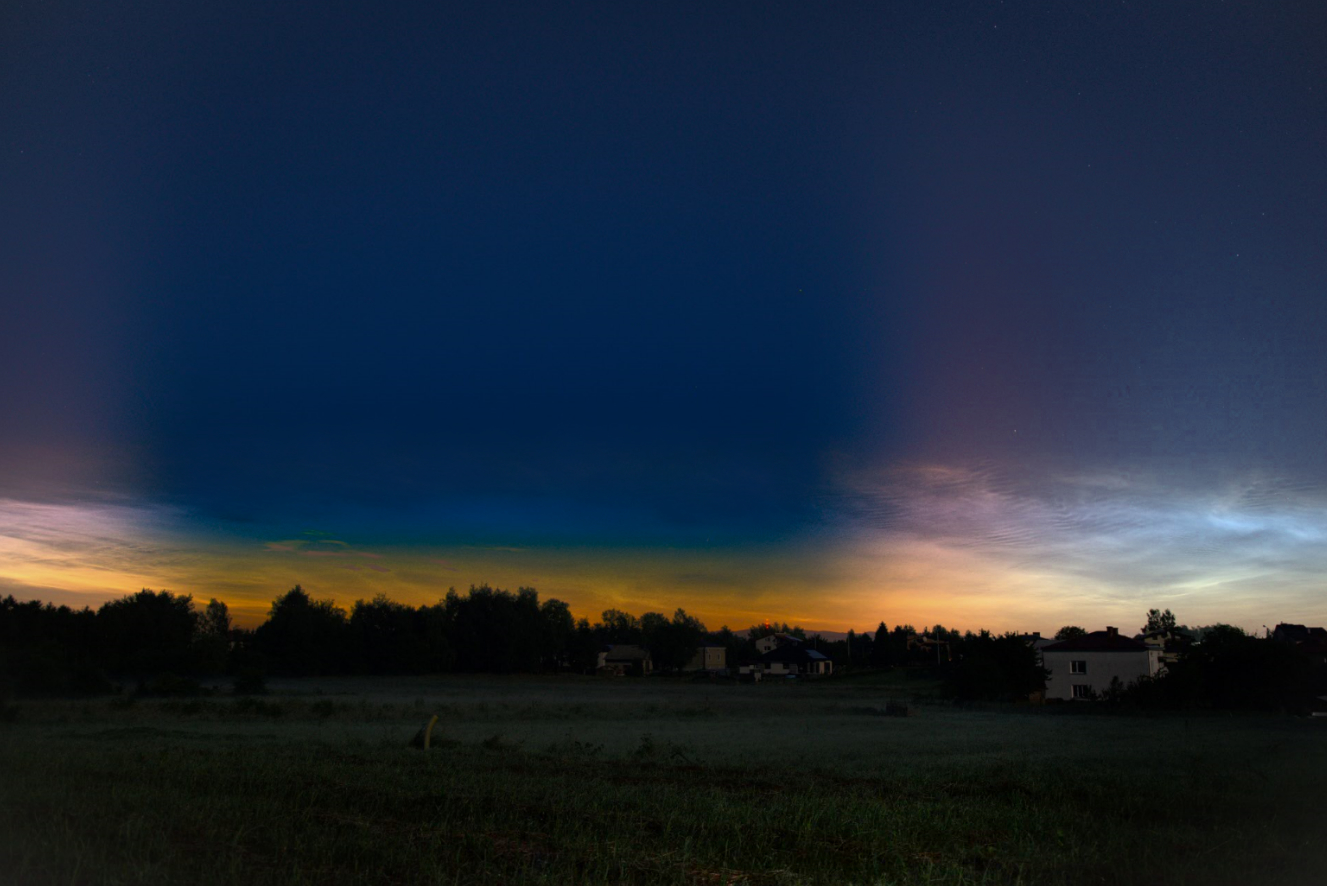
III. TOTAL SOLAR ECLIPSE BELOW THE HORIZON WITH ACCOMPANY OF BOTH AURORA AND NOCTILUCENT CLOUDS (NORTHERN RUSSIA) – The situation, which can happen, for sure. If we are at high latitudes, we can experience sometimes the northern lights and noctilucent clouds at once (Pic. 27).
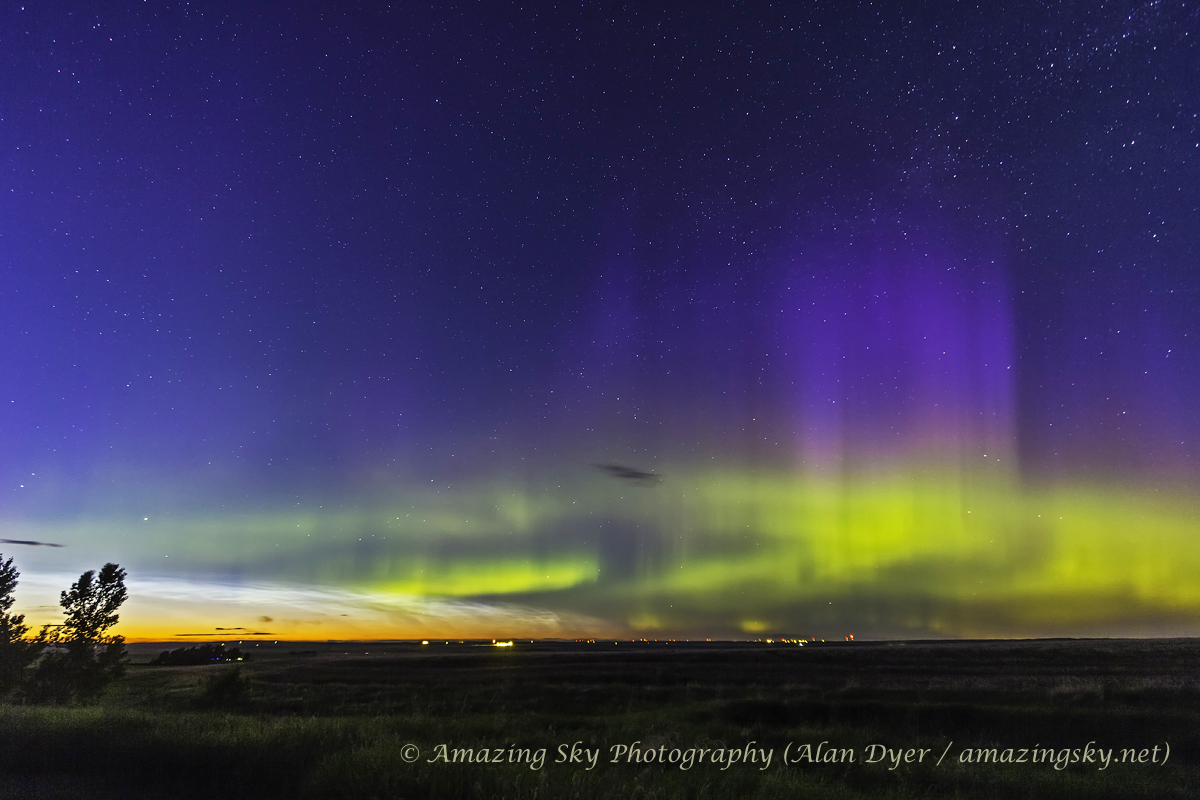
The occurrence of both phenomena is a fantastic spectacle. It can be an extremely unique celestial event, when combined with the total solar eclipse below the horizon, as per the pattern below (Pic. 28).
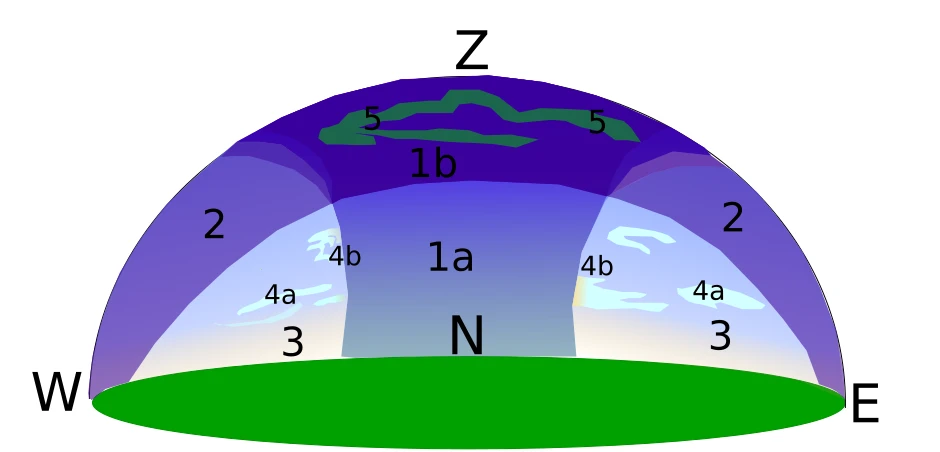
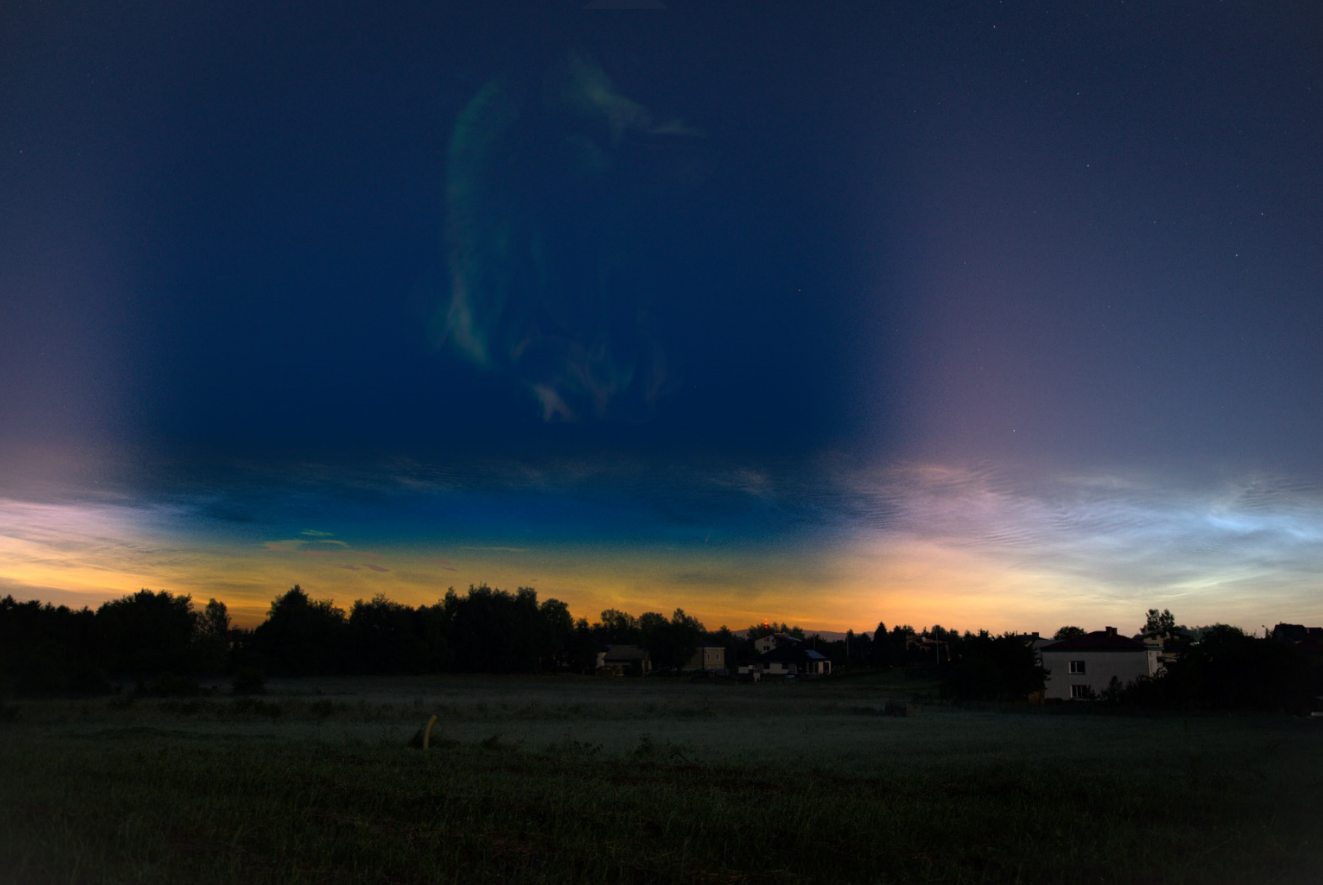
The same as described above, the noctilucent clouds should be completely gone at the time, when the umbra emerges in the twilight sky. Unlike the horizontal solar eclipse, as concerned above (Pic. 16), the probability of aurora display is much higher, because the twilight sky is definitely not as bright as during the day or golden hour period. In turn, we shall expect the spectacular combination of clear northern lights filling up the “space” after polar mesospheric clouds shaded by Moon’s shadow for a while or appearing near the zenith when we are located further north. There is also a likelihood, that the noctilucent clouds would extend their visibility even beyond sunset due to totality conditions. Considering the illuminance conditions under eclipsed Sun shining at the horizon, as similar to nearly nautical twilight with 8 degrees of solar depression, the polar mesospheric clouds could be visible across the entire sky wherever illuminated by the crescent Sun. On the other hand, I can’t assure you that this situation can happen at all because the brightness of noctilucent clouds will be accordingly lower because of the high eclipse magnitude. However, if we assume, that the given NLC structure can be visible even from 800km, where the eclipse magnitude is significantly lower, this situation can’t be excluded completely. A quite good approach to confirming or rejecting this theory can be the NLC investigation under annular eclipse conditions in June 2021 in Minnesota, US, where the ring of fire will be about 2 – 5 degrees below the horizon at the greatest phase.
IV. LIGHT SCATTERING IN THE ATMOSPHERE INSIDE THE UMBRA PERFECTLY SEEN ON WHITE SURFACE (GREENLAND, ICELAND) – it’s going to be the best occasion to see how the light is reflected from the surface, and what coloration of scattered light takes hold throughout the entire period of totality. There are no better conditions to observe it than a huge white or almost white surface i.e. the glacier body. The Greenland Ice sheet covers roughly 79% of Greenland’s surface. It does look amazing, even when watching it from cruising altitude you are unable to determine, where is its end (Pic. 30).
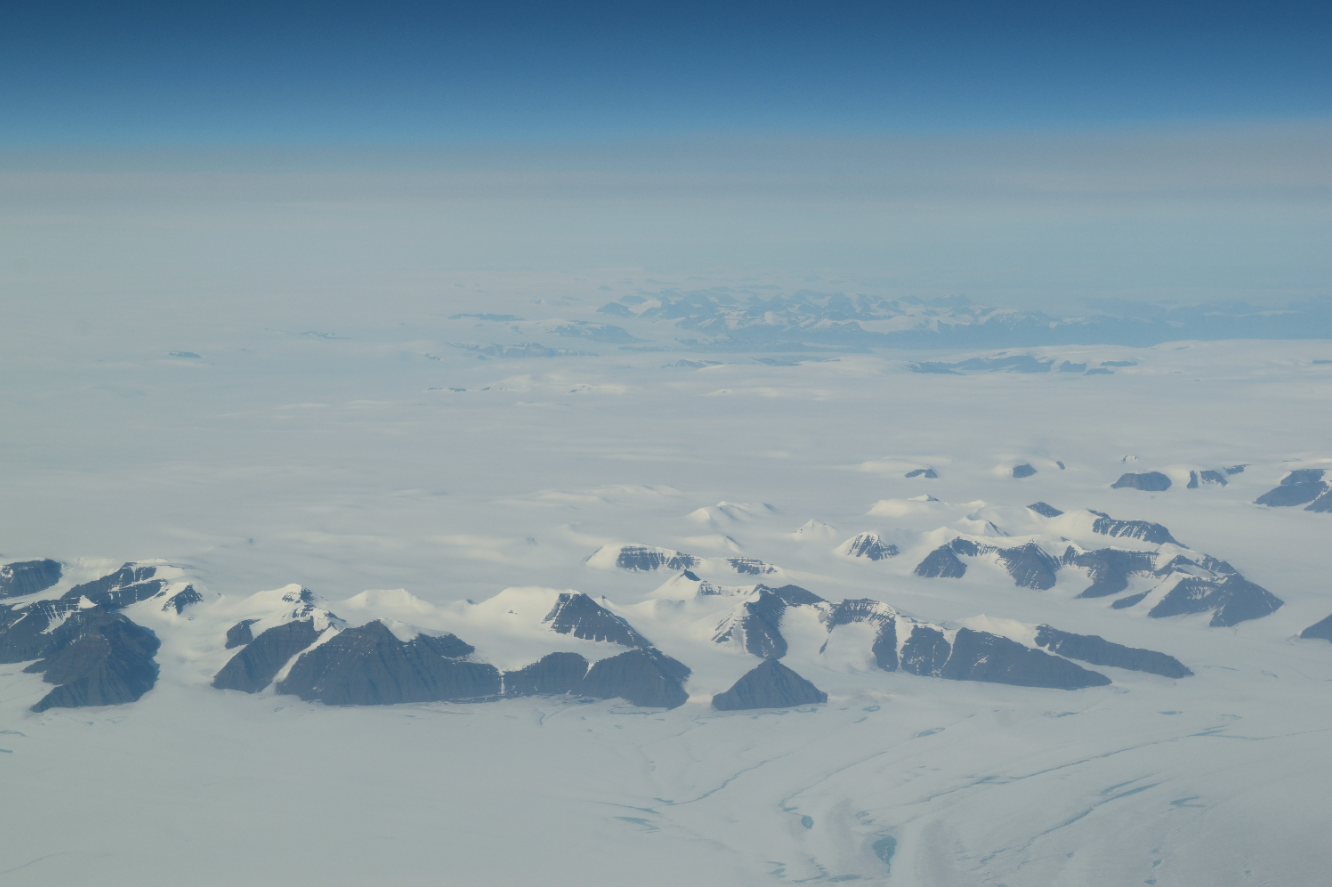
The opportunity for this scientific optical experiment will be undeniably the best unlike most eclipses, where only white sheets are used for this purpose. The last occasion for observation such as this was at Spitsbergen in 2015, which in winter conditions resembles the scenery of Greenland at some point (Pic. 31).
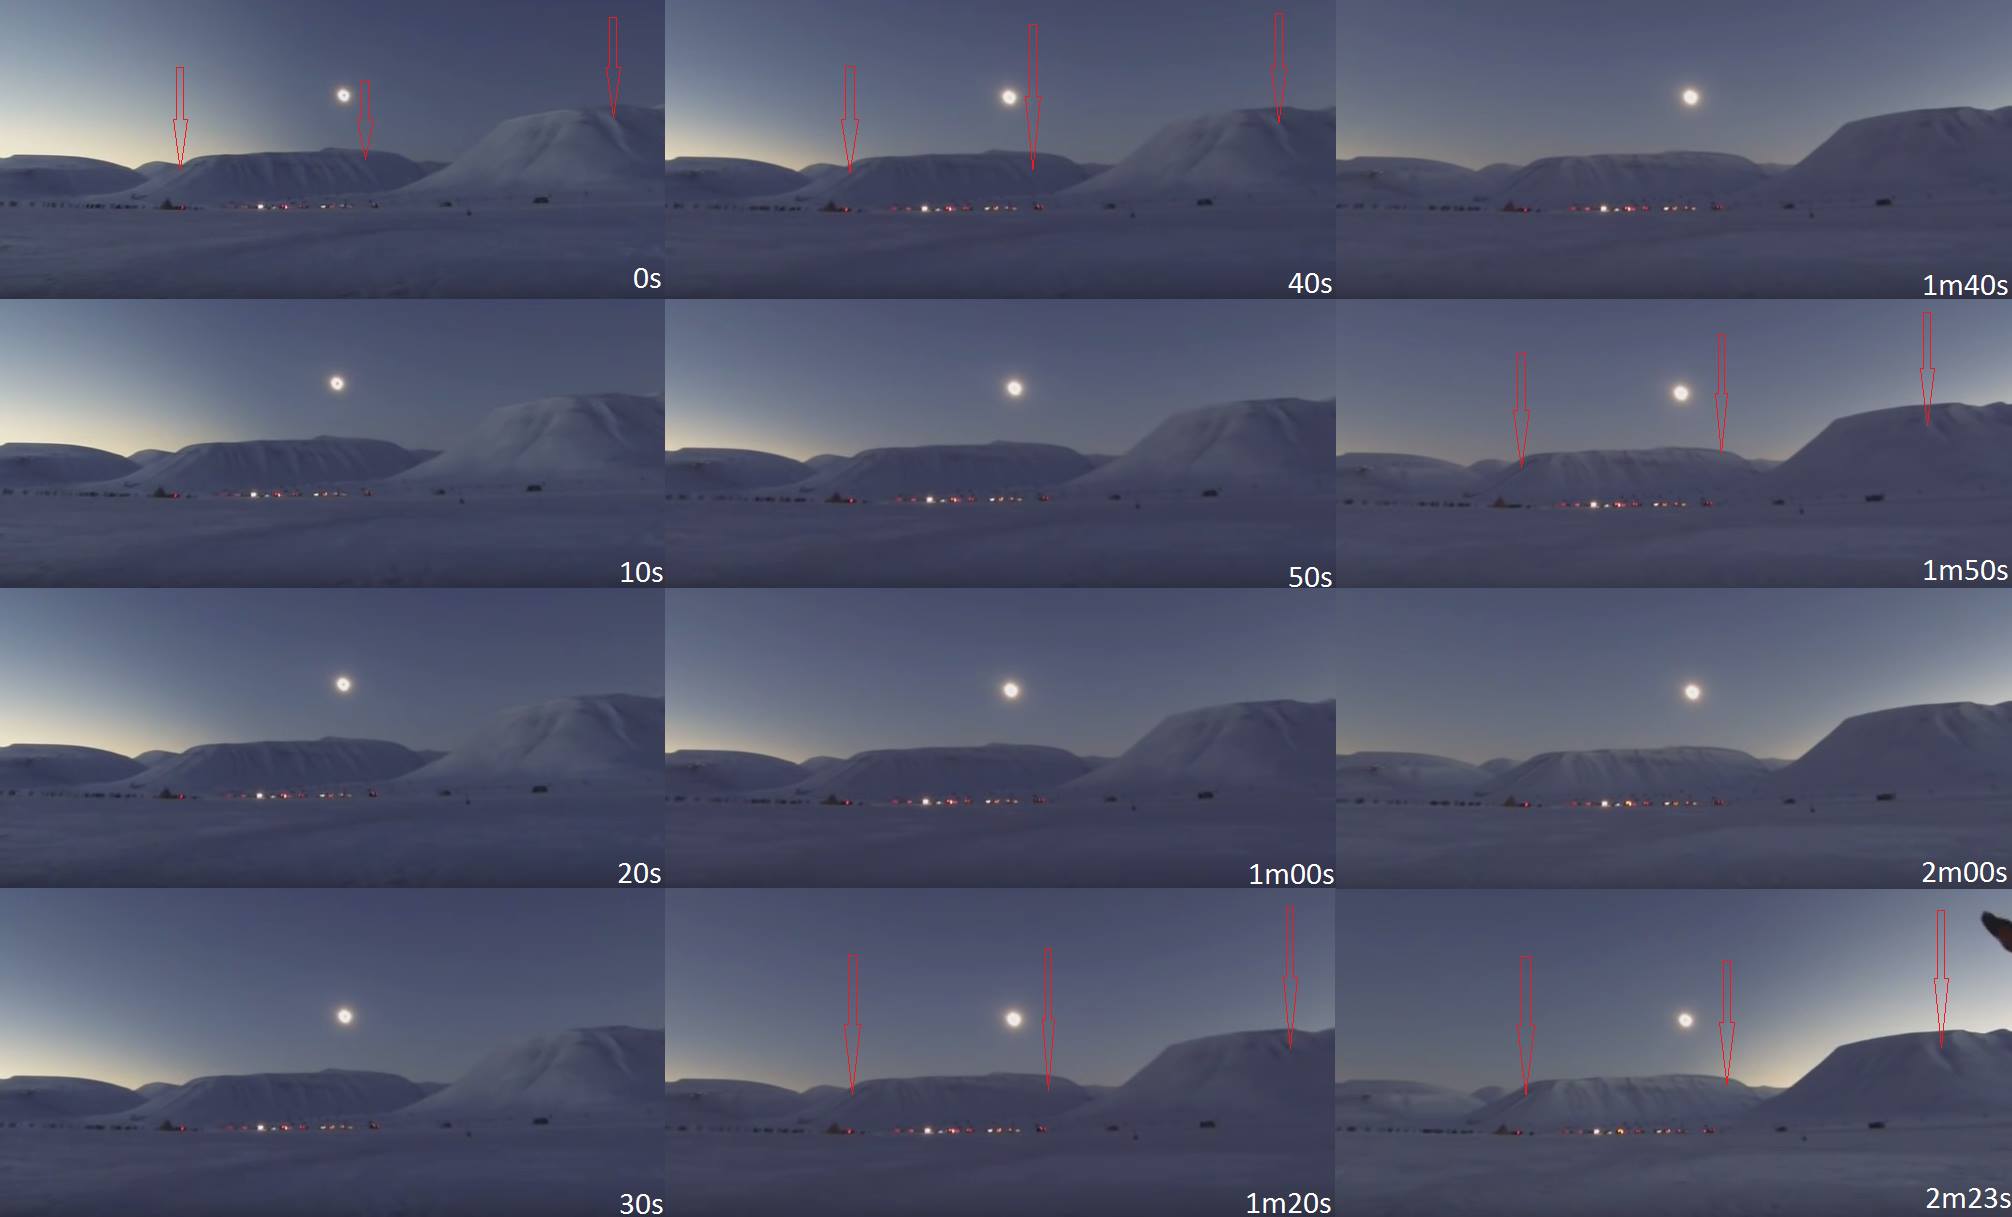
Another chance comes this year on December 4, when totality will occur in northern Antarctica.
V. LARGE SCALE SHADOW BANDS CHASING (GREENLAND & CRUISING ALTITUDE) – The Greenland Ice Sheet will be also the best place for the shadow bands study, as they are the clearest visible on a white surface. These wavy and alternating white and dark lines can be seen immediately before and after the totality. There are at least a few theories about what exactly causes shadow bands. Before the eclipse, they pass on the ground towards the direction, in which the umbra is traveling. After totality, the bands are often seen spreading at an angle to the eclipse’s course. The main theories explaining fairly the shadow bands talk about light diffraction, atmospheric scintillation, and infrasound. The light diffraction can be explained by the light shining by a thin solar crescent only. In this situation, the sunlight reaches a particular place on Earth’s surface by a variety of paths, where each of them is bent under different angles when passing through the atmosphere. Thus, in some places, the light waves are reinforced bringing a higher light level, whereas in other places the light level is reduced as the waves cancel each other. In turn, we can see a ragged banded pattern of light.
Another theory is based on infrasound – the sound which is too low to be heard by the human ear. This sound is believed to be caused by the sudden temperature changes in the Earth’s atmosphere driven by the Sun’s disappearance. This rapid cooling of the ear triggers changes in the pressure, and next the potential energy associated with this pressure difference escapes as high-intensive infrasound. These sound pulses are created continuously along with the “shock front” moving ahead of the eclipse itself. It creates a pattern of peaks and troughs in the atmosphere causing changes in the speed and direction of the light waves, which can be observed as the shadow bands on the ground.
Finally, atmospheric scintillation is an analog phenomenon, as we can observe for distant point light sources like stars, whose light beam is refracted on its way through the Earth’s atmosphere. On this basis also shadow bands can be produced. Atmospheric scintillation is a product of air turbulence caused by rapid changes in temperature and pressure. Since these disturbances in a transparent medium refract light waves, the disturbances can effectively cast shadows. If the bright source is thin and elongated, the shadows that are cast will generally be aligned parallel to the orientation of the source. Thus, when the background light source is the bright thin crescent of the Sun before and after totality, the shadow cast by Earth’s atmosphere will scintillate and appear as the bright and dark bands on the ground, which are parallel to the crescent (Madhani, 2020).
The shadow bands can be observed on a large scale for instance from a plane flying above the plain-colored surface, which is the Greenland Ice Sheet. Shadow bands were observed even higher, about 25km above the ground during the 2017 total solar eclipse in Tennessee (Madhani, 2020). If you want to learn more about the mechanism of shadow bands, this link is the best for understanding how it works.
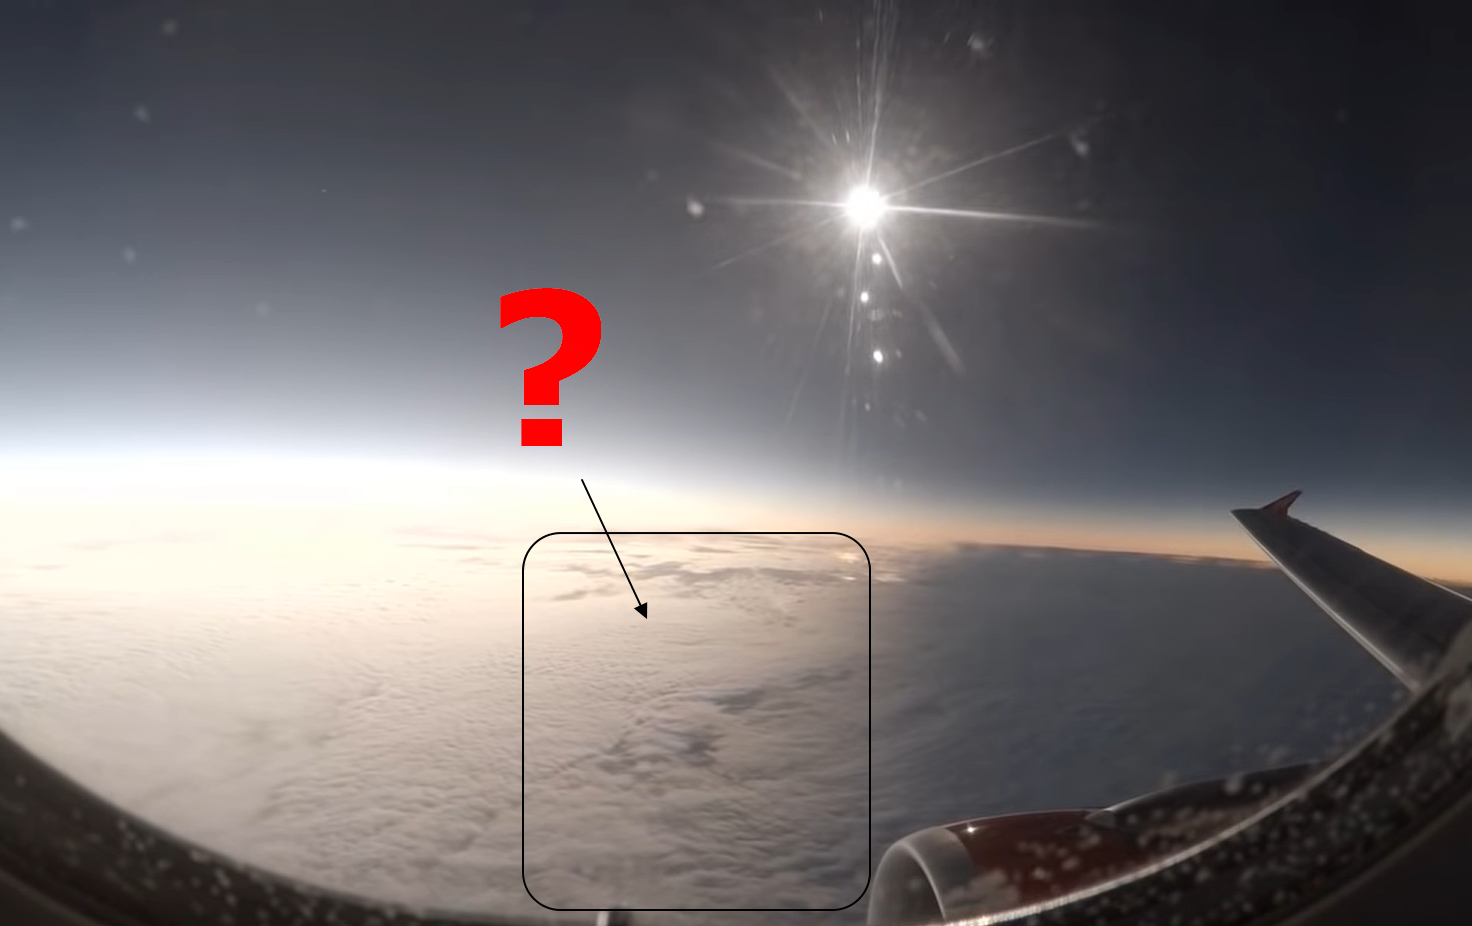
VI. ENHANCED CONTRAST TRIANGLE (UNITED KINGDOM & REPUBLIC OF IRELAND) – this intriguing optical illusion, described here, will be definitely enhanced, although not necessarily by the solar crescent because during the partial solar eclipse, the level of brightness changes uniformly in all directions. The matter applies to the southwest shores of Great Britain (especially Cornwall) and Ireland (especially Beara, Iverag, and Dingle Peninsula), where the partial phase of the eclipse will be the biggest. It will be accordingly almost 96% obscuration for the Land’s End in Cornwall and nearly 98% obscuration at Dursey Island, just outside of the Beara Peninsula (Pic. 33).
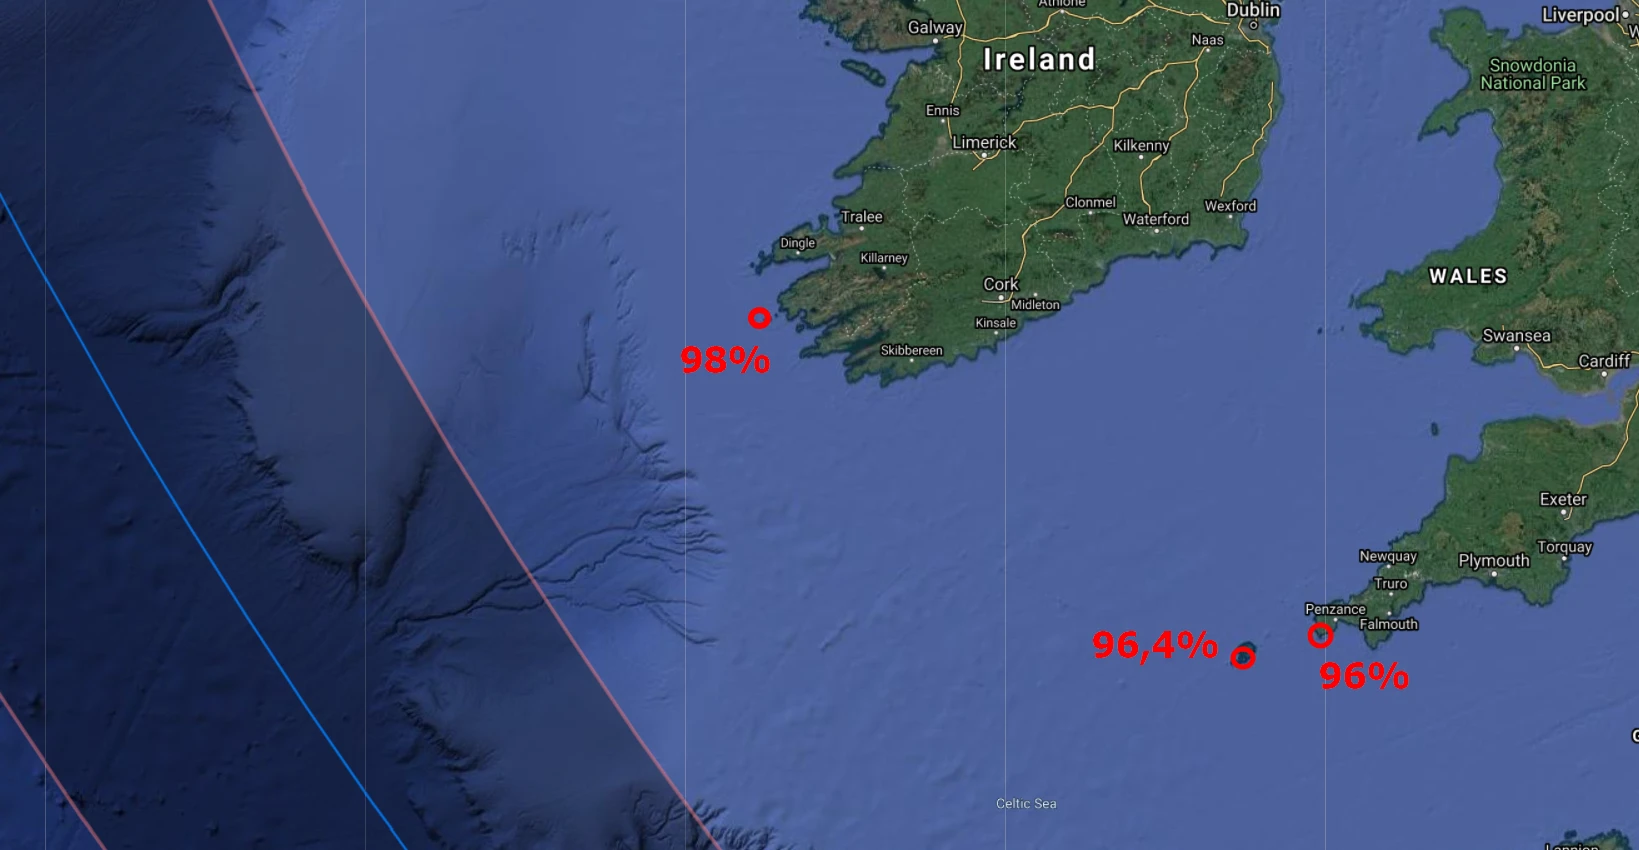
Moving a bit outside of the mainland, we shall expect the greatest magnitude accordingly at Skelling Islands in Ireland and Isles of Scilly in England.
An observer at the Irish shore will watch the greatest partial eclipse, just about 230km away from the shadow. Therefore, it’s possible to see the coincidence of the contrast triangle phenomenon with the umbral column beyond (Pic. 34), taking into account, that the shadow can be noticeable even from 250km. We should expect the dark triangle standing at the horizon, straight above the solar glitter, which would tend to faint as it moves away from the sea bank. Beyond this triangle, an observer would be able to spot moving umbra, displayed as a significant greyish or bluish sky extended much further than the bounds of this optical illusion, quite similar to the grayish shadow cone observed immediately before and after totality when watching it at the similar azimuth, where the Sun is located.
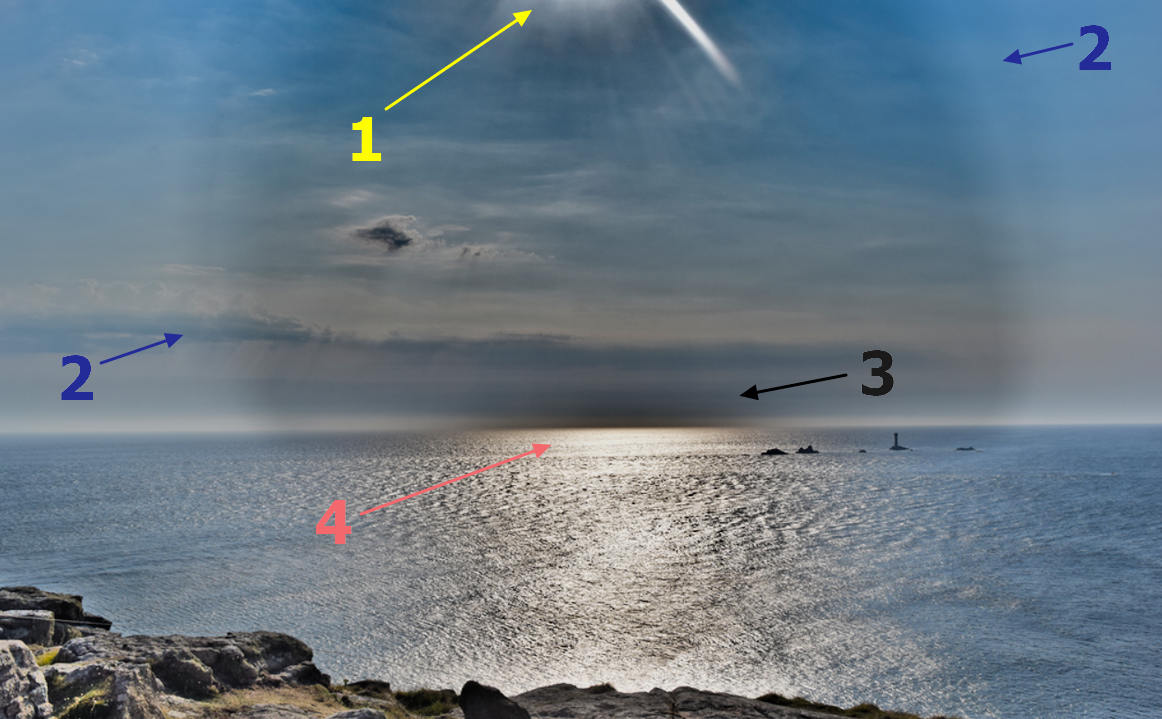
If the umbra wouldn’t be visible because of atmospheric conditions (mist or haze), then the contrast triangle would appear in a seriously darker sky. A bit different situation should be expected in the southwesternmost part of the UK, where the mainland will be about 420km away from the umbral path. There is rather no chance to spot the column of shadow, but the contrast triangle will be accompanied by a definitely darker sky towards the solar azimuth. In both cases, this assumption is really possible, as the greatest eclipse will occur in the late afternoon hours.
VII SUN’S GLITTER DISAPPEARANCE (SPAIN) – Another fantastic optical phenomenon possible to spot immediately before and after totality, when the glitter reappears again. As long as direct solar beams hit the water surface, an observer can see their reflection at the angle of incidence. A full explanation of this phenomenon can be found in this article. When totality approaches and an observer is high enough above sea level, then he can see how this solar glitter is getting shorter dramatically, until completely disappears inside the umbra. Next, after the human eye adaptation and light transition moment, he can see the same glitter, but as the effect of shining the solar corona, which as has been told is as bright as the full Moon. When the umbra moves away, this dimmer glitter is successively superseded by the solar one, which emerges straight after the shadow (Pic. 35).
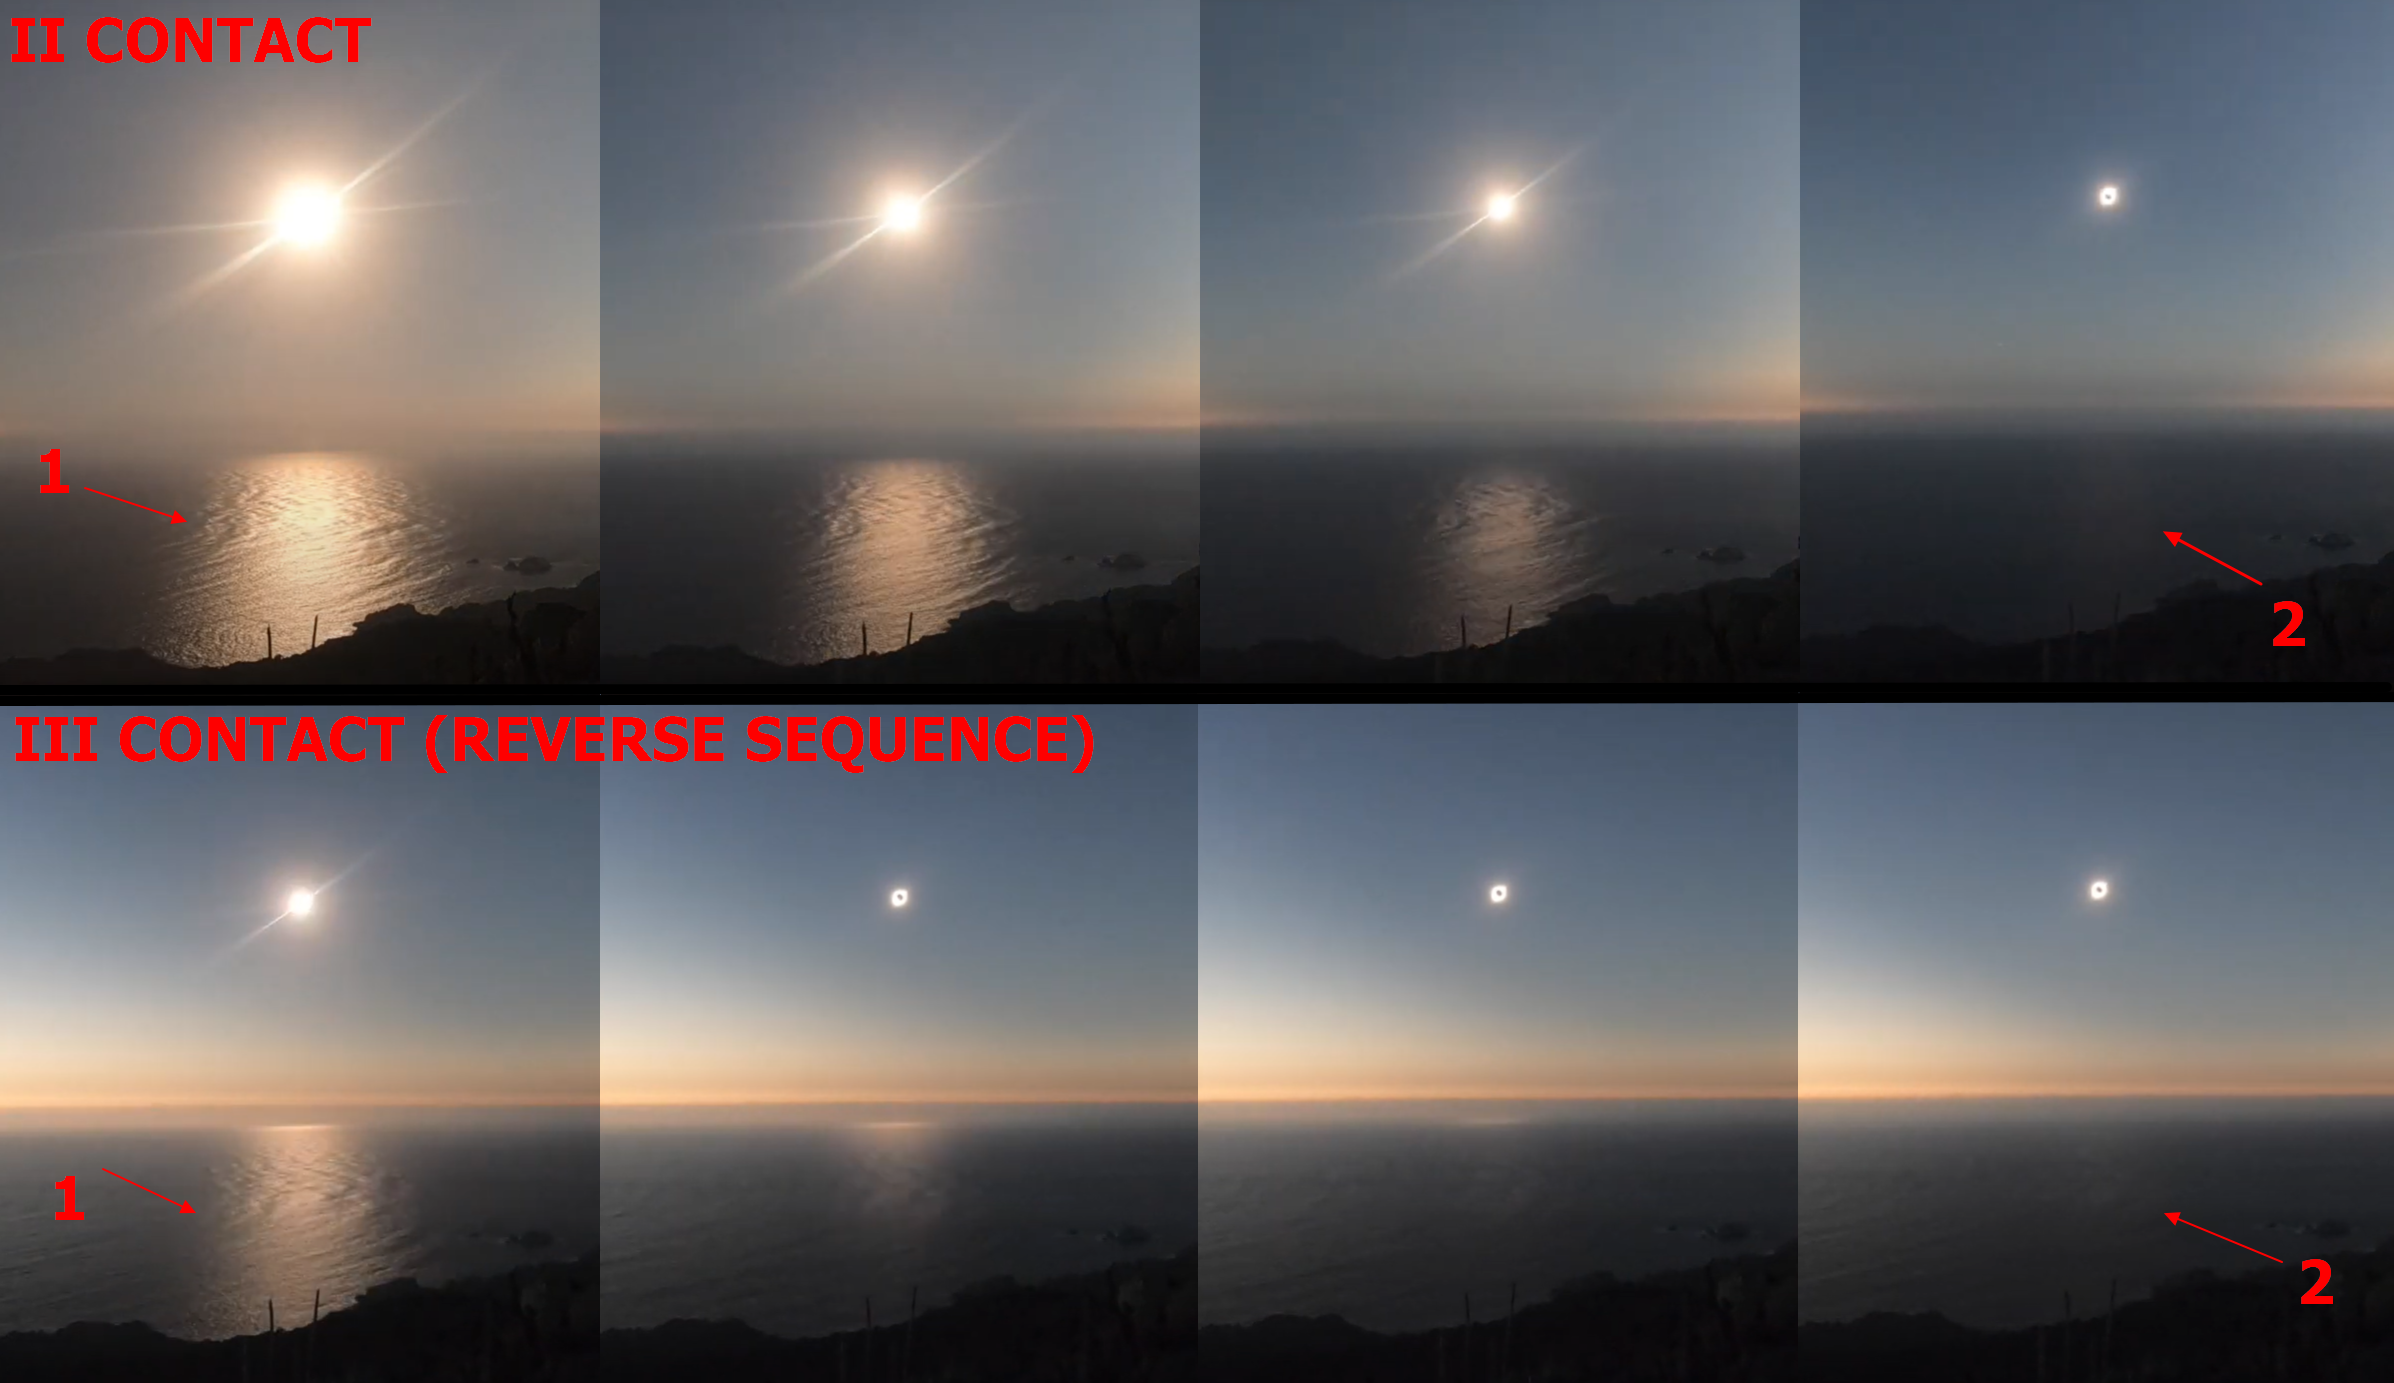
We can observe phenomena like this mostly when the Sun is low enough above the horizon, where most of the light is reflected from the waterbody instead of diffracted inside this medium (Fresnel equation). Moreover, the elevated position gives an opportunity to watch how this glitter yields the umbra and another way around at the end of the eclipse (Youtube.com). Click to enlarge.
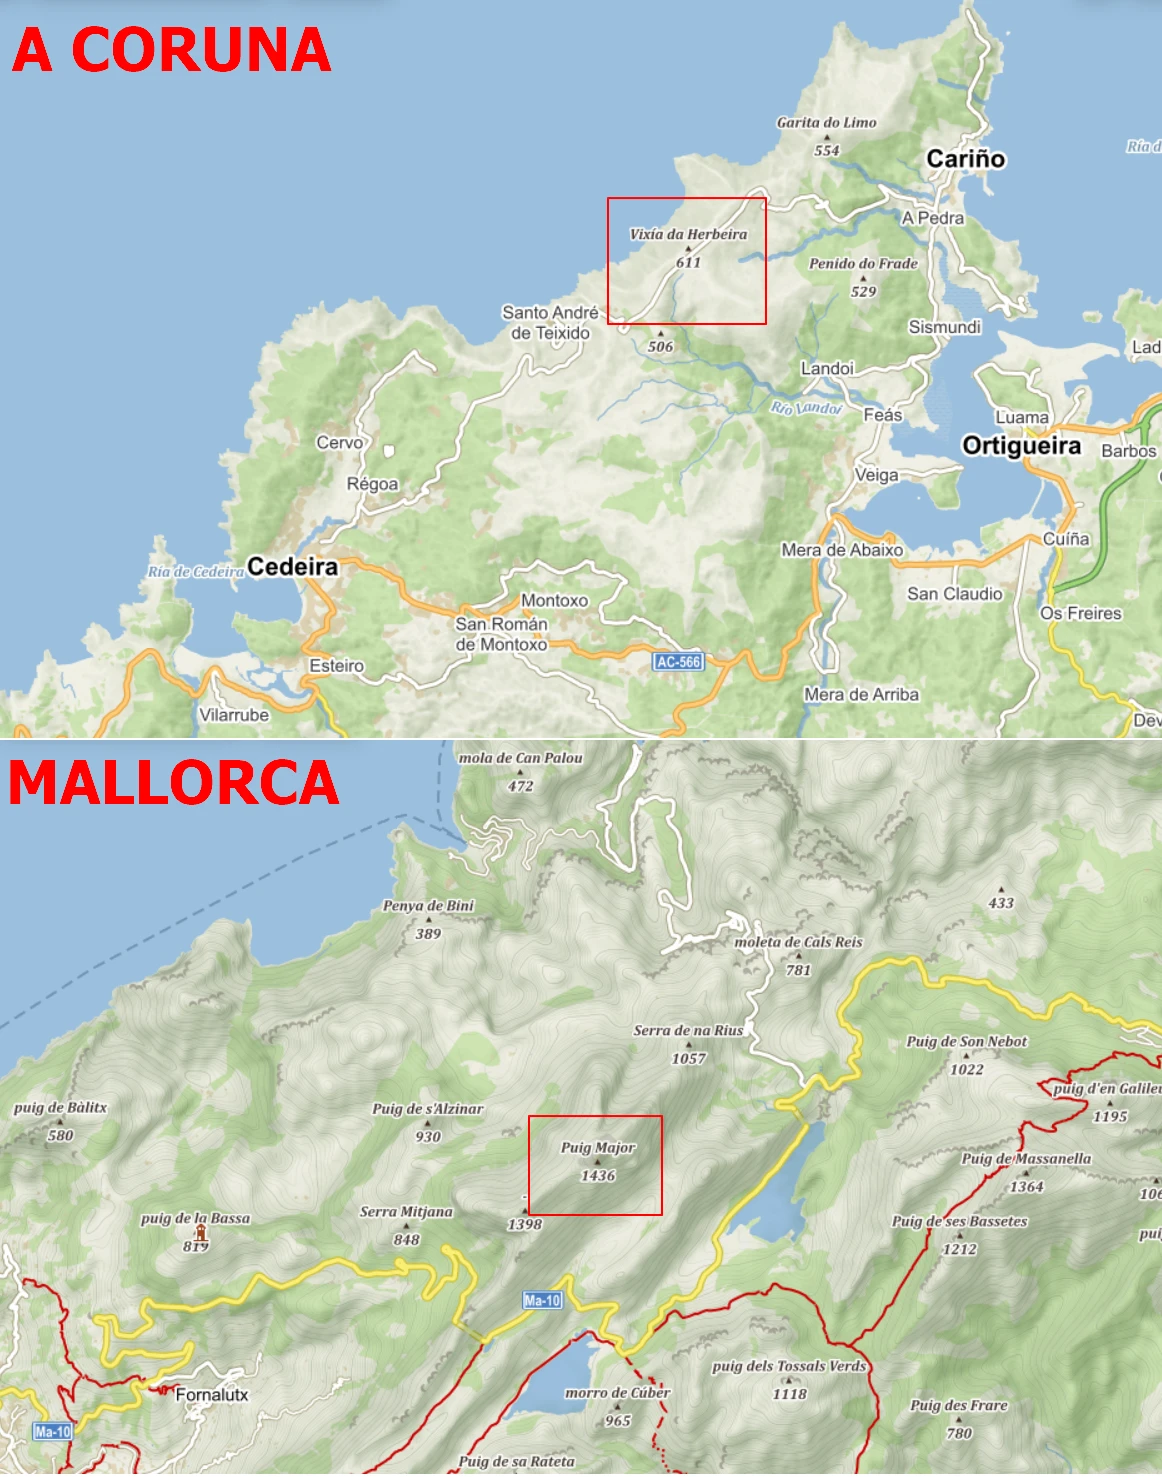
Another thing, which can be spotted, when we are significantly elevated above the sea body is the perspective effect. Both Sun’s glitter disappearing and reappearing increases its pace, from the observer’s point of view. The light transition phenomenon also plays an important role here. Before the totality begins, we can see how the Sun’s glitter ceases abruptly before the dark area beyond. When the eclipse is about to finish, apart from the bright Sun’s glitter reappearing far away, we can see also the solar corona light reflected at our plane of incidence. Another very important factor is our height above sea level. As we are located higher, then this whole phenomenon is better seen and a bit lengthened because we have a long line of sight. In relation to the 2026 total solar eclipse, undeniably the best place to see it will be Spain. There are at least 2 spots considered (Pic. 36), where one is the Vixia da Herbeira hill – a fantastic viewpoint rising over 600 meters above sea level in the A Coruna province and Sierra de Tramuntana at Mallorca, where you can see the Mediterranean Sea surface from the highest mountain – Puig Major, rising 1436 meters above sea level as well as many other peaks reaching around 1000m.a.s.l. In both places, you can get about 1m40s of totality.
VIII. HORIZONTAL VISIBILITY EXTENSION (SPAIN) – staying by the Sierra de Tramuntana mountain range at Mallorca island, we should mention one interesting fact. The Puig d’en Galieu is the peak, from where the World’s longest distance within one country has been captured. It’s roughly 324km between this peak and Pic de Saloria in the Pyrenees. The Puig d’en Galieu towers above the Lluc sanctuary.

Because the direct light scattering stops when the air is shaded totally, the horizontal visibility is extended. There are 2 factors, which determine this situation. The first one is the significant reduction of light scattering at the air molecules and haze particles, in which the effect of the light reflected from distant features is not as much interfered with. The second reason is the contrast, which is significantly higher between shaded objects and the sky just above the horizon, illuminated by the sunlight outside of the umbra. In the case concerned, only the first factor would work, as the Pyrenees won’t experience the totality. Nevertheless, the eclipse situation might be helpful for someone, who wants to repeat this long-distance observation record. Another occasion to get a spectacular distant view is the Tell Atlas towering on the Algerian coast (Kef Seba – 1025m.a.s.l. above Annaba) from Sulcis Mountains in Sardinia at a 260-270km distance.
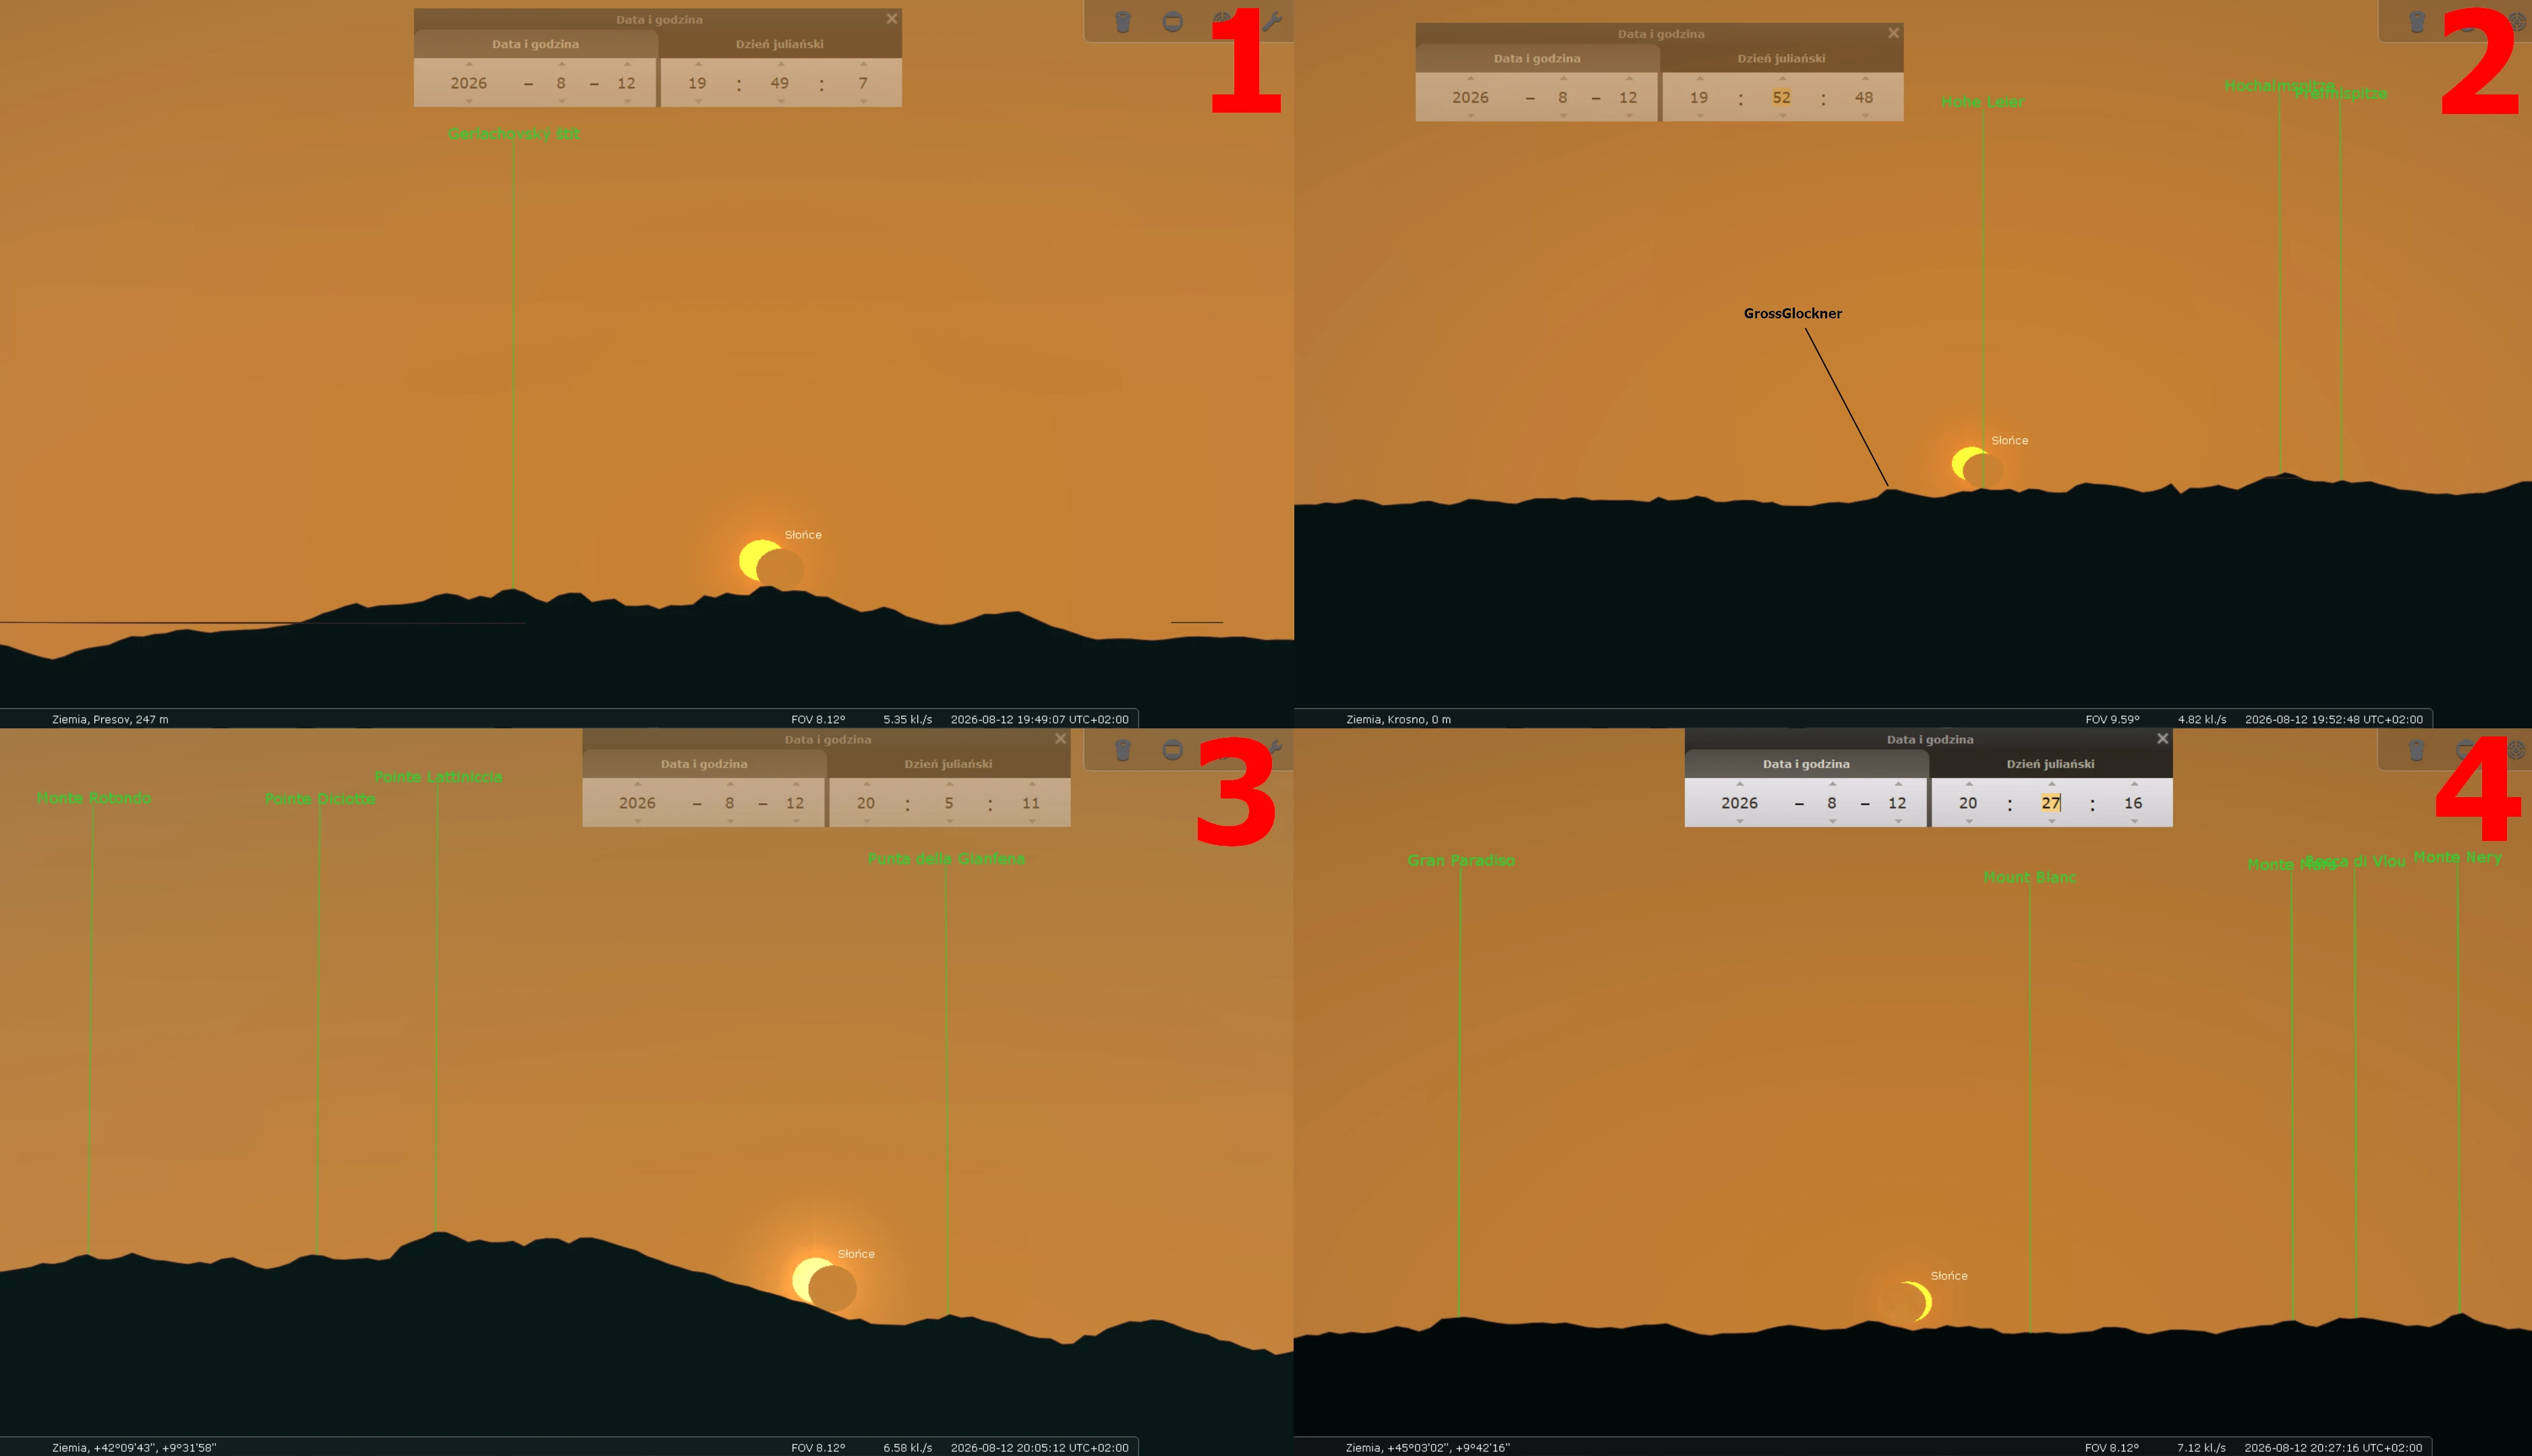
IX. CRESCENT SUNSET BEHIND HIGH MOUNTAIN RANGES (EUROPE) – the rare event, when the Sun goes under the horizon not as a disk, but as a quite thin crescent. The 2026 solar eclipse will have a significant impact on the evening time, as virtually everywhere in Europe, the obscuration will be not lower than 80%. On top of that, the moment of the greatest eclipse will predominantly fall near sunset or just after sunset. It means, that the moment, when the Sun goes under the horizon will be so spectacular, especially in the regions with nice mountainous views on the horizon. On August 12, 2026, some Europeans will be fortunate to witness one of the most spectacular sunsets ever, by seeing the crescent Sun plunging beyond high mountain ranges and some most renowned peaks (Pic. 38, 39).

There are only 4 examples presented above, but the same situation will apply to the Sierra Nevada and others located in Europe. An observer will see the setting eclipsed Sun. The most spectacular crescent is believed to be observed in northern Italy, where the greatest phase will coincide with the sunset.
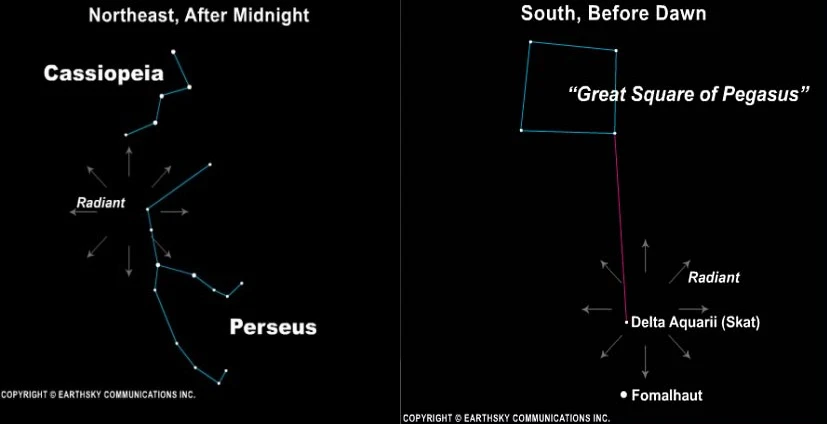
X. THE PERSEID METEOR MAXIMUM – August 12 is usually the peak of the Perseid meteor shower, which is the remnant of the Swift-Tuttle comet returning near the Sun every 133 years. The most intensive shower can bring even 300 meteors per hour as happened in 1993, a year after the comet recently passed the inner Solar System. In the situation of a total solar eclipse, the most important is the possibility of the occurrence of the brightest fireballs with apparent magnitude -3Mag and higher. The thing, that can make the meteor shower brighter is the orbital resonance in the Solar System, which in the Perseid meteoroid stream involves three bodies: the meteoroid particle, Jupiter, and Saturn (Sekhar, Asher, Vaubaillon, 2016). We recently saw the intense Perseid showers in the early 1990s, and the next situation like this is going to happen around 2111, which corresponds more or less to one orbital period of the Swift-Tuttle comet, although it still requires further research. Despite the lack of this resonance in 2026, we will still enjoy a good meteor shower, knowing that the Perseids are one of the most plentiful showers with an average of 50-100 meteors per hour, threading its way about 2 meteors during the 2026 totality. The best chance to spot the Perseids at the same time, when a total solar eclipse is occurring will have observers at the northern part of the path, where the Perseid constellation remains above the horizon throughout the entire day. The Perseid constellation is the section of the sky, where the Perseid radiant is observed – the point in the sky, from which this meteor shower comes (Pic. 40).
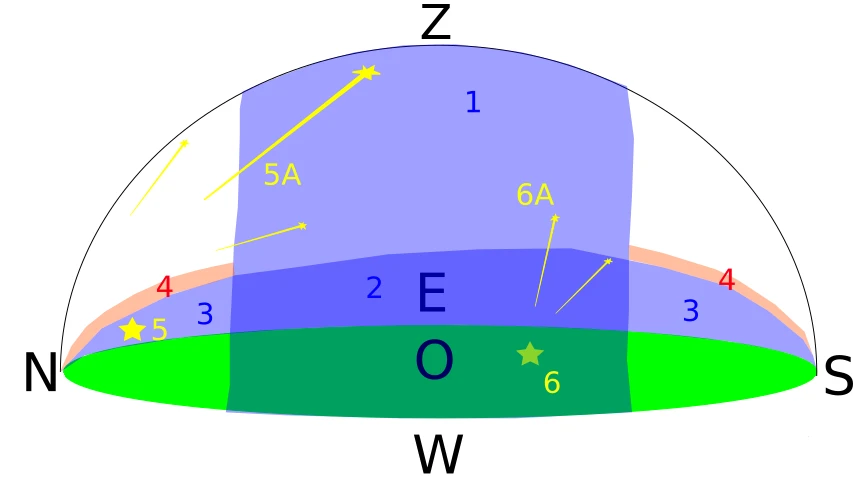
It’s good when the radiant is above the horizon, then we have a better chance to enjoy the shower, however, we shouldn’t look directly into the radiant point itself. The best way is to chase the meteors and fireballs about one-third of the sky down and away from it. In this case, we might have also an opportunity to spot some unusually bright Perseid meteor somewhere within the eclipse path in Spain, where the Perseid constellation will be just beneath the horizon at the time of the greatest eclipse (Pic. 41).

A tad better conditions will occur in Italy, Tunisia, and Malta, where the totality will fall beneath the horizon around the end of civil twilight. An observer should spot not only the fireballs but also other, less bright meteors fleeting across the sky. The Perseus constellation should be rising from that location during the eclipse. The Perseids in general tend to be bright, so it shouldn’t be a problem to spot at least one of them during the eclipse, especially when it occurs low above the horizon. During the evening hours, when the Sun is about to set, the sky is usually a bit darker than during the afternoon. Any additional loss of brightness increases the chance of seeing an event such as this. In the areas located at the extension of the totality path, the view of the Perseid shower is more likely, as the double darkened sky (by the twilight and lunar shadow) gives the way for more meteor light to get through and be visible for an observer. As a result, we are able to see the fleeting meteors more often. The frequency of 50-100 meteors per hour refers to the nighttime conditions, where the sky is dark. Even the moonlight can reduce the number of meteors visible. The probability of spotting the fireball during the total solar eclipse is really low then, although not impossible. What is comforting, is that along with Perseids the Delta Aquariids appear at the same time in the sky. Their peak of activity falls on July 28, but they can be still observed till August 23. Their radiant is located on the other side of the sky (Pic. 40) and will be just below the horizon at the time of the greatest eclipse. The same as previously, for areas, where this totality occurs below the horizon, the chances of chasing the meteors will be slightly bigger.
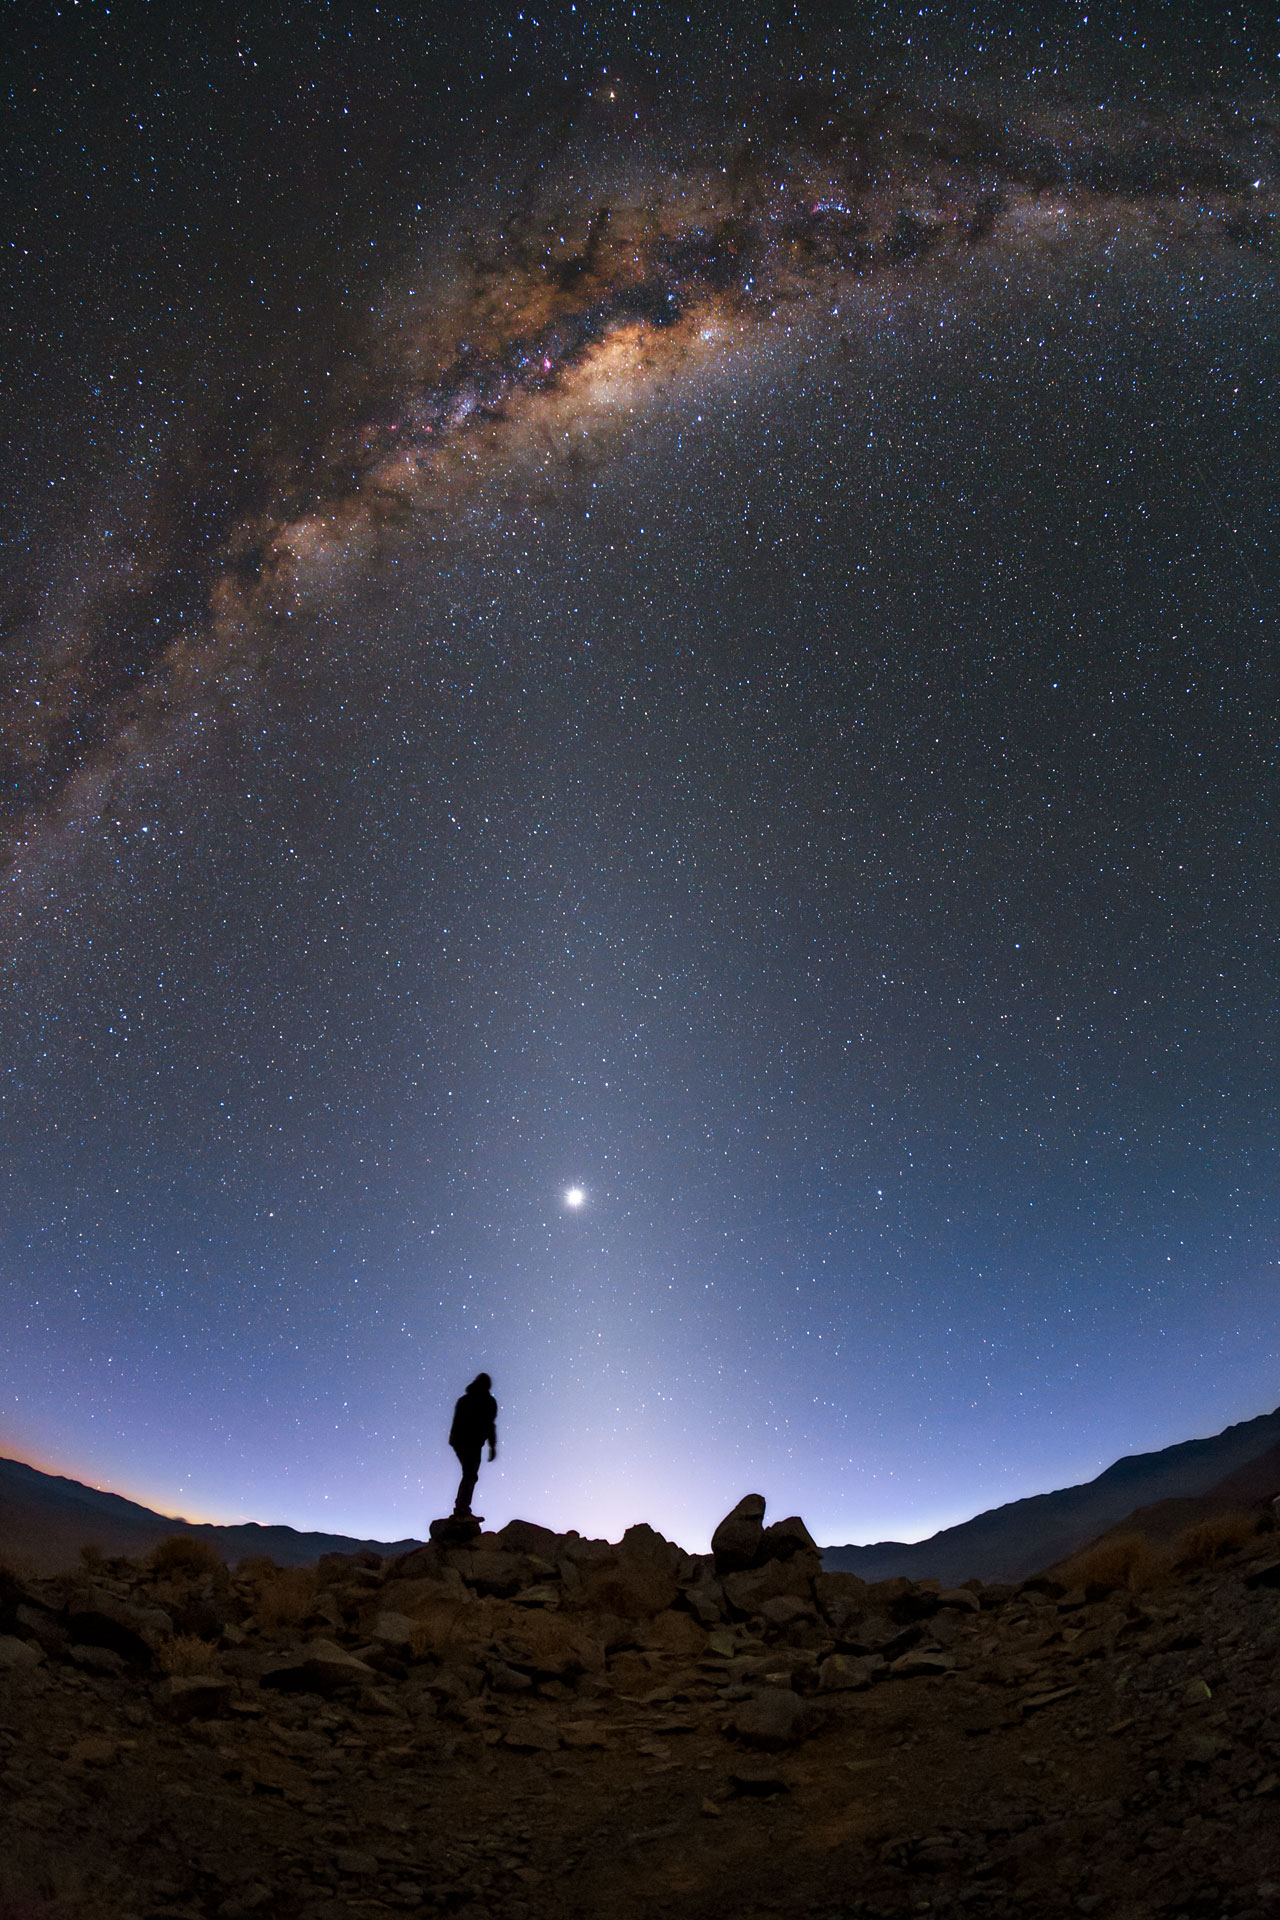
XI. TOTAL SOLAR ECLIPSE BELOW THE HORIZON AND ZODIACAL LIGHT (ITALY, ALGERIA, TUNISIA, MALTA, GREECE) – This option has been already discussed in terms of total solar eclipse below the horizon of June 30, 1992 (Guliaev, 1992). Because it was only the proposal, we don’t have visual proof of the observation such as this. The good occasion is going to happen in August 2026 in the Mediterranean region, where the totality will fall predominantly below the horizon. The zodiacal light is visible as a softly bright cone of white light, which extends from where the Sun is located below the horizon outward and upwards along the ecliptic. The brightness of zodiacal light is similar to the brightness of the Milky Way, so these 2 objects in the sky can be sometimes mistaken. However, during the best conditions, the zodiacal light can be significantly brighter than the Milky Way. The zodiacal light is produced by the sunlight scattered at thin dust particles from the inner Solar System. A part of this dust is thought to have been leftover after all the planets were created about 4.5 billion years ago. The dimension of these dust particles reaches usually 0.1mm, and not as much as 0.3mm. They are probably within a few miles distance from each other. Between them can be some other, meter-sized bodies. All of them feature the biggest density around the Sun and extend outward beyond the orbit of Mars. Another part of this dust occasionally originated from comets or rare collisions of asteroids between Mars and Jupiter. The size of this dust is not always the same. The probability of collisions between each other or space weathering makes their dimensions smaller. If it falls beneath 10 micrometers, the grain is removed from the inner Solar System by solar radiation pressure.
The brightest zodiacal light always appears in the immediate vicinity of the Sun. Hence the best conditions to see it occur shortly before dawn or after dusk. Important is also the season when the zodiacal light can be observed successfully. It’s usually the moment near the equinox when the ecliptic is the most straight-up against the horizon. At the vernal equinox, the best chance to see this cone of eery light is after dusk, because the ecliptic rises higher against the celestial equator and consequently higher above the western horizon making it more intensive at once. At the autumn equinox, the situation is the opposite, and the best zodiacal light is visible before dawn. It applies to the northern hemisphere, where the 2026 total solar eclipse will happen. The southern hemisphere is exactly upside down. Unfortunately, the 2026 solar eclipse conditions won’t be as favorable as considered, because the eclipse will occur near sunset when the ecliptic will be more parallel. However, a quite low latitude might be helpful and will allow observers to spot this hazy pyramid.
The zodiacal light is also called false dawn or false dusk, because of the significant amount of light visible just before or after the twilight occurrence. This situation is driven by forward sunlight scattering on the dust particles described above. In practice, the zodiacal light extends much further away from the Sun, although is fainter. In theory, an observer could see a slightly illuminated band of dust across the entire sky, which marks the same path, as the Sun follows during the day. Next, this faint band of dust leads to Gegenschein, a faintly bright spot in the night sky, marking roughly the antisolar point. This dust band near Gegenshein scatters light backward, which makes its intensity significantly reduced and not as obvious to spot as zodiacal light near the solar azimuth. The zodiacal light, leading next through the dusty band to Gegenschein (or counterglow) is called the zodiacal band.
The zodiacal light can be followed visually from about 22-25 to 90 degrees away from the Sun but along the ecliptic. It can be considered as the F-corona of the Sun, which is created by sunlight bouncing off the interplanetary dust.
As it has been told earlier, the zodiacal light can be considerably brighter than the Milky Way under good conditions. The zodiacal light is always the broadest and brightest near the Sun. Unfortunately, because of the light scattering in Earth’s atmosphere, we can’t see it until the astronomical twilight. We know, that the brightness of zodiacal light at 30 degrees away from the Sun is about 2330 sVis, which corresponds to 0.0016077 Nits and 0.005050734243 Lux. I’ve explained this conversion earlier in this article. The brightness of about 0.005 Lux means, that in the best conditions possible, the zodiacal light should be detectable yet at the end of the nautical dusk. An observer theoretically could see this hazy triangle even more intensely when moves its sight closer to the Sun. The problem is the Earth’s atmosphere, which scatters the sunlight stronger in our point of view. Even if the zodiacal light can be detectable at the beginning of astronomical twilight it won’t look bright, because it will be faded out by the still bright sky. Considering the outlook at 30 degrees from the Sun, we effectively get it only 12 degrees above the horizon at the edge of astronomical twilight. Moving our sight further down, this phenomenon should look brighter, but everything depends on the atmospheric extinction, which can make it fainter in appearance. Anyway, the zodiacal light at this angular distance from the Sun appears to be about 4x brighter than the Milky Way at its equator. At the angular distance of 8 degrees from the Sun, the zodiacal light can be 25 times as large as at the distance of 37 degrees (Fesenkov, 1961). There are quite a lot of images of zodiacal light under astronomical twilight conditions (Pic. 43, 44) when it is distinguishable enough.
Due to its significant brightness compared to the night sky, the zodiacal light is one of the benchmarks for the Bortle scale. It’s usually visible up to the 5th class of this scale, which corresponds to rural areas. Everywhere, where the sky is completely free of light pollution, the zodiacal light can even cast a shadow. Not to mention, that in conditions such as these, this faint light band can stretch from one horizon to the opposite one. When we look at zodiacal light about 60 degrees from the Sun, then its brightness can be comparable with the brightest parts of the Milky Way. The faintest appearance of the zodiacal band is usually around 140-160 degrees from the Sun with the sky’s surface brightness about 22,2 mag/arcsec2.
Unfortunately, the very brightest part of zodiacal light can be never seen from Earth, because of the aforementioned illuminated atmosphere. The total solar eclipse below the horizon can significantly facilitate the observation of inner F-corona, at least in a theoretical sense. The reason behind it is, that the sky surface brightness doesn’t increase as fast towards the horizon as under non-eclipse conditions. The dust lying closer to the Sun scatters the light more intensely and presumably can surpass the brightness of the eclipsed sky. There are some reports of the zodiacal light observation by the eclipse conditions even when the Sun was high above the horizon. For example, in June 1936 and July 1878, the “beam of light inclined at an angle of 45 degrees” was reported and it was as wide as the Sun (Smiley, 1938). The view could be very similar to early astronomical dusk. However nowadays, when a lot of planes traverse the upper troposphere from one side of the globe to another, we should also consider the possibility of observing the zodiacal light from the cruising altitude. At about 10km altitude, we can see the zodiacal light in the vicinity of the eclipsed Sun (Rense, Jackson, Todd, 1953), because the luminance of the background sky is reduced with sufficient rise of the observer (Fesenkov, 1961).
The conditions on August 12, 2026, won’t be the best, but they might be still favorable to watch or at least detect the zodiacal light in the fully eclipsed sky, taking into account that the solar eclipse in Spain will occur just before set when the sky is less bright than during the afternoon. It’s worth considering watching the eclipse impact below the horizon, not necessarily within the total path but also outside. In both cases, the twilight will be enhanced. Since the sky brightness inside the umbra at daylight conditions is equal to the end of civil twilight, we should expect the nautical twilight conditions somewhere within the extended path of totality at solar depression about 6 degrees or even less. This configuration would make the zodiacal light visible even from Sicily in Italy at the greatest eclipse phase below the horizon. An observation such as this can be tested also for other eclipse locations with smaller solar depressions.
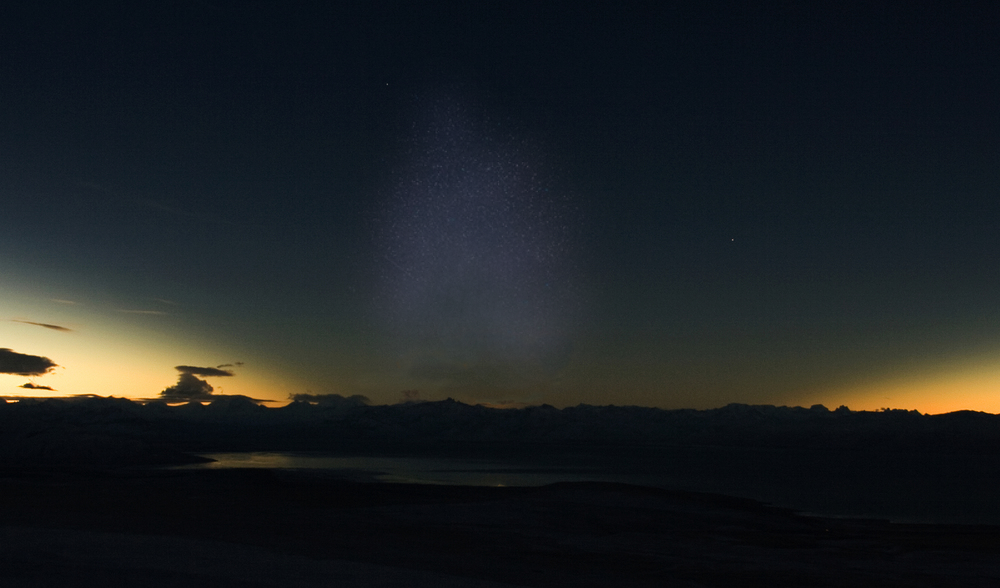
XII. ACCELERATED AND DISTURBED TWILIGHT (CENTRAL AND SOUTH EUROPE, NORTH AFRICA) – will be undeniably the most visible eclipse impact on the Earth’s atmosphere both in the umbral and penumbral area. In Europe there is no place with obscuration lower than 79.5%, so anyone should notice, that twilight will be quite weird. Depending on the location against the terminator line at the greatest eclipse, some of you might see accelerated twilight, which will tend to be flattened for a while. A similar phenomenon has been observed recently in Namibia, where the greatest eclipse occurred for solar depression between 2 and 14 degrees (2-10 degrees recorded by webcams). According to these studies, twilight has been accelerated by 2 degrees on average, which corresponds to the end of civil twilight at 4 degrees of solar depression instead of 6. The dusk was quite eerie, making the scene darker than usual (Pic. 44).

The eclipse’s impact on twilight across Europe and North Africa, where the greatest phase is deep enough, will be significantly visible by the darkening and slight reddening of the sky. Therefore, the Belt of Venus’s appearance can be interesting, because of enhancing the reddish tinge. The acceleration of dusk by 2 degrees will definitely bring forward the visibility of stars and other celestial objects, which appear after sunset according to their brightness. It applies also to zodiacal light, which conditions to observe will be better as moves southwards from the extended path of totality. It will be definitely an unusual moment for some good celestial observations of the sky section being closer to the Sun. The eclipse twilight should feature two separate moments of the same sky brightness when the second one will follow after the greatest phase of the eclipse. The penumbral impact should be visible relatively long after the eclipse because of a proportionally smaller amount of light scattered in the atmosphere, which has been observed recently in Namibia.
XIII. BAILEY’S BEADS AND FAINT SOLAR CORONA ACCOMPANIED BY GREEN FLASH – is such a formidable optical event, especially when combined with all the mentioned elements. There are 2 locations at nearly the same distance against the very end of the observed 2026 totality. One of them is Isola di San Pietro, just 7 km west of Sardinia or the Sulcis Mountains in south Sardinia and another one is the Collo Range in the Tell Atlas, located just above the Mediterranean coast in Algeria. This one seems to be the most intriguing in terms of the very end of 2026 totality, as the hills in this range are as high as 1100m.a.s.l, and furthermore not forested in total. It means, that from many places located especially between the Kanoua and Siouanne (Pic. 46) villages an observer could be witnessed even Baily’s Beads under some great conditions.
First of all, the mathematical end of the eclipse occurs somewhere east of the Balearic Islands, although it states roughly the greatest eclipse phase at sunset. The sunset is understandable as the moment when the upper limb of the solar disk is gone. because the totality has its own time, which is roughly 1m30s at the end, we should be aware of another 45 seconds of totality before the greatest phase, which is visible “beyond” the line calculated by Fred Espenak. It extends the path of totality another tens of kilometers. Another very important issue is the horizon dip, which is noticeable as we move up from the sea surface. In the case of Algeria, it’s going to be over 1 km up, which would result in even 1 extra degree below the horizon being visible as normal. Obviously, we cannot forget about the atmospheric refraction lifting up the celestial bodies around 35′ up at the horizon line. The combination of these 3 elements leads to the assumption, that this smallish part of Algeria as well as the southernmost parts of Sardinia could really witness Baily’s beads observation at the obscuration of 99,86 – 99,89% (Pic. 46 – 47).


As mentioned, a very similar situation will happen in Sardinia, in the Sulcis Mountains rising about 1000-1100m.a.s.l. above sea level. There will be even better, as the southern part of this range lies roughly at the extension of the totality path. We also should expect a nearly 1-degree horizon dip with the spectacular view of totality with a half solar disk plunged already into the sea (Pic. 48 – 50).

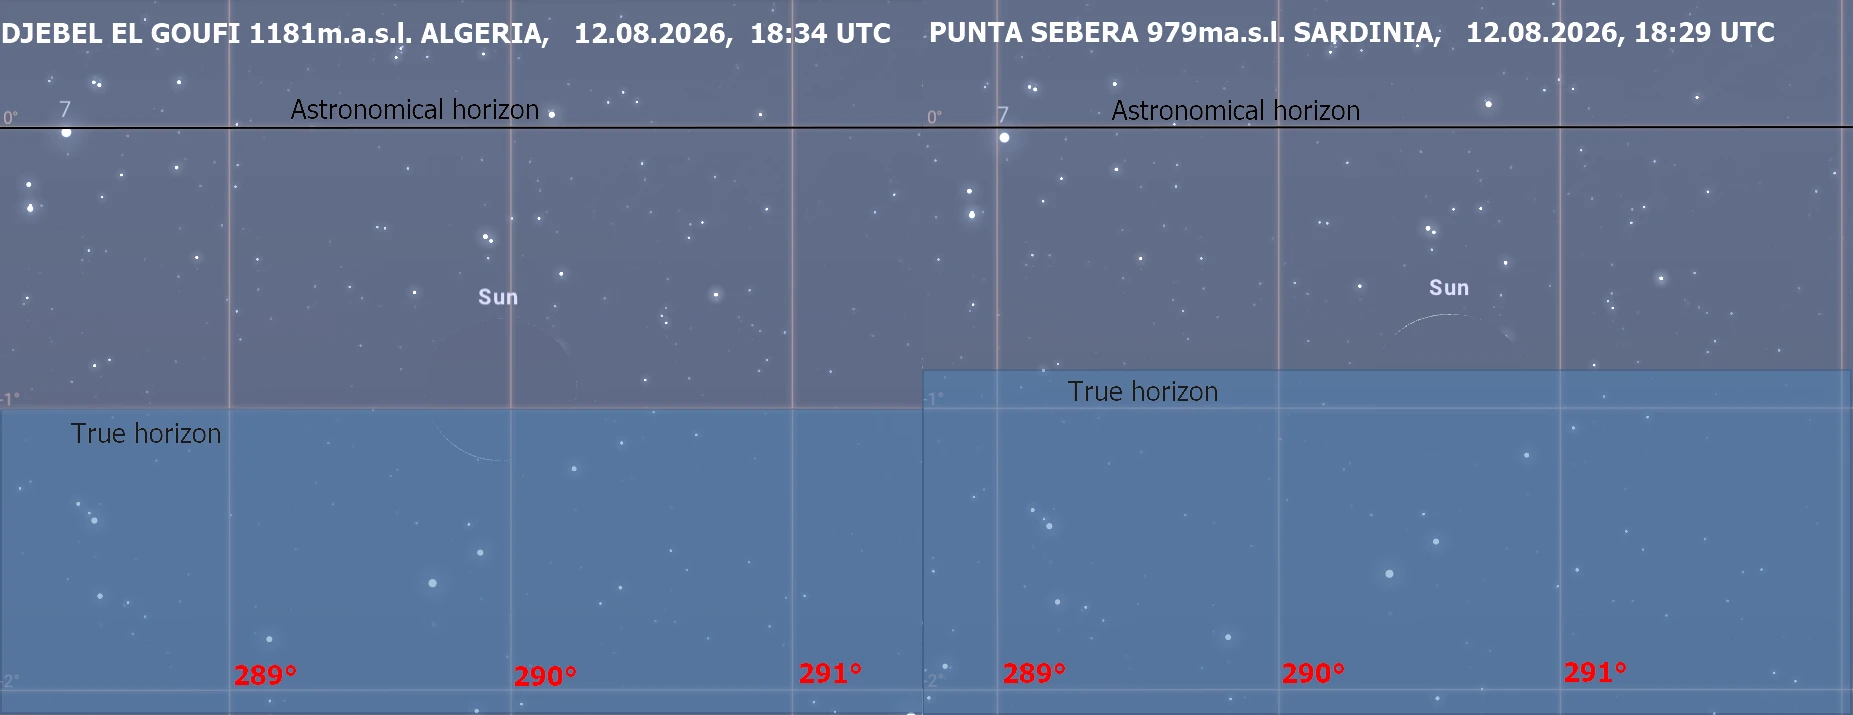
Furthermore, the solar corona would be also visible from the Mediterranean horizon. In this case, we cannot exclude some optical events like green flash or green rim, observed by the Sun or Moon (Pic. 50).
The green flash is produced by the separation and refraction of the light in Earth’s atmosphere. The light is dispersed as a prism and separated between different colors. The various colors of light bend in different amounts based on their wavelengths. Short wavelengths like blue or green refract more strongly than longer wavelengths (orange). Blue, violet, or green wavelengths are scattered by Earth’s atmosphere, while red, orange, or yellow are absorbed. It leaves the green light being the most visible for a few seconds at sunrise or sunset. Apart from the green flash sometimes the yellow or even blue flash might occur. The blue flash is extremely rare, as the blue light is scattered away. The green flash happens more often at sunset than at sunrise. It’s still a quite rare event, which can be seen under stable and clear air when more of the light from the setting Sun reaches an observer without being scattered. Unlike the green flash, the green rim is more often observable, although not possible to see by the naked eye. These optic phenomena will be definitely explained here in the future.

There is also another region in Algeria, where the eclipsed sunset can be so spectacular with potential green flash occurrence above the solar corona. The Azeffoun port, located around 100 km east of Algiers will experience the greatest eclipse roughly at sunset when the lower solar limb will be under the horizon. On the opposite side of the eclipsed solar limb, an observer will be able to spot the faint solar corona. The corona will be probably enhanced by the sunset transition phenomenon resulting lack of direct sunlight scattering to the observer. On top of that, both refraction phenomena and green flash might accompany this rare event!

The Sardinian coast and Isola di San Pietro do have not enough elevated lands for observation such as this. In both locations, the eclipse phase roughly at mathematical sunset will reach 92% with around 6 minutes missing to the greatest eclipse (Pic. 52, 53). As the observer is located higher, he can witness a deeper phase of the eclipse at the moment when the Sun is gone beyond the seawater.
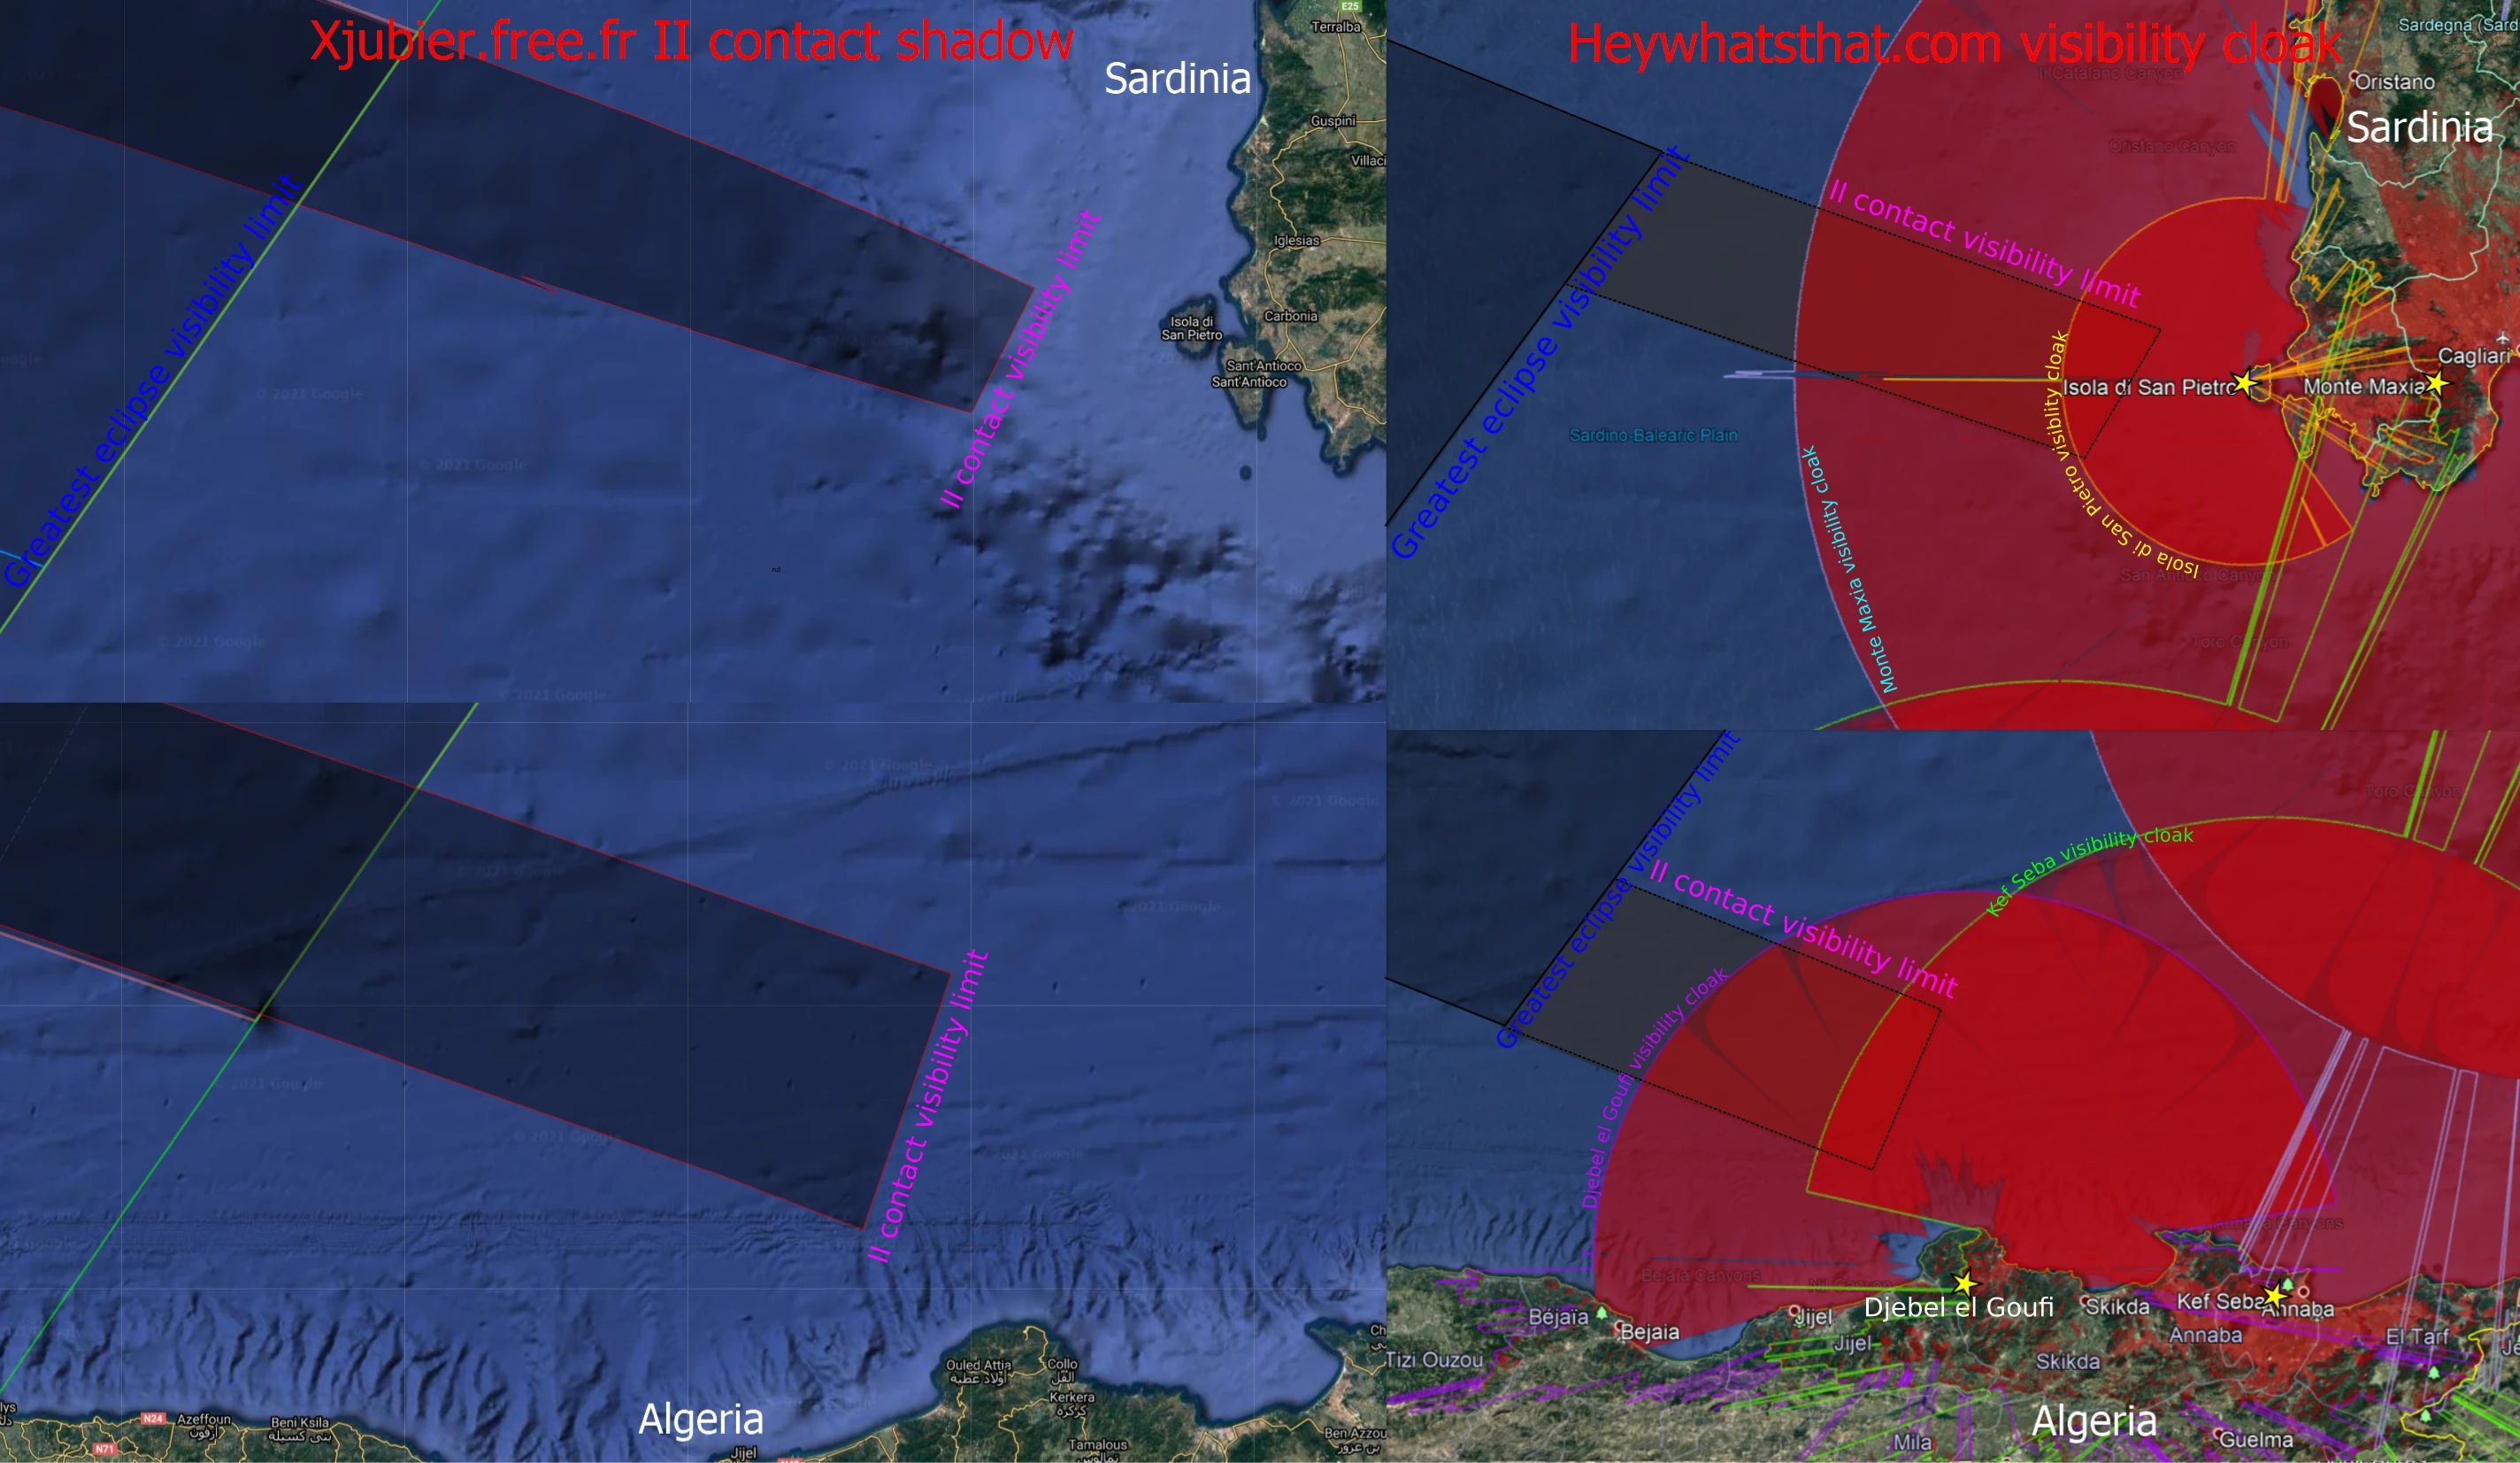
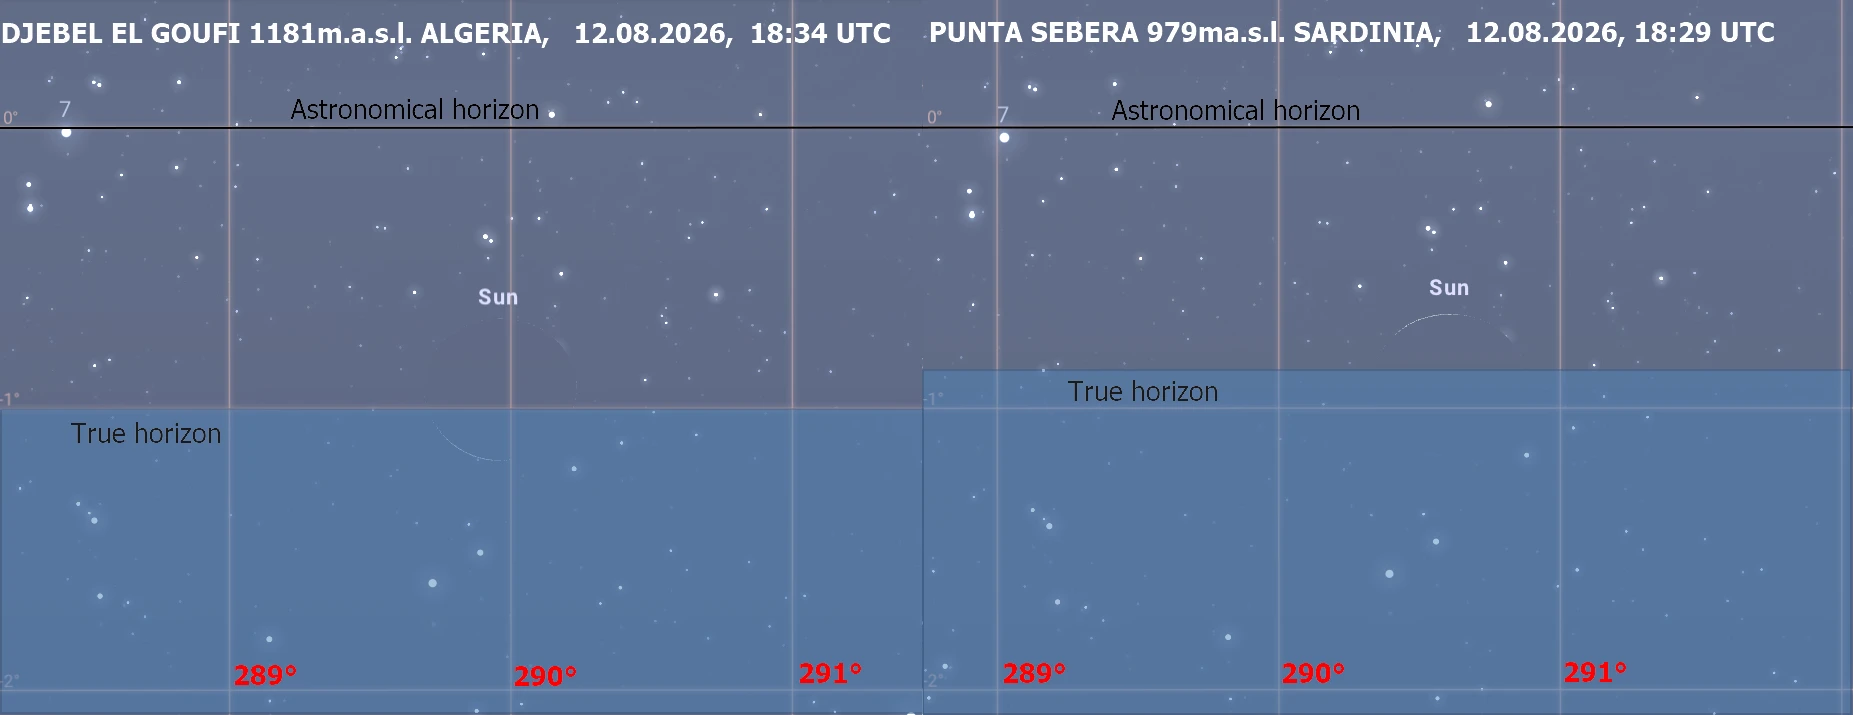
XIV. CRESCENT SUNSET INFERIOR MIRAGE AND OTHER REFRACTION PHENOMENA (CORSE, SARDINIA, BALEARIC ISLANDS, ALGERIA) – might also be visible under some favorable conditions. Since light rays come from a particular distant object, they travel through nearly the same layers of air and are refracted at about the same angle. As a result, rays arriving from the object’s top will arrive lower than those arriving from the bottom, making our object image finally upside down. It makes the appearance that the distant sky image is a specular reflection on a waterbody functioning as a mirror. It’s typical for the situation when the surface is warm or hot, but the air above is cooler. It’s highly likely, that the described phenomenon won’t be visible at the 2026 eclipse, because it’s summer. The Mediterranean summer features high temperatures and a lot of sunshine hours. It definitely excludes the inferior mirage occurrences, especially since we are considering the evening, which is warmer than the morning. However if, for example, some polar air mass would enter the western Mediterranean region just before the eclipse, then the phenomenon would happen. It wouldn’t be expressed as much as we know from the desert areas or hot tarmac, but an observer would see the inferior mirage restricted by the vanishing line (Pic. 54), cutting down the base of the distant object.
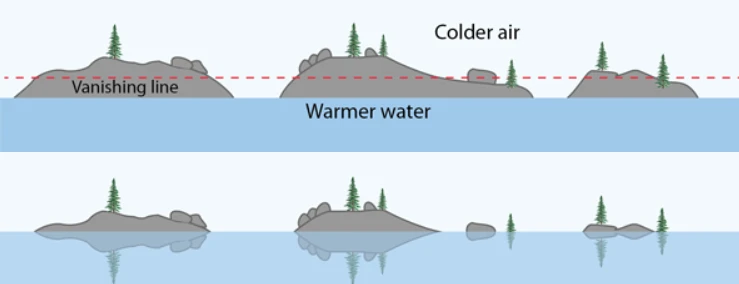
It happens because the light rays arriving from the top of the object don’t let the arrays arriving from the very bottom of the object be visible to an observer. It makes some “line”, below which all the rays are refracted over the observer’s position. As a result, an observer cannot see the objects below this “line”. In exchange for the very bottom part of the distant object, an observer is capable of seeing everything above the vanishing line and corresponding points in the inferior mirage below that level. The best image examples of the crescent Sun’s position roughly or near the vanishing line come from the 2019 solar eclipse observed from Qatar’s coast at sunrise (Pic. 56).
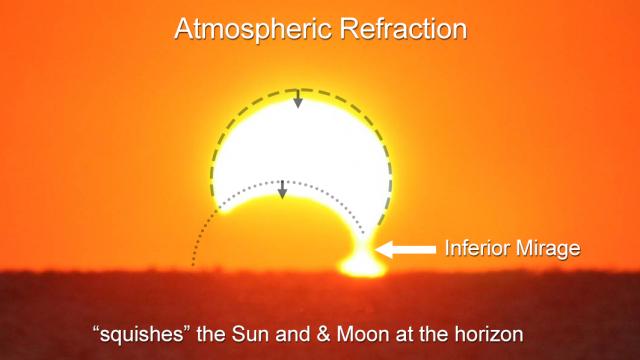
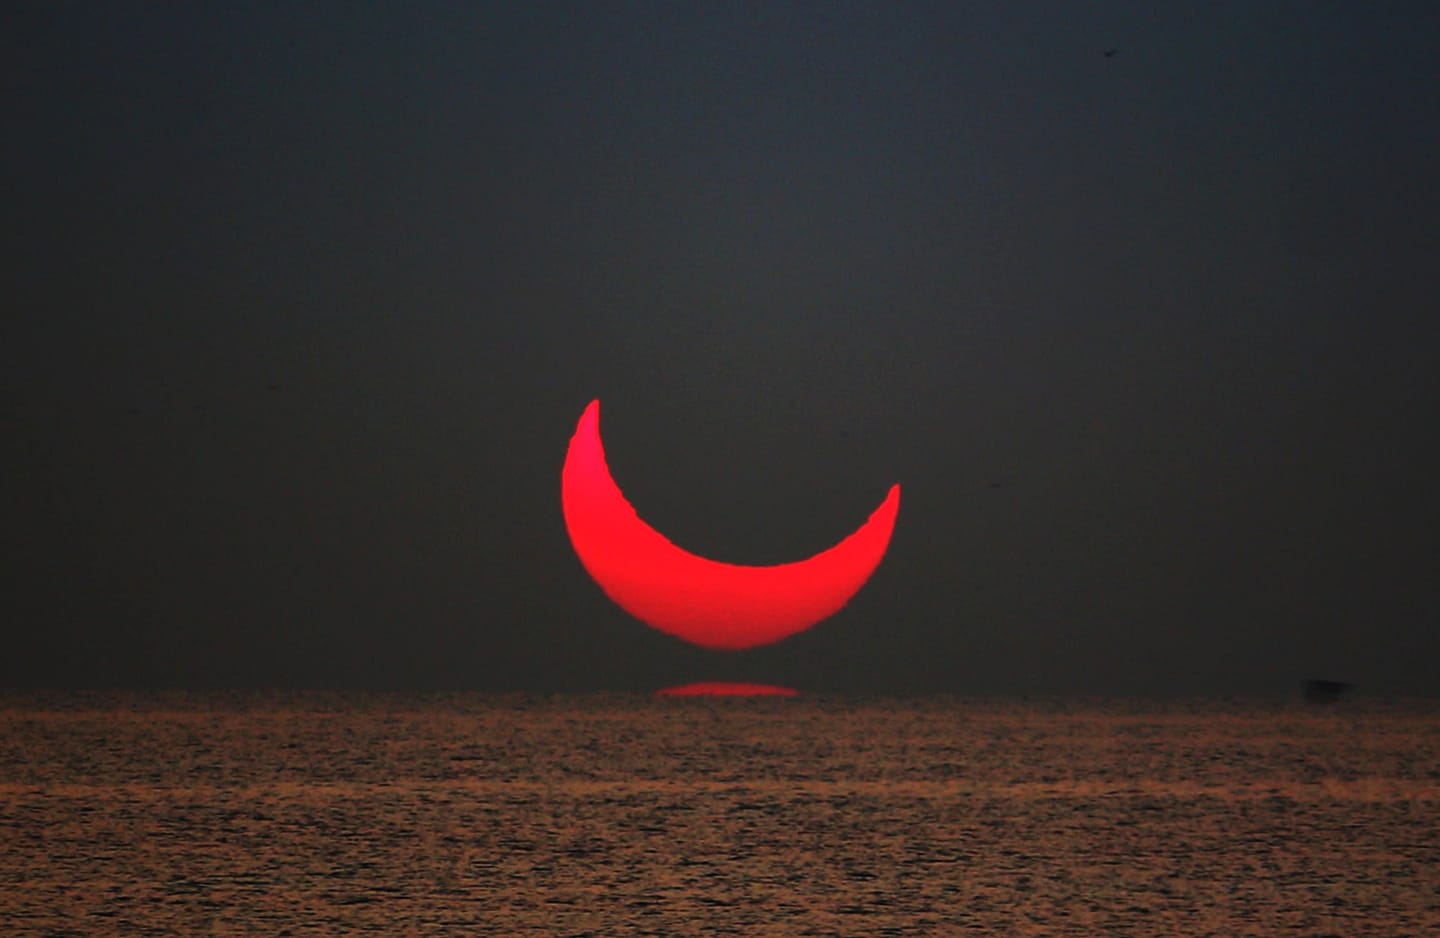
In the best-case scenario, a similar crescent Sun view can be gained on August 12, 2026, which will look spectacular in locations, where the obscuration at sunset is to be higher than 80% (Pic. 57).

The most spectacular view is possible at the Algerian coast between Djinert and Tigzirt resorts, where the sunset will occur roughly at the greatest phase of the eclipse with 99% obscuration. The inferior mirage can be unforgettable shaping the tiny crescent Sun, like mirrored parenthesis. Other locations, where this phenomenon might be quite clearly visible stretch across the Tell Atlas advancing of the Kef Seba hill towering above Annaba. There are quite a few mountains with altitudes crossing 1km above sea level, lowering the horizon down to almost 1 degree (Pic. 46).
A similar situation is to be observed near Alghero at Sardinia island (Pic. 57). In general, the event will be worth seeing from the Corsican coast, through the Sardinian coast, the Balearic Islands, and finally at Algerian shores east of Algiers.
Another phenomenon, which can be observed is also the mock mirage, which is produced by the atmospheric temperature inversion. Usually, it appears like flashes, which are just under the astronomical horizon and refraction helps them to be visible to an observer.
3. SUMMARY
This long article presents the uniqueness of the 2026 total solar eclipse, which will occur mostly in Europe. This otherness arises out of the eclipse geometry, which is somewhat typical for each saros when the absolute Gamma value is close to 1. As a result, the lunar shadow is not evenly spaced across the Earth’s surface, making some big parts of the planet seriously affected by penumbra near the terminator line. This influence can be expressed mostly as the disturbed twilight period, which appears to be the widest and most common phenomenon to observe on the August 12 evening. The brief explanation at the top is helpful in understanding the geometry of an eclipse such as this in 2026. The specificity of this solar eclipse implies a few rare optical phenomena, which can happen at the same time. Some of them, like the accelerated twilight, are sure, but others are only probable. Their optical properties define the various degrees of probability of their occurrence along with the greatest phase of the solar eclipse. In fact, the number of visualizations used here leads to the question of their credibility. Are they extremely rare enough, because no one captured them in modern history or maybe there is no chance to see them in a configuration such as this? I think, the best answer to this question will come on the eclipse day for people, who will be fortunate to be in the locations considered here. Our goal for the forthcoming years is to raise awareness of the beauty and uniqueness of this eclipse with its extension below the horizon too.
The best conclusion of this article is an interactive map including all the phenomena concerned. You can enter the link below, click any of the items, and see the short description, which will be probably developed further (Pic. 45).
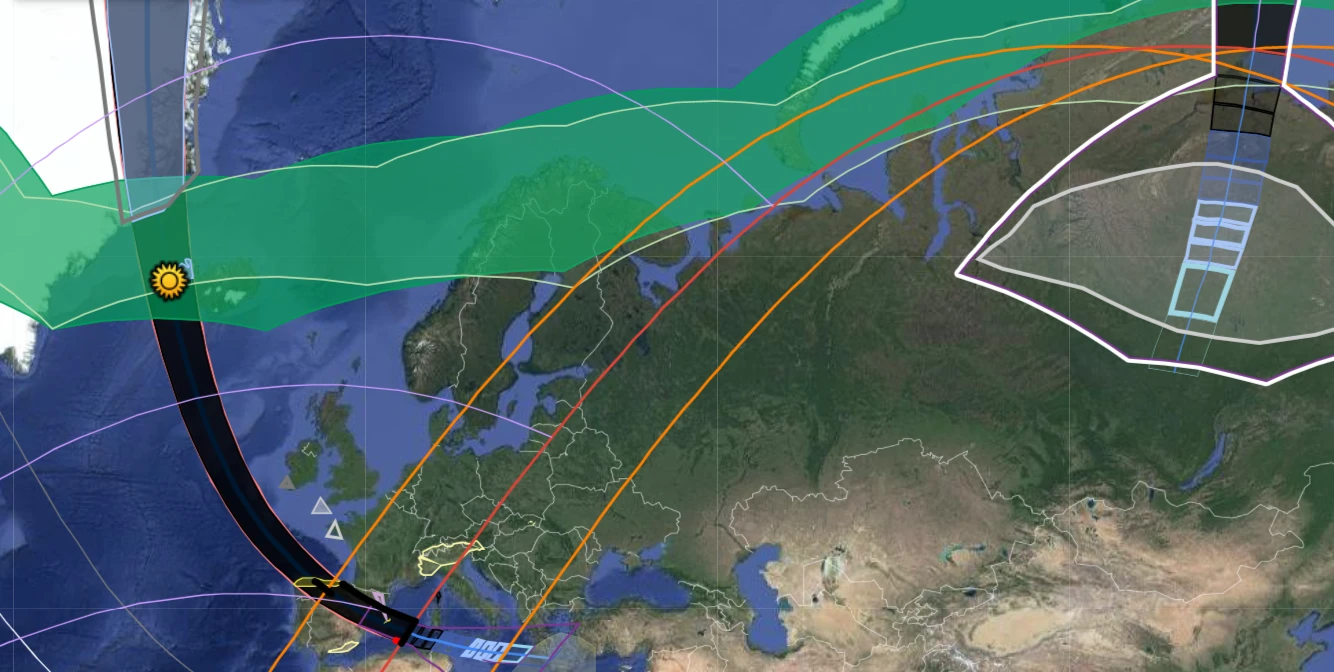
The map includes a standard .kml file derived from Xavier Jubier’s eclipse page with all interesting things, which are more or less plausible to observe both by the eclipse chasers and casual people, inhabitants of some areas. The Mediterranean region has really potential with the population watching the evening sky on August 12 even accidentally. Our role is to make them aware of this moment, which in my opinion cannot be missed out. The multitude of references and links in this article indicates somewhat further areas of study on the various astronomical and meteorological phenomena in relation to the optics of Earth’s atmosphere. Some optical events can occur also during other solar eclipses. So far it should be clear enough for everyone to understand the importance of the 2026 solar eclipse.
Mariusz Krukar
- Baker D.J., 1974, Rayleigh, the Unit for Light Radiance, (in:) Applied Optics, v.13 i. 9, p.2160-2163.
- Berger U., Baumgarten G., 2018, On the Anthropogenic Impact on Long‐Term Evolution of Noctilucent Clouds, (in:) Geophysical Research Letters, vol. 45, issue. 13, p.6681-6689
- Bone N., 1999, Observing Meteors, Comets, Supernovae and other Transient Phenomena, Springer-Verlag, London
- Bone N., 2007, Aurora – observing and recording nature’s spectacular light show, Patrick Moore’s Practical Astronomy Series, Springer, New York
- Chamberlain J.W., 1995, The Rayleigh: A Photometric Unit for the Aurora and Airglow, (in:) Physics of the Aurora and Airglow, Volume 41, American Geophysical Union
- Craig R.A., 1965, The upper atmosphere. Meteorology and physics, Academic Press, New York, and London
- Dalin P., Et al., 2004, A case study of gravity waves in noctilucent cloud, (in:) Annales Geophysicae, vol. 22, p.1875-1884
- Davis T.N., Deehr C.S., Leinbach H., 1960, An evaluation of auroral all-sky cameras observation, (in:) geophysical Institute of Alaska, Scientific report no 5.
- Dietze G., 2016, Zones of the visibility of a noctilucent cloud, (in:) Tellus, v.21
- Dixon F.E., 1939, A 27.3‐day period in the aurora borealis, (in:) Terrestrial magnetism and atmospheric electricity, vol. 44 issue 3.
- Ebihara Y., et al., 2017, Possible Cause of Extremely Bright Aurora Witnessed in East Asia on 17 September 1770, (in:) Space Weather, vol. 15, i. 10, p. 1373 – 1382
- Espenak F., Meeus J., 2006, Five Millennium Canon of Solar Eclipses: -1999 to +3000 (2000 BCE to 3000 CE), NASA Tech. Pub. 2006-214141, NASA Goddard Space Flight Center, Greenbelt, Maryland
- Fesenkov V.G., 1961, The Conditions of Observation of the Zodiacal Light During a Solar Eclipse, Office of Aerospace Research, United States Air Force.
- Green J.L., et al., 2006, Eyewitness reports of the great auroral storm of 1859, (in:) Advances in Space Research v.38 p.145 – 154.
- Guliaev R.A., 1992, On a possible use of total solar eclipse below the horizon for observations of the inner zodiacal light (as applied to the eclipse of 30 June, 1992), (in:) Solar Physics, vol. 138, p.209-211
- Kimura H., Mann I., 1998, Brightness of the solar F-corona, (in:) Earth Planets Space, 50, p.493–499
- Klostermeyer J., 2002, Noctilucent clouds getting brighter, (in:)Journal of Geophysical Research, vol. 107, i. D14
- Kuliman M., et al., 2017, Exploring noctilucent cloud variability using the nudged and extended version of the Canadian Middle Atmosphere Model, (in:) , Journal of Atmospheric and Solar-Terrestrial Physics, vol. 164, p.276-288.
- Ludlam F.H., 1957, Noctilucent Clouds, (in:) Tellus, vol. 9
- Madhani J.P., et al., 2020, Observation of Eclipse Shadow Bands Using High Altitude Balloon and Ground-Based Photodiode Arrays, (in:) Journal of Atmospheric and Solar-Terrestrial Physics, vol. 211
- Meeus J., Grosjean C.C., Vanderleen W., 1966, Canon of Solar Eclipses, Pergamon Press, Oxford, United Kingdom
- Mieghem J.V., 1961, Physics of the aurora and airglow, Academic Press, New York & London
- Omholt A., 1971, The optical aurora, Springer-Verlag Berlin, Heidelberg, New York
- Proctor R.A., 1871, Notes on the Solar Corona and the Zodiacal Light; with suggestions respecting Observations to be made on the Total Solar Eclipse of December 24, 1870, (in:) Monthly Notices of the Royal Astronomical Society, vol. 30, p.138
- Rense A., Jackson J. M., Todd B., 1953, Measurements of the inner zodiacal light during the total solar eclipse of February 25, 1952, (in:) Journal of Geophysical Research, vol. 58, i. 3, p. 369-376
- Romick G.J., Belon A.E., 1967, The spatial variation of aurora luminosity, (in:) Planetary and Space Science 15(3).
- Russel M.J., et al., 2014, Analysis of northern midlatitude noctilucent cloud occurrences using satellite data and modeling, (in:) Journal of Geophysic Research Atmospheres, vol. 119, i. 6
- Sekhar A., Asher D., Vaubaillon J., 2016, Three-body resonance in meteoroid streams, (in:) Earth and Planetary Astrophysics
- Sharonow V.V., 1965, Climatology of Noctilucent Clouds According to Observations Performed During the Igy, Meteorologicheskye Issledovaniya, Moscow
- Shaw A.J., et al., 2009, Optical aurora detectors: using natural optics
to motivate education and outreach, (in:) Education and Training in Optics and Photonics 2009, St. Asaph, North Wales United Kingdom - Simmons D.A.R., 1998, A classification of auroral types (in:) Journal of the British Astronomical Association, vol.108, no.5, p.247-257
- Smiley C.H., 1938, The Zodiacal Light at a Total Solar Eclipse, (in:) Nature, 141, p. 121-122
- Thomas G.E., McPeters R., Jensen E.J., 1991, Satellite observations of polar mesospheric clouds by the solar backscattered ultraviolet spectral radiometer: Evidence of a solar cycle dependence, (in:) Journal of Geophysical Research Atmospheres, vol. 96, issue D1, p.927 – 939.
- Yahnin A.G., 1997, Magnetospheric source region of discrete auroras inferred from their relationship with isotropy boundaries of energetic particles, (in:) Ann. Geophys., 15, 943–958
- Van den Bergh G., 1955, Periodicity and Variation of Solar (and Lunar) Eclipses, Tjeenk Willink, and Haarlem, Netherland
- Vats H.O., Bagare S.P., Bhandari S.M., 2003, Formation and Observations of Shadow Bands During the Total Solar Eclipse of November 23, 2003 Near Maitri, Antarctic, (in:)
Advances in Geosciences, Volume 2 - Considine D.M., G.D, ., 2005, Van Nostrand’s Scientific Encyclopedia, John Wiley & Sons
- Fritts D.C., et al., 2014, Quantifying Kelvin‐Helmholtz instability dynamics observed in noctilucent clouds: 2. Modeling and interpretation of observations, (in:) Journal of Geophysic Research Atmospheres, vol. 119, i. 5, p. 9539 – 9375
Links:
- Statistics for Solar Eclipses of Saros 126
- Catalog of solar eclipse saros series (Saros 0 to 180)
- Variations in Gamma
- The Saros mechanism explanation
- Draconic month
- Anomalistic-month
- Different lunar months
- Moon’s orbit and synodic month
- Length of the synodic month 2001-2100
- 2026 total solar eclipse animation
- Saros Numbers of Solar Eclipses 1999 to 2024
- What is the eclipse season?
- Characterizing of the aurora
- https://www.albany.edu/faculty/rgk/atm101/aurora.htm
- Spaceweatherlive.com: real-time auroral activity
- https://auroraforecast.is/kp-index/
- Guide to the aurora
- Australian Government – characterizing the aurora
- https://cloudatlas.wmo.int/en/polar-aurora-brightness.html
- Radiometry & Photometry – all about the observed brightness of the celestial objects and phenomena
- https://www.ubergizmo.com/what-is/nit-lux-lumen/
- 100 digits of Pi
- https://sciencing.com/convert-nits-lux-7448702.html
- Radiometry & PhotoMetry
- What is the solar cycle?
- Magnetic North, Geomagnetic and Magnetic Poles
- KP-Index explained
- https://www.csmonitor.com/Science/2015/1223/Why-does-an-aurora-have-bursts-of-brightness
- How to see the aurora
- How to observe the aurora
- https://explore.quarkexpeditions.com/blog/the-celestial-wonders-of-the-northern-lights
- http://stevenmileyphotography.com/blog/tag/fort+greely
- Does a full moon ruin your chances of seeing the Aurora Borealis?
- Bright moon and aurora borealis
- Nautical twilight aurora
- https://nineplanets.org/questions/how-long-does-it-take-to-get-dark-after-sunset/
- Out of this world! Astronomy Photographer of the Yeary-photographer-of-the-year/image-gallery/49b17e6164c77b1c6fd152069da189e5?galleryimage=3
- Strange clouds at the edge of space
- Strange clouds
- About NLCs, Polar Mesospheric Clouds
- Mesosphere
- https://www.sciencedirect.com/topics/earth-and-planetary-sciences/noctilucent-clouds
- https://spaceweatherarchive.com/2019/06/19/mysterious-moisture-in-the-mesosphere/
- Gravity waves
- https://projectpossum.org/research/noctilucent-cloud/about-noctilucent-clouds/
- Rare night clouds may be warning sign of climate crisisg-sign-of-climate-crisis#:~:text=The%20scant%20water%20vapour%20there,sign%20of%20the%20climate%20crisis.
- https://www.britannica.com/science/noctilucent-cloud
- http://ed-co.net/nlcnet/
- https://www.nasa.gov/audience/forstudents/9-12/features/clouds_feature.html
- FREAKY NOCTILUCENT CLOUDS BREAK OUT ALL OVER
- The types of noctilucent clouds
- Noctilucent clouds – classification
- Nightskyhunter.com: NLC – a practical guide
- International cloud atlas – NLC brightness scale
- Sound ’cause of shadow spectacle’
- Shadow bands during a total solar eclipse
- https://www.swiatobrazu.pl/calkowite-zacmienie-slonca-w-ameryce-poludniowej-38245.html (Polish)
- https://beyondrange.wordpress.com/2018/07/21/the-pyrenees-seen-from-mallorca-324-km/
- Perseid Bolide image
- Rare cosmic balancing act makes Perseid meteor showers brighter
- Perseid meteor shower
- https://solarsystem.nasa.gov/asteroids-comets-and-meteors/meteors-and-meteorites/perseids/in-depth/
- https://fireballs.ndc.nasa.gov/
- https://earthsky.org/astronomy-essentials/everything-you-need-to-know-delta-aquarid-meteor-shower
- https://earthsky.org/astronomy-essentials/everything-you-need-to-know-perseid-meteor-shower
- Atmospheric optics: zodiacal light
- Earthsky.org: Zodiacal light – All you need to know
- https://www.britannica.com/science/zodiacal-light
- https://www.skybrary.eu/index.php/Zodiacal_light
- https://www.daviddarling.info/encyclopedia/Z/zodiacal_cloud.html
- https://skyandtelescope.org/observing/have-you-seen-the-zodiacal-light/
- https://darkskydiary.wordpress.com/2012/03/26/zodiacal-light/
- https://skyandtelescope.org/observing/see-shoot-zodiacal-light02042105/
- https://www.sciencedirect.com/topics/physics-and-astronomy/zodiacal-light
- Multiple green and blue flashes
- Green flash
- Green rim
- The colors of green flashes
- Inferior mirage
- Inferior mirage explanation
- Vanishing line
- Inferior mirage and green flash
- Mock mirage
- https://www.wral.com/looking-back-the-rare-hybrid-solar-eclipse-of-nov-3-2013/19369127/?fbclid=IwAR2SUgVV1dTus3AemySV6tPof9CrOv573ST4_6_YVDkYXcADeb1s0n5RTCY
Forums:
- https://physics.stackexchange.com/questions/25791/how-bright-are-auroras-aurorae
- https://hub.displaycal.net/forums/topic/convert-lux-measurement-to-nits/
- https://worldbuilding.stackexchange.com/questions/134487/scientific-explanation-for-a-exceptionally-bright-night-sky
Wiki:
- Angstrom
- Apsis
- Apsidal_precession
- Earth_radius
- Descending Moon’s Node
- Gamma_(eclipse)
- Gravity wave
- Greenland_ice_sheet
- Green_flash
- Looming_and_similar_refraction_phenomena
- Lunar_month
- Lunar_node
- Mesopause
- Mesosphere
- Mirage
- Perseids
- Rayleigh_(unit)
- Rossby_wave
- Saros_(astronomy)
- Solar_cycle
- Solar_cycle_25
- Surface_brightness
- Zodiacal_light
Youtube:
