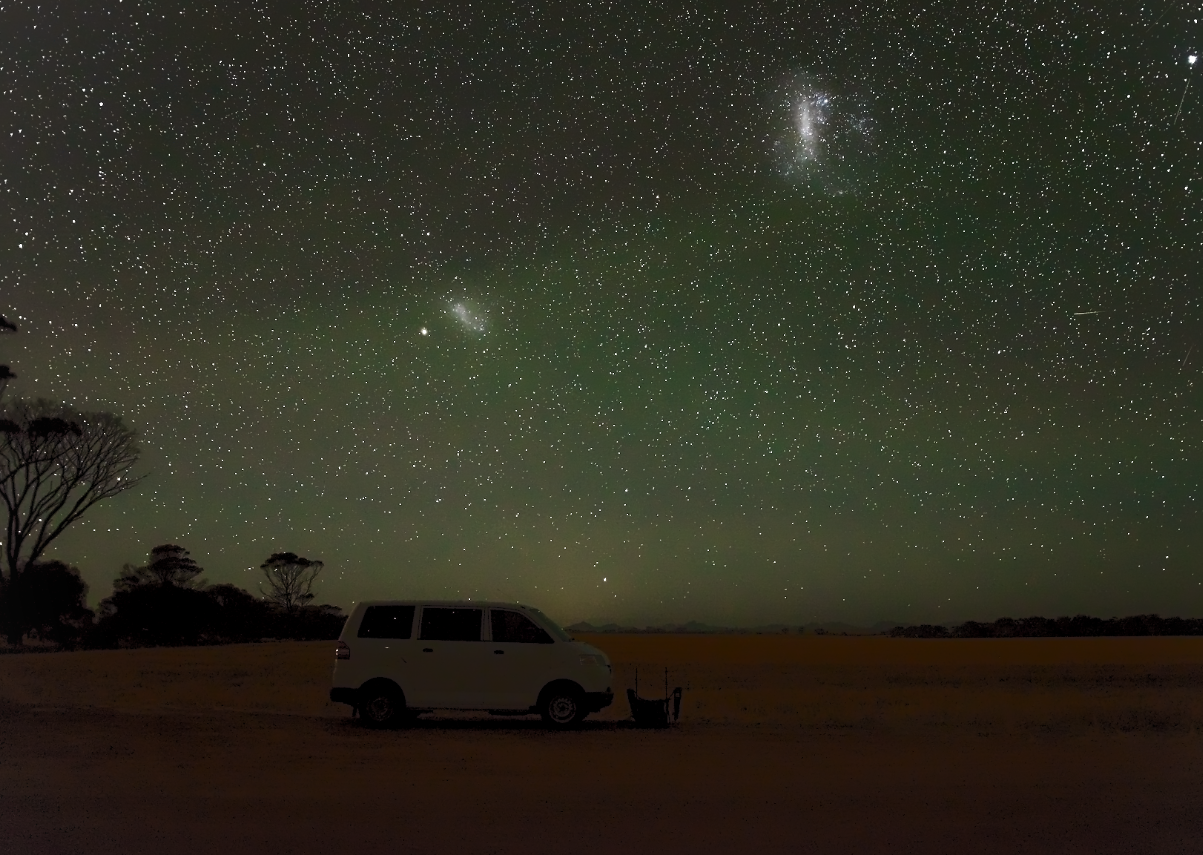
A vast majority of people around the World don’t realize something like starlight. Nowadays, when skies are highly polluted with light, most people cannot even see the Milky Way in the sky. It’s known history, that during a huge power cut in Los Angeles in 1994 people were calling authorities, asking them what is this huge, elongated, and fuzzy line across the sky? It was found, that some people have never seen a Milky Way in the sky at all!
Light pollution and its displacement around the World is a completely different issue, which possibly I will develop in the future. Now I would like to answer the question: Do the stars shine during the night? And if so, how bright the starlight is? An answer to these questions should convince you enough to further contribute to the protection of night skies for present or future generations.
We deem starlight as visible electromagnetic radiation from stars, other than the Sun. A naked eye can see up to 7k stars during the night under perfect conditions. For scientific purposes, starlight is measured through telescopes. However, for us important is to watch it with the naked eye. The first reported observation such as this was done by Hipparchus, who made the first estimation of starlight level. He also sorted stars into six bright categories, called further as magnitudes (Mag).
Over the centuries a lot of people have been watching the sky. Some of them were for scientific purposes, like Galileo Galilei, and another, who treated it simply like a hobby. This second group of people – amateur astronomers do not use the field of astronomy as their primary source of income or support. They don’t have a professional degree in astronomy or astrophysics, so their observations are based on physical and aesthetic feelings. In recent times, next to amateur astronomy, the field of astrophotography has developed quickly, enabling these observers to perpetuate their views.
Most of these photographs, especially nowadays are being processed in the proper software, which results in huge enhancements of the night-sky view. This is nothing wrong, but my aim of this study is to show what is the role of starlight in the human eye’s perspective before it is captured. That’s why I decided to check it on my own, during my honeymoon journey in Australia, about which more will be below.
Starlight is one of the main factors, which influence general night sky brightness. Sky brightness refers to the visual perception of the sky and how it scatters and diffuses the light. Being in areas completely free of light pollution, we can easily see, that even during moonless nights the sky is not completely dark. Is very important to exclude any scattered sunlight, which plays a role obviously during twilight (we are considering only astronomical twilight now) and also outside of it. It is vital to remember, that scattered sunlight can be displayed also as a zodiacal light, which is caused by sunlight, scattered by interplanetary dust. The zodiacal light is to be seen beyond the astronomical twilight when the Sun’s position is higher than about 22-24 degrees below the horizon (I will study it roughly in the future). Next, it appears as a very faint fuzzy line across the sky and continues until an antisolar point, where we can spot a faintly bright spot on the sky, called gegenschein. Gegenschein also scatters sunlight on interplanetary dust, but this is the topic for further studies and observations.
Taking into consideration, that we are under a moonless sky, outside the twilight period, we can highlight three major relative contributors to the night sky’s surface brightness. They are airglow, zodiacal light, and starlight.
Zodiacal light can dissipate sunlight strongly, but basically, it tends to faint as the Sun plunges deeper beneath the horizon. It was taken, that zodiacal light constitutes about 25-30% of night sky surface brightness, which is quite a lot. Especially, when the Sun is higher than 30deg below the horizon, the zodiacal light can significantly impair the starlight, because its sky surface brightness in the brightest area (at the solar azimuth) reaches less than 20mag/arcsec2, whereas the integrated Milky Way starlight has about 24mag/arcsec2.
A much bigger contribution to the night sky’s brightness comes from the airglow, which is a faint emission of light from the upper atmosphere. Airglow is caused by various processes:
– photoionization and recombination of atoms during the day,
– cosmic rays striking the upper atmosphere,
– chemiluminescence is caused mainly by oxygen and nitrogen reacting with hydroxyl, a few hundred kilometers above the ground.
Usually during the night airglow is bright enough to be noticed by the ground observer as a grey or bluish veil across the sky. It appears brightest at about 10deg altitude above the horizon. The airglow adds up nearly 60-70% illumination into night sky surface brightness, causing the night sky to be never completely dark, even after the effect of starlight and zodiacal light are removed. Airglow usually is brighter, than starlight (but not always must be like this), reaching +23,5mag/arcsec2.
The last contributor to night sky brightness, which I would like to focus my attention is scattered starlight, constituting about 5-10% of total sky surface brightness. There is no brainer, that most of this light comes from the Milky Way area, where starlight has an integrated form. Considering the Milky Way, we must know, that it is brighter in the southern sky.
Other things that contribute to overall night sky surface brightness are air humidity and transparency, seasonal variations, and also solar activity. It was found, that between a minimum and maximum solar cycle, an overall night sky surface brightness difference is about 0.5 – 0.7 Mag/Arcsec2 (Patat, 2002). Seasonal variations of the night sky brightness are inferred mainly by changes in the position of the zodiacal light. These changes can reach up to 0.5 Mag/Arcsec2 (Patat, 2008).
Being in Australia, I made three amateur observations where my places were at least 100 km from the closest large metropolitan regions in the byline (Pic. 1). Because Australia is a sparsely populated nation, light pollution, unlike extremely populated Europe or India, does not influence the sky across big regions. Single exceptions are small towns, located about 50-60km from each other, where some artificial light is emitted overnight, although it doesn’t impact on the night sky quality. This situation makes perfect stargazing conditions throughout the country, except for the largest urban areas with up to 100 km of surroundings.

My first impression of the complete night sky leads me to the conclusion about the minimum distance required from highly polluted areas to the place, where the sky is in general not affected by artificial light. Firstly I thought, that in order to reach a perfectly dark sky region, we must go at least 250km away from the closest urban area, in order to avoid any artificial lightning, scattered and reflected i.e. by high-level clouds.
Theoretically, I was right, regarding especially the region with different topography. It has been presented on models, predicting the night sky brightness caused by the distant big city, that even at considerable distances, some parts of the night sky can be still affected by artificial illumination (Garstang 1989). The issue is very important when the observation place is elevated (i.e. somewhere at the summit)(Pic. 2), because due to the horizon dip, the distance between the big city and the observer under a clear sky should be much bigger.

My observation place wasn’t placed on the elevated area. I was watching the stars in Western Australia’s lowlands, so this pattern can look a bit different, like below (Pic. 3), although it still has some important similarities to the previous one above. It is expressed especially by cloud altitude.

As I said before, high-level cloudiness can reflect light for long distances. Once the plane is at its cruising altitude, we can theoretically see the objects from a 374km distance, the same principle works for cumulonimbus or cirrus clouds, hung at a similar altitude above ground. When we are at least 250km from the highly polluted area, we would still have a bit of a polluted sky. These high-level clouds are for sure not always just above the city. Often they are passing by the urban area, reflecting its light from some distance (Pic. 2), which extends the pollution additionally. So even my initial thoughts above the minimum distance for the clear sky were wrong when taking into account these all theoretical assumptions.
However, practically a situation has a different character. We should take into account also atmosphere molecules, that cause extinction. Due to extinction, there is no possibility to see an illuminated cumulonimbus cloud from a 374km distance, even under transparent air. The atmospheric extinction is often enhanced by haze presence in the air and humidity. These 2 things are perfect for the reduction of light waves over long distances. For sure, if the weather is misty, even under clear skies our view can be impaired likewise in terrestrial long-distance views. On top of that, a thick haze can lift up the sky surface brightness up to 0.25 Mag (Benn, Ellison, 1998). I am considering a typical situation, where humidity is around 50-60% and some dust aerosols are hung in the air. That situation occurred during my stay in Australia, bringing to me new conclusions about the minimum safe distance for perfect stargazing. Once we take these facts above into consideration, then we can surely plan our stargazing observation just about 100km from the nearest polluted area, although is better when this distance is longer.

In general, the single star luminosity is determined by 2 major factors: surface temperature and apparent size. The star’s luminosity is described by the absolute magnitude, which is the luminosity of this star, as seen from a 10pc distance. For us, observers much more important is the apparent magnitude of the star. The apparent magnitude is the relative brightness of the star, as can be seen by an observer from Earth. The magnitude scale is an inverse logarithmic relationship, where a difference of 1.0 corresponds to a brightness shift of about 2,512x. When an object is brighter, then its value on the Magnitude scale is lower. The faintest stars, which can be seen by the naked eye under extremely clear conditions have about +6,5Mag. This scale comes from Hellenistic Greece (Hipparchus) when stars were divided between the 1st and 6th scales. The brightest stars were marked by 1st degree and the faintest, at the maximum visual range of the human eye, by 6th degree. Hipparchus used to watch the sky from Rhodes around 150 BC and finally prepared the catalog of about 1000 stars. Next, Ptolemy prepared a manuscript, which he extended the star catalog, including information about their brightness (Pic. 4).

The Ptolemy created the oldest catalog of stars, which eventually didn’t cover far southern skies. These parts of the sky have been covered in the late XVI and XVII successively by Peter Plancius, Jodocus Hondius, Willem Janszoon Blaeu, Keyzer, Holtmann, and Edmund Halley. The XVII century was also a period of early magnitude estimates through the telescope, invented by Hans Lippershey and next applied by Galileo Galilei. A serious attempt to make the Magnitude scale more precise was in the XIX century when astronomers determined exactly how different the apparent brightness of a 6th magnitude star is from that of a 1st magnitude star. Measures showed, that from a 1st magnitude star, we obtain about 100 times more light, than from a 6th magnitude star. Based on this measurement, astronomers described and precised a magnitude scheme then, making a 5-magnitude distinction corresponding precisely to a 100:1 brightness ratio. The magnitudes of stars have been also decimalized in order to make the brightness assumption more convenient. When two stars differ by 1 Mag from each other, then their brightness has about 2.5x difference. I mentioned it above, although here I would like to point out a few a rule of thumb regarding the simple star brightness calculation. When the difference is about 0.75 Mag, then it counts as 2x; 3 Mag – about 10x; 4 Mag about 40x. Everything corresponds to the logarithmic scale.
When we gather 7 thousand stars together in the sky, which can be seen under a free light pollution area, near the human eye adaptation threshold. This huge amount of stars must result in a visual light, which comes from them. Light is emitted by every single star visible in the sky (considering naked-eye conditions only) as well as galaxies and nebulae This is not only the point light, as we have seen in the sky. This is also a faint scattered light, which comes through the atmosphere to the observer! This is exactly a starlight, understood as a sum of light from all stars, which hits Earth’s atmosphere and the ground eventually. This sum of light is not placed equally across the sky, because of the Milky Way, which emits most of the starlight. We know, that watching the Milky Way we are looking alongside the Galaxian disk, hence we see many more stars, that build up our galaxy’s appearance. The brightest part of the Milky Way is in Saggitarius and Crux.


Apart from that, the light comes from the brightest stars such as Sirius, Canopus, or Vega. Because of the omnipresent airglow and not rarely the zodiacal light too, is hard to distinguish a particular direction, from where starlight comes. For this purpose, professionalists use the sky quality meter, which enables them to see the brightness of particular parts of the sky. Everyone can purchase it even in a pocket version, making it an easy way to quantify the quality of the night sky and main starlight directions. I didn’t try it so far, although will do it for sure in the future. I have chosen another way to figure out where mainly starlight comes from. Today it can be also gauged by photo cameras when using a long time exposure. The long exposure makes the landscape appear highly beyond the ability of human vision, therefore the main starlight direction is easier to spot.
Compared to other light sources as we know on Earth (sunlight, moonlight), starlight is very very faint. In spite of it, starlight is still stronger, than light reflected by every single planet seen in the sky. Venus, the brightest planet in the sky has a brightness 0.00014Lx (0.14Nx), whereas starlight only, without airglow usually counts 0.0002Lx (0.2Nx). When we add up a typical airglow illumination, then a total illuminance of night, the moonless sky will reach 0.002Lx (2Nx), which is around 10x brighter, than starlight itself. As a comparison, the illumination of the brightest star – Sirius is 0.00005Lx (0.05Nx).
Before I plunge into my observation in Australia I would like to mention also one thing, which can be deemed as an important argument. I wrote above, that a human’s eye can see about 7k stars. Now we must think, what is between them? There are weaker stars, which cannot be detected by the naked eye. The sky “between” the visible stars looks dark then. The “Dark night sky paradox” says, that this darkness conflicts with the premise of a static, infinite Universe. The eternal Universe is static, which means that is filled by an infinite number of stars placed in this boundless area. It leads to the conclusion, that whole this immensity is rather bright than dark. However between these stars can be some objects, like interplanetary dust, which absorbs the light. The darkness of the sky is much better visible after image processing. Before that, in the long exposure picture, the sky looks grey.
In order to detect starlight, I made three observations, in which the common denominator was a white surface.
I used for this purpose a white campervan and cloud outlines, which were looking brighter, than their bases.


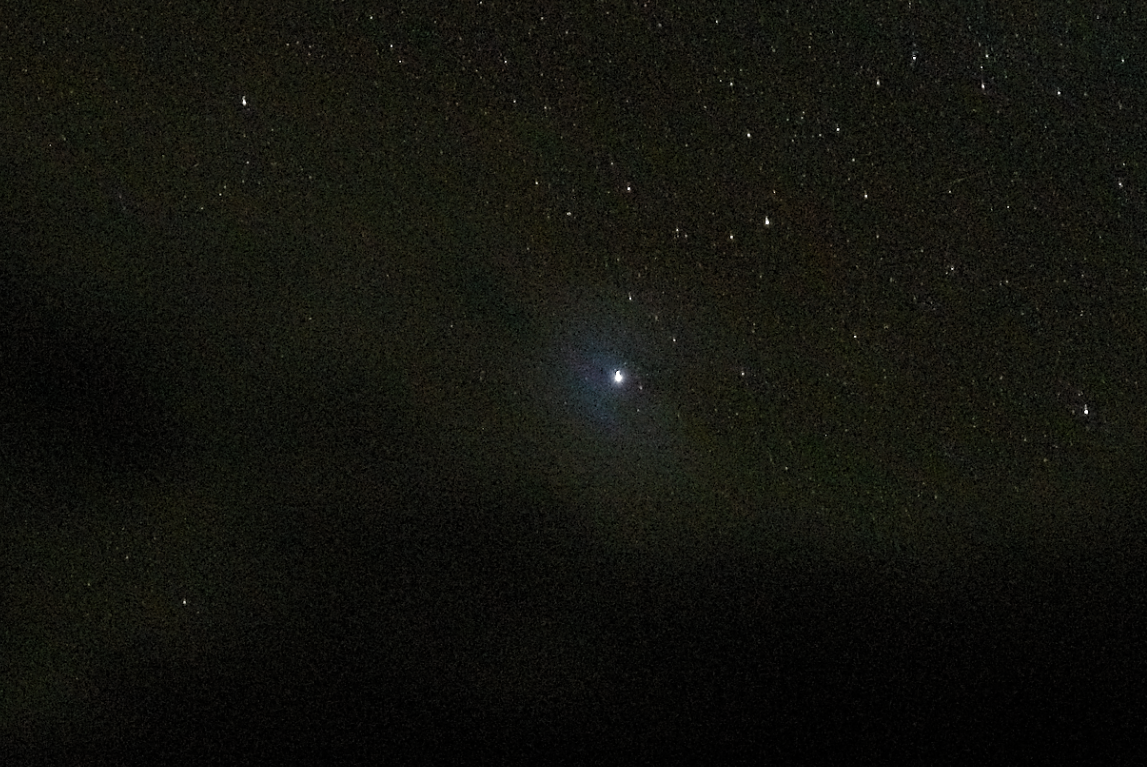

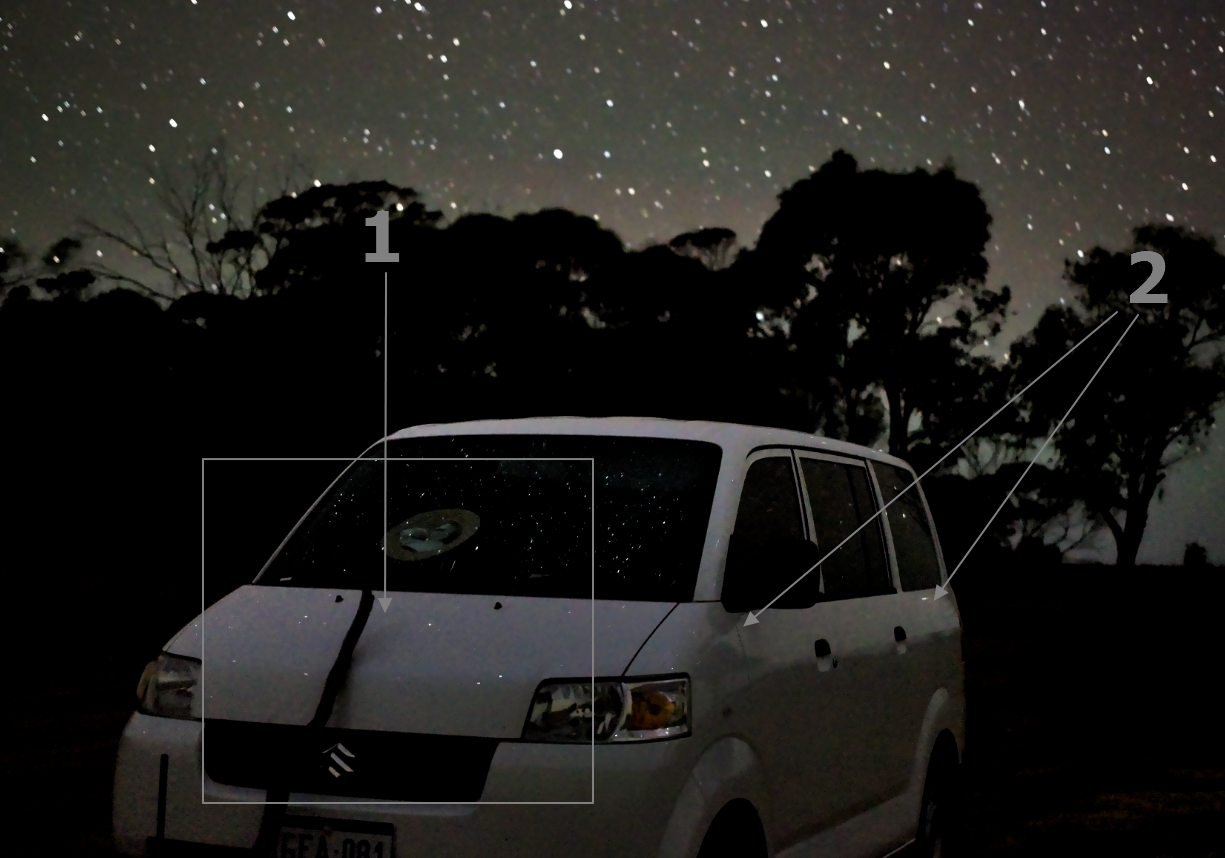
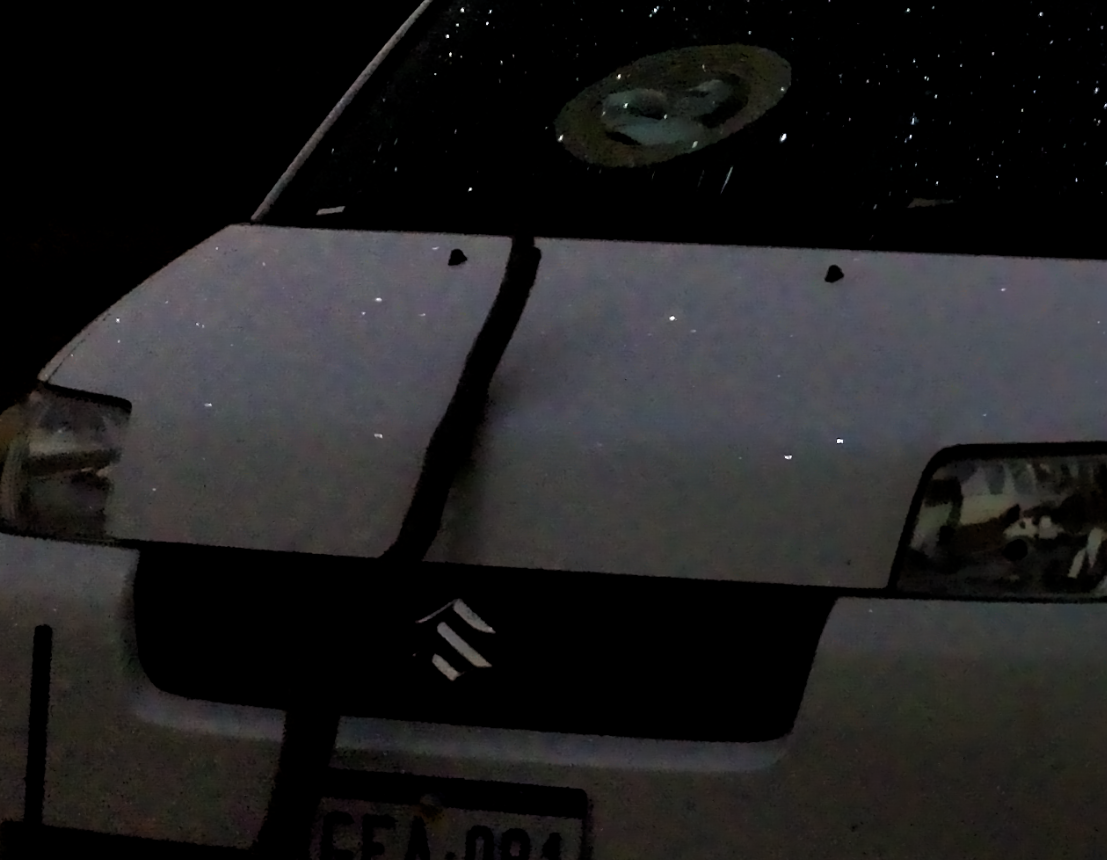
On the campervan front, I placed a wooden twig in order to see how it cast a shadow from the sky. The result was amazing! I saw something like a shadow rosette coming from this twig. A major shadow and at least a few other, weaker ones were seen at the same moment.



Besides I took other pictures of stars and the Milky Way, although with a relatively short exposure time. I don’t have a Star Adventurer tool so far, so I must manage with a tripod and camera only. However, I could still get so nice-looking pictures up to about 20-30s exposure. The details of the star photography with camera and tripod only have been presented in this article.


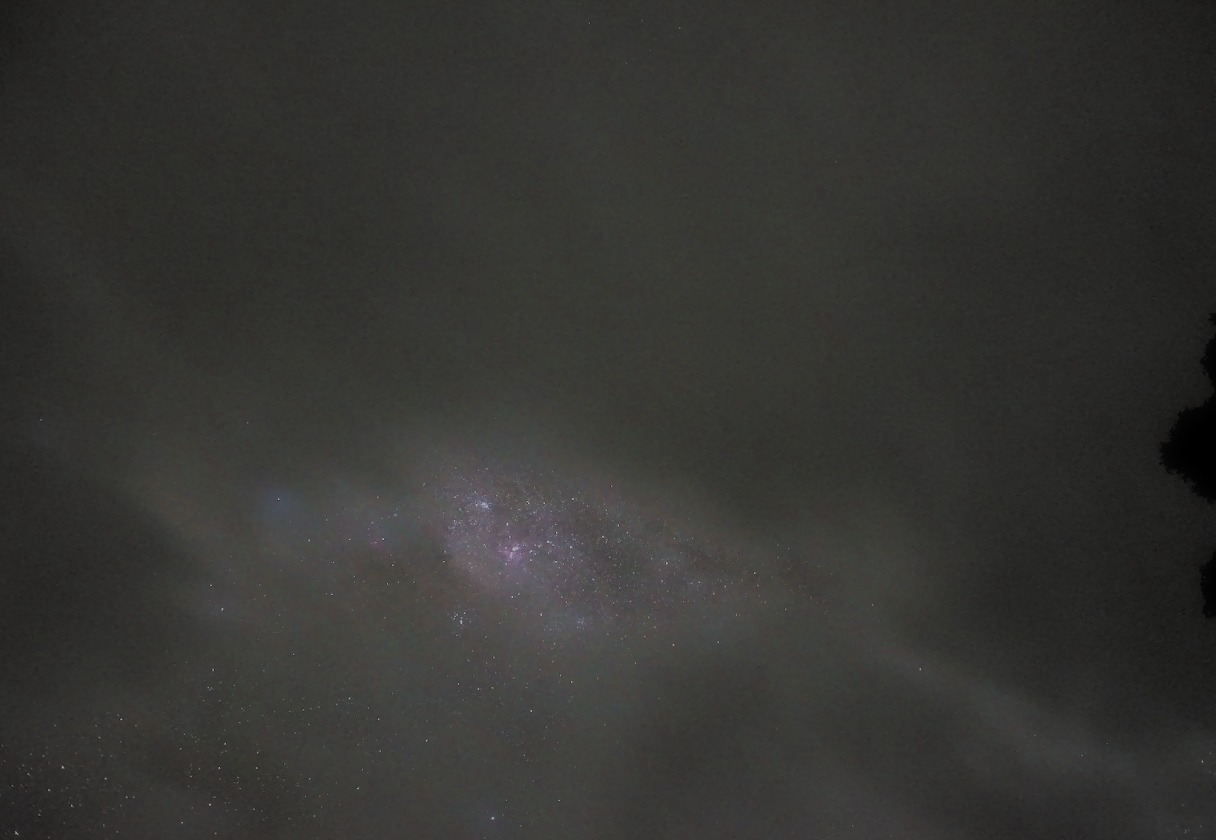
All pictures have been taken with an 18-35mm frame, 20-30s exposure f/1.8, and ISO between 10000 and 25600. Next, I used the Darktable software for further processing, where various profiles have been applied.
Having an opportunity to see starlight with our own eyes we should prevent all (yet existing) ark sky areas worldwide. We can do it by cutting down the light pollution increment. People living under a highly light-polluted sky are completely not aware of its real beauty. If we don’t prevent a clear night sky for our descendants, then they even won’t know what the Milky Way looks like.
Mariusz Krukar
References:
- Benn C.R., Ellison S.L., 1998, Brightness of the night sky over La Palma, (in:) New Astronomy Reviews, vol. 42, i.6-8, p.503-507
- Cinzano P., 2005, Night sky photometry with sky quality meter, (in:) ISTIL International Report n.9, v.1,4
- Garstang R.H., 1989, Night sky brightness at observatories and sites, (in:) Astronomical Society of the Pacific, i.101, p.306-329
- Hearnshaw J.N., 1990, The analysis of starlight. One hundred and fifty years of astronomical spectroscopy, Cambridge University Press, Cambridge
- Hearnshaw J.B., 1996, The measurement of starlight. Two centuries of astronomical photometry, University of Canterbury, Christchurch NZ
- OpenStax College, 2016, Astronomy, Rice University, Houston
- Patat F., 2002, UBV RI Night sky brightness during sunspot maximum at ESO Paranal, (in:) Astronomy Astrophysics, i. 400, p.1183-1198
- Patat F., 2008, The Dancing Sky: 6 years of night sky observations at Cerro Paranal, (in:) Astronomy, Astrophysics
- Robinson K., 2009, Starlight – an introduction to stellar physics for amateurs, Springer, London
Links:
- https://www.darksky.org/ – An international Dark-Sky Association
- Eso.org: How bright is the night sky
- Night Sky brightness at Cerro Pahon
- Stellar magnitudes
- Luminosity of stars
- Nytimes.com: the flip side of optimism about life on other planets
- Radiometry and photometry in astronomy – all about starlight
- All practical stuff about night photography
- https://www.lightpollutionmap.info
Forums:
Wiki:
- Apparent magnitude
- Gegenschein
- Luminosity
- Minute_and_second_of_arc
- Olber’s paradox
- Starlight
- Zodiacal_light
Read also:
- Krukar M., 2019, How bright is the starlight?, (in:) Capella – Cambridge Astronomical Association, Newsletter 196.
