Folium Draw plugin – extended functionality

Folium draw plugin

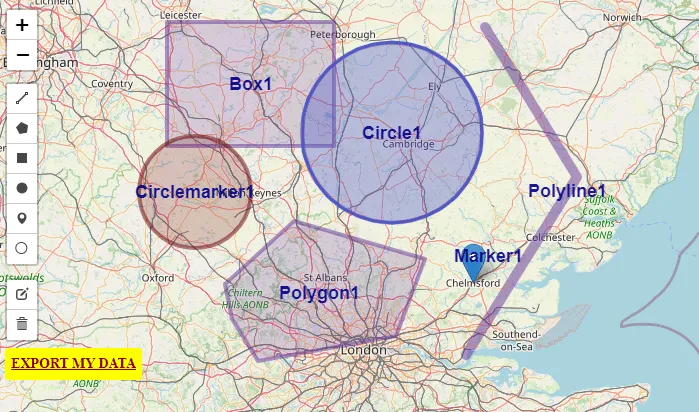
The Draw is a very nice plugin dedicated to anyone who wishes to draw editable vectors on the Folium map. It’s a comprehensive plugin, that can add lines, polylines, polygons, rectangles, circles, circlemarkers, and markers and then edit or delete them. Its functionality is the same as in the Leaflet Draw plugin, where its Folium … Read more

Quick access to Street View from various applications (based on Leaflet map example)

Street View access from various maps

Everyone knows how Google Street View is needed for the desktop investigation of various issues. It’s very beneficial since we have access to this Google product from another platform, certainly dedicated to some topic. Indeed, there are quite a few ways of getting the Street View visible at the same time when browsing the specified … Read more

Opening Street View with Python Folium map

Street View with Python folium map

Folium is a powerful Python library dedicated to geospatial data visualization. Its major engine is based on Leaflet – an open-source JavaScript library for mobile-friendly interactive maps. There are a lot of sources on the web, where anyone can find the basics of data displaying with Python Folium in several different ways. Most of them … Read more

Saving Openlayers custom drawings as the .geoJSON file

OpenLayers custom drawings

In this short post, I would like to demonstrate to you the programmatic method of saving the custom shapes in OpenLayers as the .geoJSON file. Drawing your own features on the OpenLayers map canvas equipped with some existing layers, like it takes place in the case of the map rendered by the QGIS2Web plugin can … Read more

QGIS2web legend & scale and other elements in OpenLayers map library

QGIS legend and scale edits

Legend and scale besides the pop-up window and labeling is another important map element, which everyone wants to have clean and tidy. In this shorter (I hope) article I want to explain to you how to customize the legend for your OpenLayers map generated by the QGIS2web plugin and add some relevant elements like a … Read more

Excel Spreadsheet batch data geocoding for GeoJSON and JSON files

GeoJSON output in Leaflet

Recently I was dealing with geotagging single addresses in Google Maps and other easily accessible tools. However, the stuff, that I focused on is playing around with single placemarks only. I believe, that this operation is much more useful when we take into account not only the address but other details, related to this place. … Read more

How to show the coordinate grids in Google Earth and Google Maps?

Google Maps MGRS

There are a few ways to show the coordinate grids on Google Earth. The easiest way to show the coordinate grids in Google Earth is to select “Grids” from the “Tools” options. Then you will have full zoomable coordinates grid cover (Pic 1 – 3). The default coordinate system bound to Google Earth is the … Read more