
The Draw is a very nice plugin dedicated to anyone who wishes to draw editable vectors on the Folium map. It’s a comprehensive plugin, that can add lines, polylines, polygons, rectangles, circles, circlemarkers, and markers and then edit or delete them. Its functionality is the same as in the Leaflet Draw plugin, where its Folium counterpart originated from. The functionality of this plugin can be expanded by developing the javascript code inside the macro template.
At the initial stage, the plugin looks as presented in the code below:
import folium
from folium.plugins import Draw

m = folium.Map(location=[51.86762,0.8624],
tiles='OpenStreetMap',
zoom_start=8,
min_zoom=7,
max_zoom=19,
control_scale=True
)

draw = Draw(export=True)
draw.add_to(m)

m.save(outfile='Test map.html')
which allows us to draw various elements and export them to the .geojson format. The standard Python-coded drawing plugin looks as below (Pic. 1).
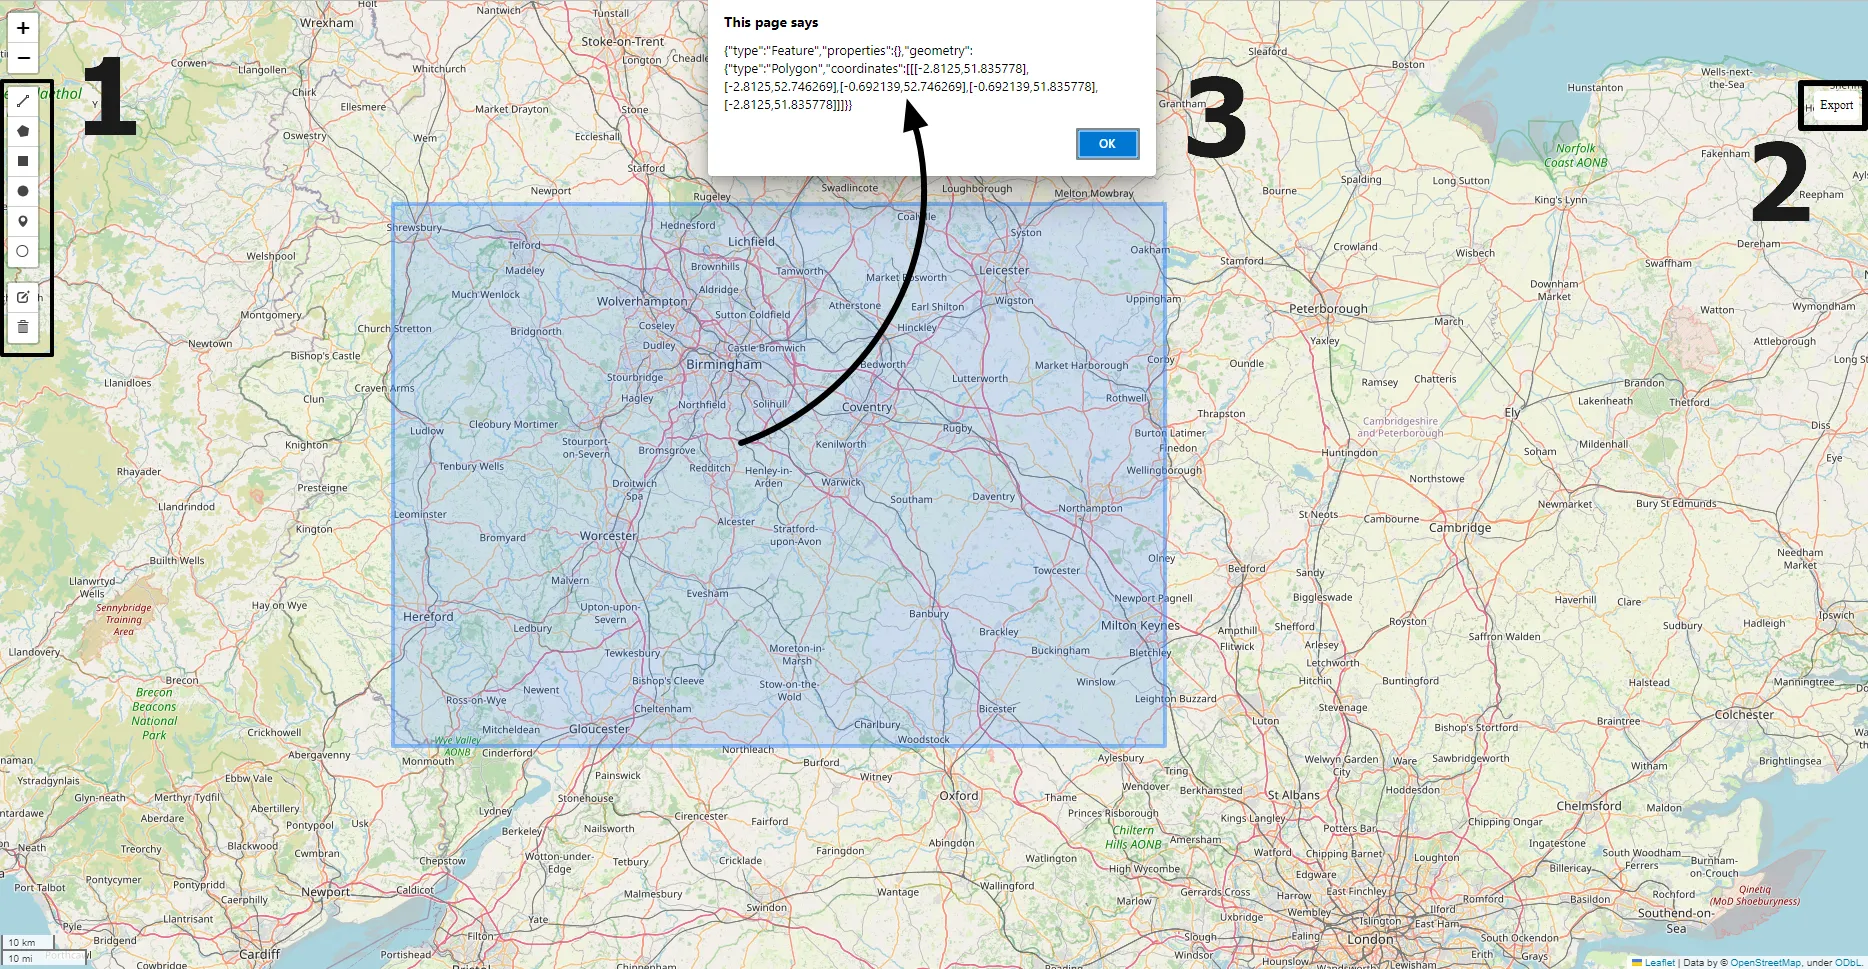
The standard Folium version is not advanced. The primary downside of this plugin is the lack of an option to define the name of exported files the same as no possibility or applying some custom .geojson properties to our work.
The next developments require using additional libraries and their elements. I mean especially the branca.elements and jinja2 macro template.
import folium
from folium.plugins import Draw
from folium.elements import JSCSSMixin
import jinja2
from jinja2 import Template
import branca
from branca.element import Element, Figure, MacroElement
Next, we can provide the standard Folium Draw macro example available on Github page and make it usable on our map. We can modify it slightly by removing for example the description at the very top and leaving just relevant links.
class Draw(JSCSSMixin, MacroElement):
"""
https://leafletjs.com/reference.html#control
http://leaflet.github.io/Leaflet.draw/docs/leaflet-draw-latest.html#drawoptions
https://leaflet.github.io/Leaflet.draw/docs/leaflet-draw-latest.html
"""

_template = Template(
"""
{% macro script(this, kwargs) %}
var options = {
position: {{ this.position|tojson }},
draw: {{ this.draw_options|tojson }},
edit: {{ this.edit_options|tojson }},
}
// FeatureGroup is to store editable layers.
var drawnItems = new L.featureGroup().addTo(
{{ this._parent.get_name() }}
);
options.edit.featureGroup = drawnItems;
var {{ this.get_name() }} = new L.Control.Draw(
options
).addTo( {{this._parent.get_name()}} );
{{ this._parent.get_name() }}.on(L.Draw.Event.CREATED, function(e) {
var layer = e.layer,
type = e.layerType;
var coords = JSON.stringify(layer.toGeoJSON());
{%- if this.show_geometry_on_click %}
layer.on('click', function() {
alert(coords);
console.log(coords);
});
{%- endif %}
drawnItems.addLayer(layer);
});
{{ this._parent.get_name() }}.on('draw:created', function(e) {
drawnItems.addLayer(e.layer);
});
{% if this.export %}
document.getElementById('export').onclick = function(e) {
var data = drawnItems.toGeoJSON();
var convertedData = 'text/json;charset=utf-8,'
+ encodeURIComponent(JSON.stringify(data));
document.getElementById('export').setAttribute(
'href', 'data:' + convertedData
);
document.getElementById('export').setAttribute(
'download', {{ this.filename|tojson }}
);
}
{% endif %}
{% endmacro %}
"""
)

default_js = [
(
"leaflet_draw_js",
"https://cdnjs.cloudflare.com/ajax/libs/leaflet.draw/1.0.2/leaflet.draw.js",
)
]
default_css = [
(
"leaflet_draw_css",
"https://cdnjs.cloudflare.com/ajax/libs/leaflet.draw/1.0.2/leaflet.draw.css",
)
]

def __init__(
self,
export=False,
filename="data.geojson",
position="topleft",
show_geometry_on_click=True,
draw_options=None,
edit_options=None,
):
super().__init__()
self._name = "DrawControl"
self.export = export
self.filename = filename
self.position = position
self.show_geometry_on_click = show_geometry_on_click
self.draw_options = draw_options or {}
self.edit_options = edit_options or {}

def render(self, **kwargs):
super().render(**kwargs)

figure = self.get_root()
assert isinstance(
figure, Figure
), "You cannot render this Element if it is not in a Figure."

export_style = """
<style>
#export {
position: absolute;
top: 5px;
right: 10px;
z-index: 999;
background: white;
color: black;
padding: 6px;
border-radius: 4px;
font-family: 'Helvetica Neue';
cursor: pointer;
font-size: 12px;
text-decoration: none;
top: 90px;
}
</style>
"""
export_button = """<a href='#' id='export'>Export</a>"""
if self.export:
figure.header.add_child(Element(export_style), name="export")
figure.html.add_child(Element(export_button), name="export_button")

draw = Draw(export=True)
draw.add_to(m)
Now, the plugin appearance and functionality on the map will the exactly the same as presented above (Pic. 1), but at least we have options for modifying them. As the first step, we can declare the export as True:
def __init__(
self,
export=True,
filename="data.geojson",
position="topleft",
show_geometry_on_click=True,
draw_options=None,
edit_options=None,
):
and remove the keyword argument from the initialization:
draw = Draw()
draw.add_to(m)
but it’s rather a minor thing.
Secondly, let’s define the custom name for the saved file. In this case, our work should play within the JavaScript code included in the macro. The proper section for saving the file can be found here:
{% if this.export %}
document.getElementById('export').onclick = function(e) {
var data = drawnItems.toGeoJSON();
var convertedData = 'text/json;charset=utf-8,'
+ encodeURIComponent(JSON.stringify(data));
document.getElementById('export').setAttribute(
'href', 'data:' + convertedData
);
document.getElementById('export').setAttribute(
'download', {{ this.filename|tojson }}
);
}
{% endif %}
where we must know, that document.getElementById(‘export’) method picks up the button id defined later in the code:
export_button = """<a href='#' id='export'>Export</a>"""
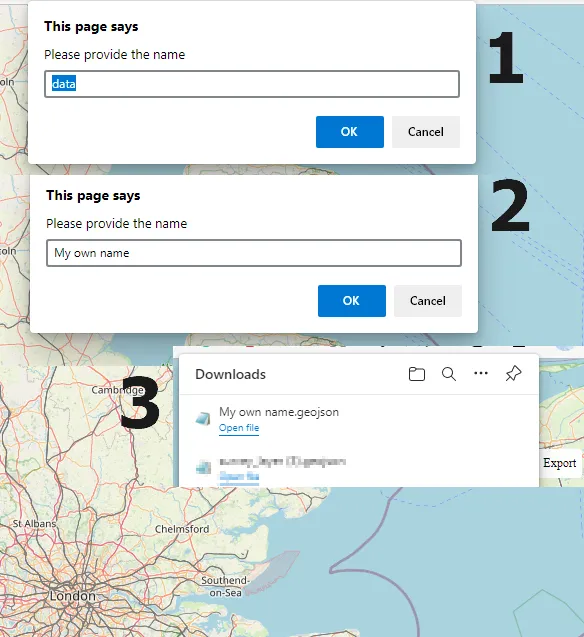
where the export button is defined. Our role is to provide the feature, which will allow us to provide the file name which we want. The imposed file name in the standard approach can be used as an optional one. The code could look like this:
{% if this.export %}
document.getElementById('export').onclick = function(e) {
var data = drawnItems.toGeoJSON();
var filetitle = prompt("Please provide the name", "data");
var convertedData = 'text/json;charset=utf-8,'
+ encodeURIComponent(JSON.stringify(data));
document.getElementById('export').setAttribute(
'href', 'data:' + convertedData
);
document.getElementById('export').setAttribute(
'download', filetitle+'.geojson', 'text/plain'
);
}
{% endif %}
where we will declare a new variable including the prompt() method. This function will always run a dialog box asking the user about the custom name leaving the data as an alternative option not generic.
Moreover, the export is not based on the initialized filename anymore, as our custom option has been provided. Therefore the following lines can be switched off or deleted completely.
def __init__(
self,
export=True,
#filename="data.geojson",
position="topleft",
show_geometry_on_click=True,
draw_options=None,
edit_options=None,
):
super().__init__()
self._name = "DrawControl"
self.export = export
#self.filename = filename
self.position = position
self.show_geometry_on_click = show_geometry_on_click
self.draw_options = draw_options or {}
self.edit_options = edit_options or {}
It has also impacted our map, as the changes are provided (Pic. 2).
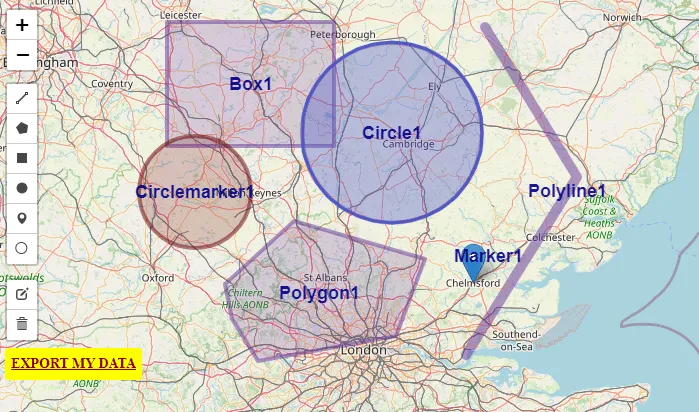
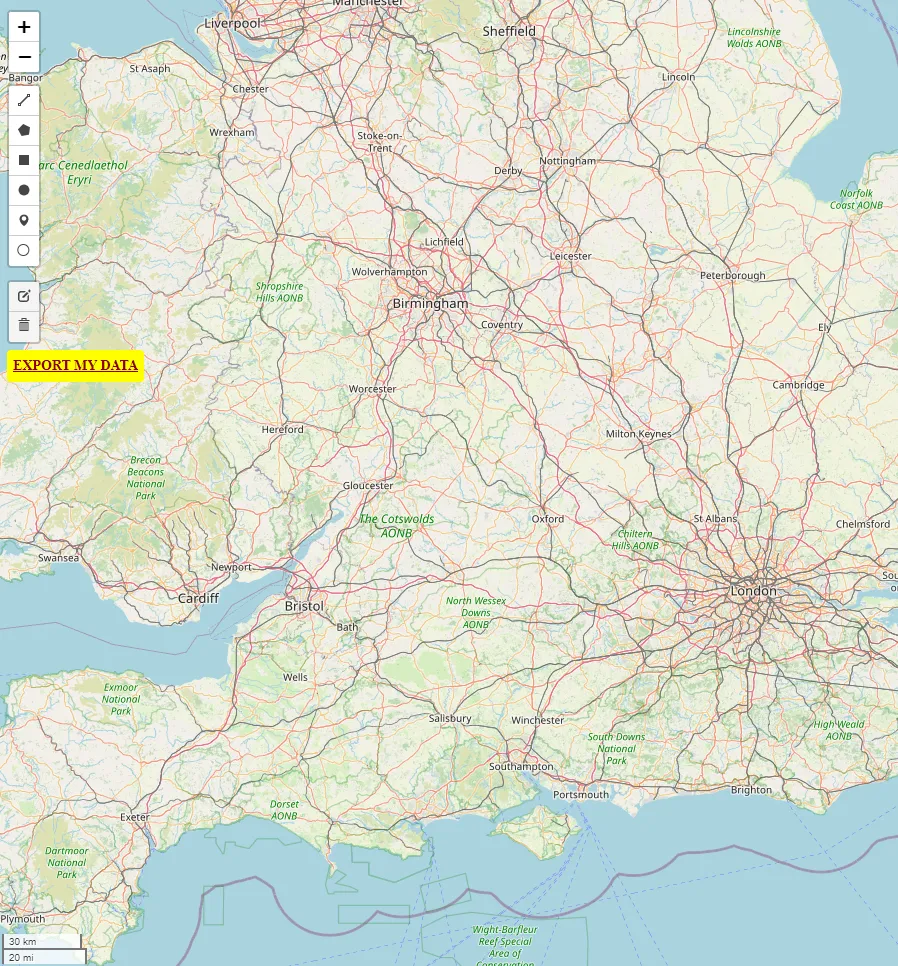
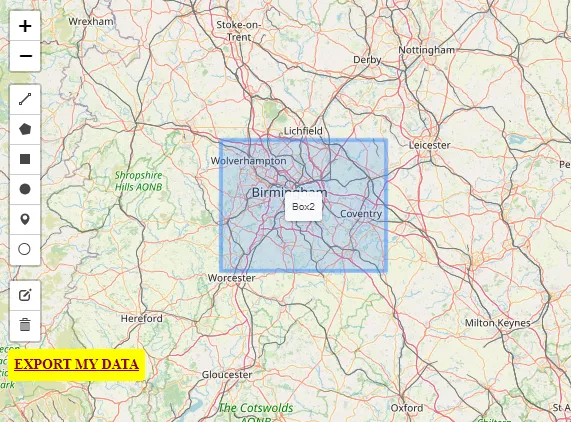
By the way, we can also change our export button by altering content within the <style> and <html> content like shown below, for example, place our export button on the same side where the drawing kit is located (Pic. 3).
export_style = """
<style>
#export {
position: absolute;
top: 5px;
left: 10px;
z-index: 999;
background: yellow;
color: #8b0000;
font-weight: bold;
padding: 6px;
border-radius: 4px;
font-family: 'Helvetica Neue';
cursor: pointer;
font-size: 14px;
text-decoration: underline;
top: 350px;
}
</style>
"""
export_button = """<a href='#' id='export'>EXPORT MY DATA</a>"""
From this time we will work mostly within the JavaScript code and occasionally CSS when styling some bits.
The third element of our exercise can be providing the properties inputs for our drawn objects in order to further distinguish them from each other.
As the first element, we can add preferably 3 new variables, which will be defined by the user:
{{ this._parent.get_name() }}.on(L.Draw.Event.CREATED, function(e) {
var layer = e.layer,
type = e.layerType;
var title = prompt("Please provide the name", "default");
var value = prompt("Please provide the value", "undefined");
var id = (L.Util.lastId)-165;
var coords = JSON.stringify(layer.toGeoJSON());
{%- if this.show_geometry_on_click %}
layer.on('click', function() {
alert(coords);
console.log(coords);
});
{%- endif %}
drawnItems.addLayer(layer);
});
and, because the prompt() method is used, the principle remains the same (2 options of input with defined and default after the comma). The most intricated here is the ID number, which autoincrementing counter depends on the number of maps on the same website as well as their elements. In fact, this is the easiest method of providing the autoincremented ID number for our drawn items. Because we want it to be started from number 1 or similar, we can deduct manually the difference from the default ID proposed for our item. Remember to treat this approach individually.
The user will see differences when drawing something, but the input values will still go into a vanity (Pic. 4).
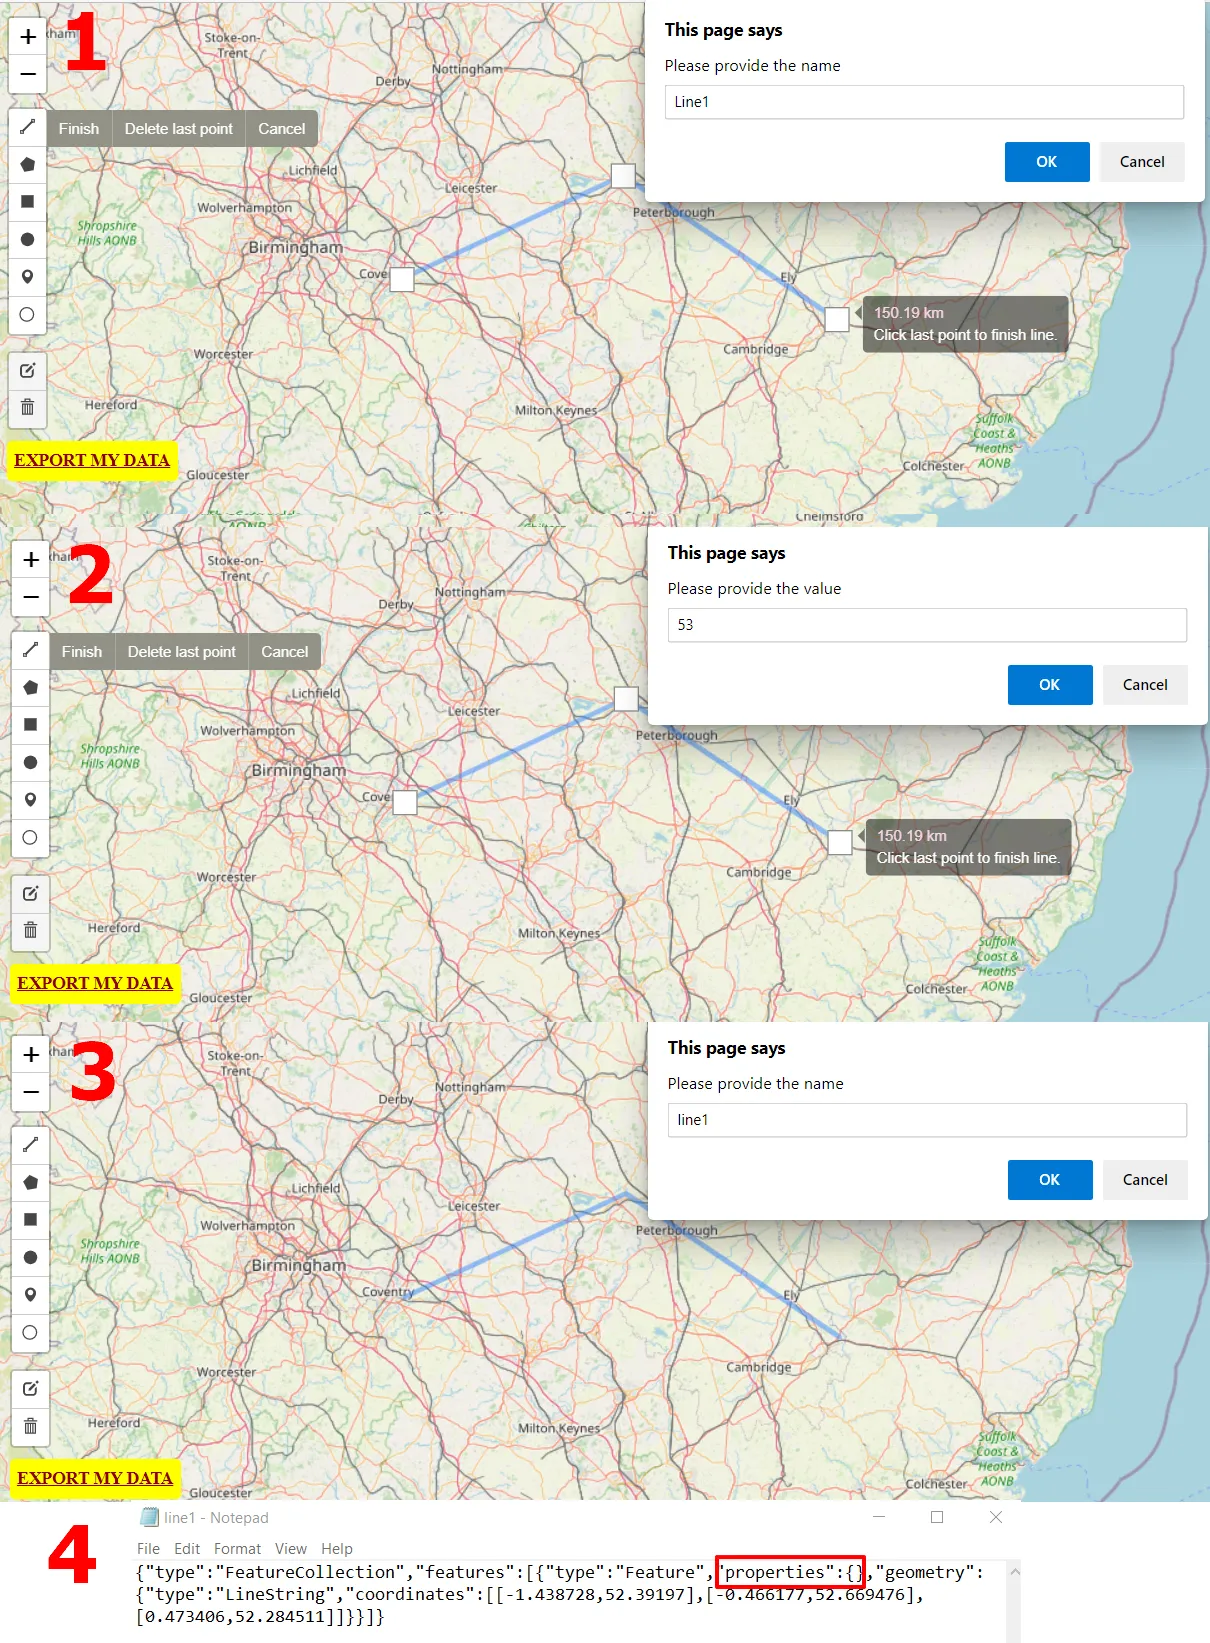
By far, the .geojson is still unable to retain our properties defined after saving. We can find out about it by triggering the pop-up alert by clicking on our drawn item. There is exactly the same – properties don’t come unless we expand our code in the manner as shown below:
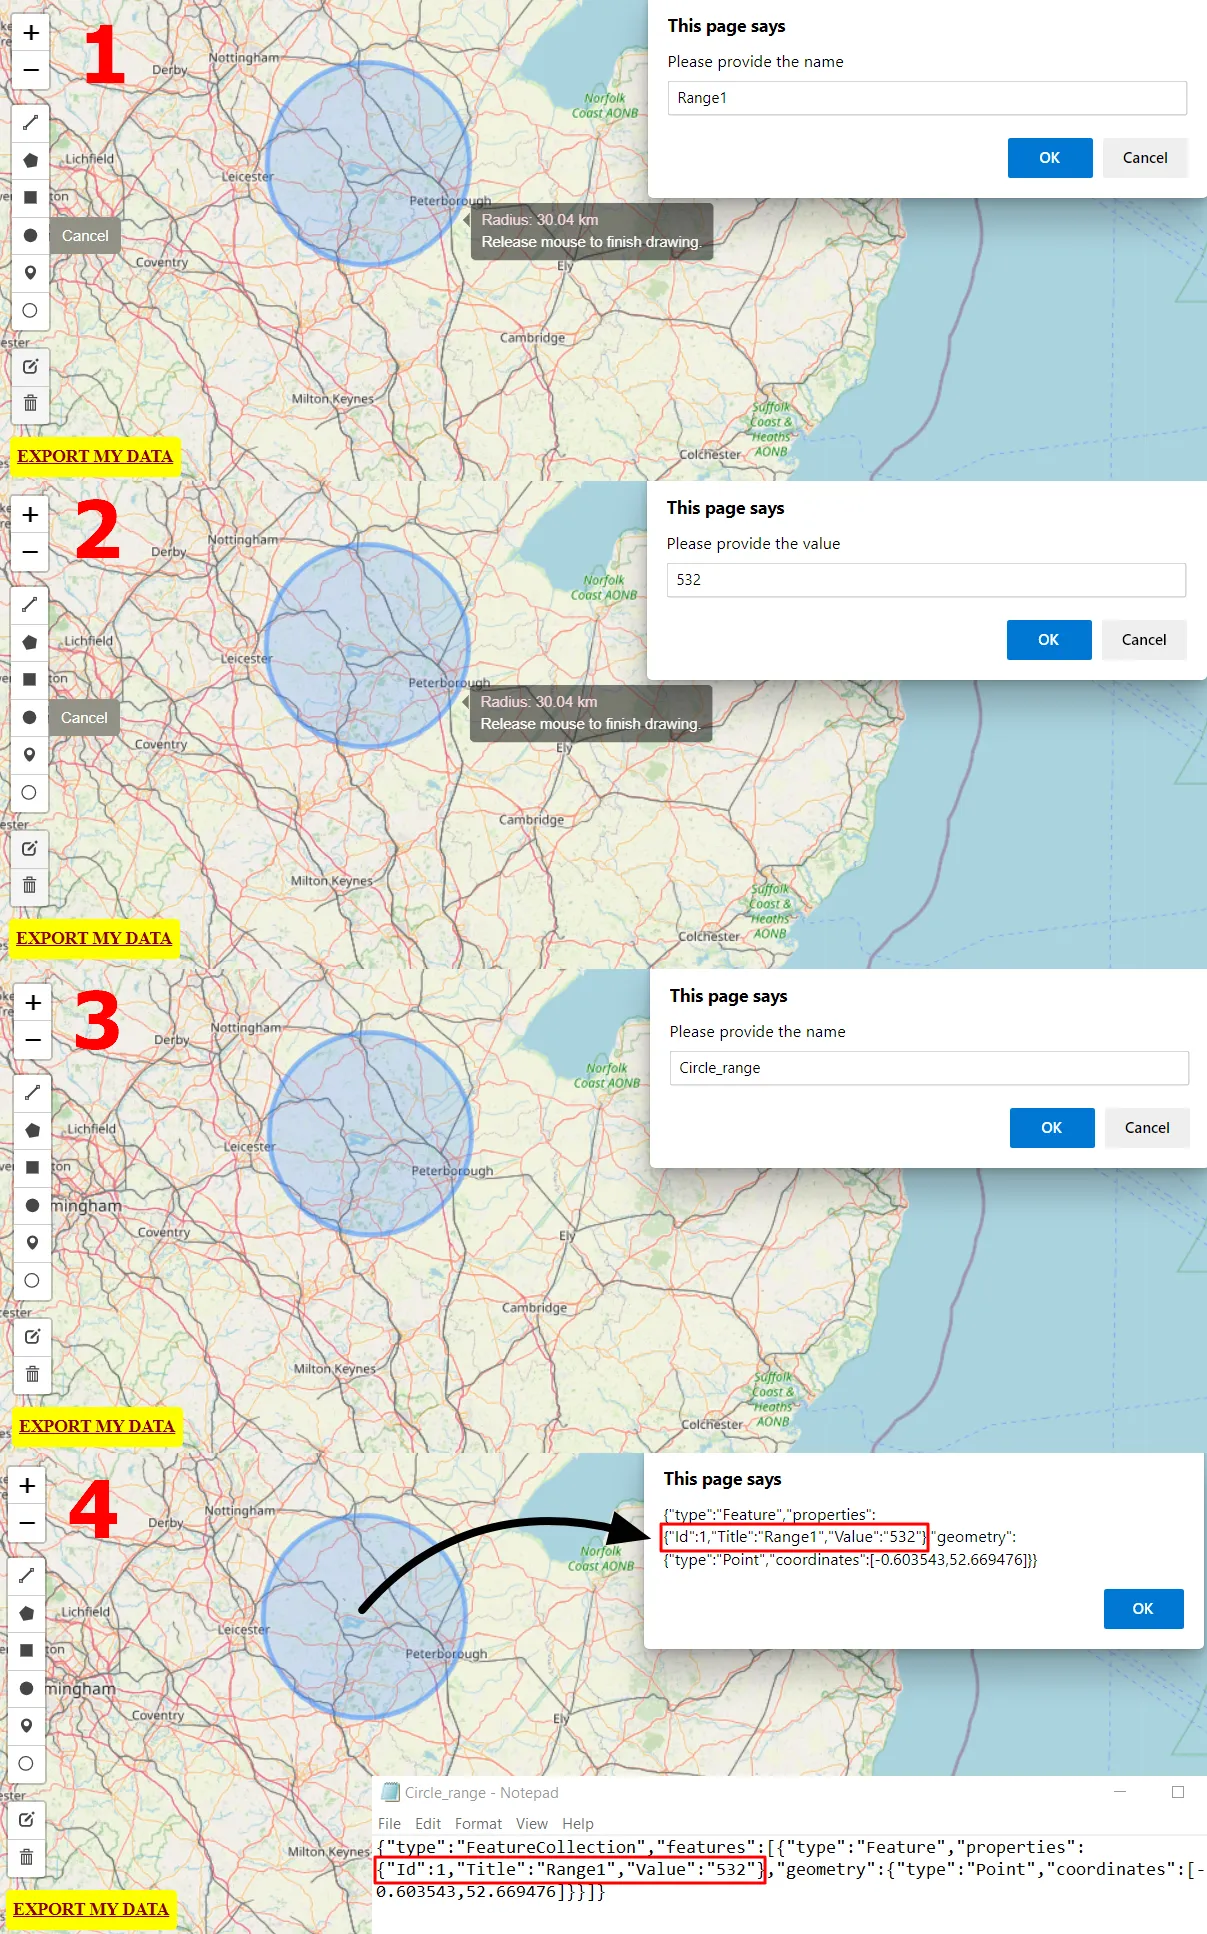
var {{ this.get_name() }} = new L.Control.Draw(
options
).addTo( {{this._parent.get_name()}} );
{{ this._parent.get_name() }}.on(L.Draw.Event.CREATED, function(e) {
var layer = e.layer,
type = e.layerType;
feature = layer.feature = layer.feature || {}; // Initialize feature
var title = prompt("Please provide the name", "default");
var value = prompt("Please provide the value", "undefined");
var id = (L.Util.lastId)-165;
feature.type = feature.type || "Feature"; // Initialize feature type
var props = feature.properties = feature.properties || {}; // Initialize feature properties
props.Id = id;
props.Title = title;
props.Value = value;
var coords = JSON.stringify(layer.toGeoJSON());
{%- if this.show_geometry_on_click %}
layer.on('click', function() {
alert(coords);
console.log(coords);
});
{%- endif %}
drawnItems.addLayer(layer);
});
where the crucial following elements (described in turquoise color) initialize the feature, the type of this feature, and finally its properties. From now on, the user will be able to store his custom-defined properties in the exported .geojson file (Pic. 5).
By the way, we’ve encountered another problem. Our drawn circle cannot be saved properly, and it comes out just as a point (Pic. 6).
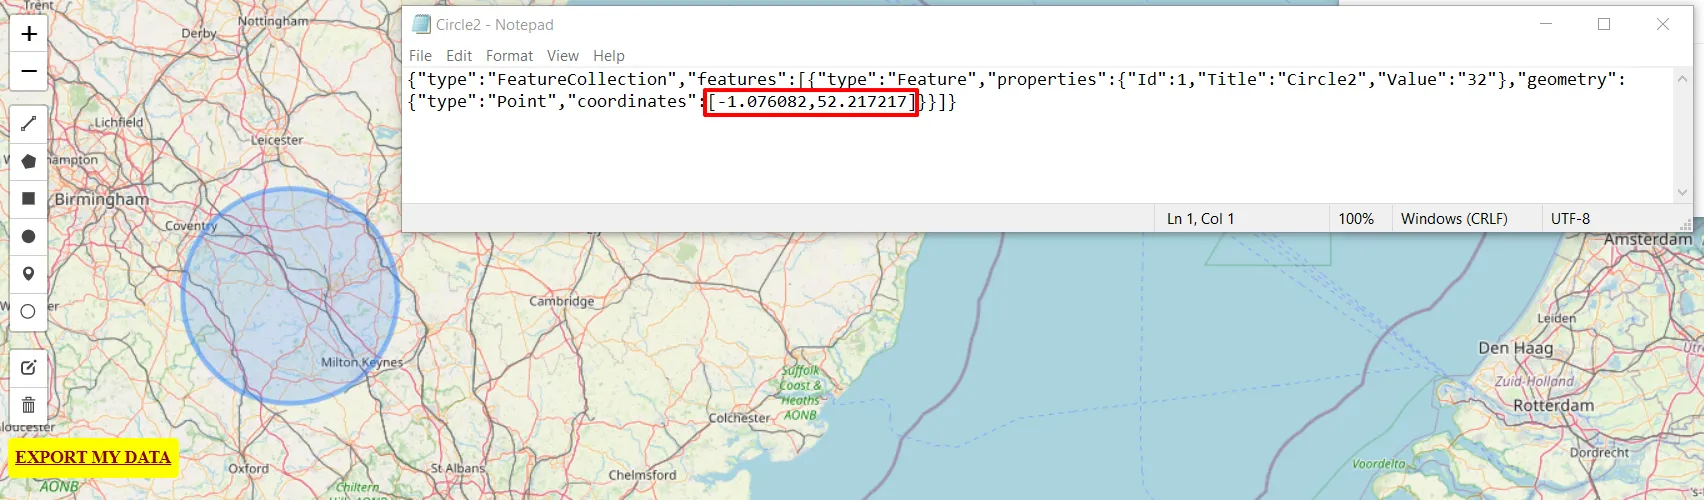
We can figure it out even by looking at the “coordinates” section, which includes just one point. Indeed, an ideal circle cannot be defined by single nodes, but truth be told the Geojson format doesn’t support the circle. Alternatively, we can define the Turf Circle, which defines the number of farthest points from the centroid. It never produces an ideal circle, but when we have it “more round”, we need to define more points (step value). All these steps will act as single nodes being included in the coordinates section. Another method of retaining our circle after exporting the .geojson file is following the Geoman solution, which gets a radius rather than defining additional points (steps).
In this case, we will stick to the Turf Circle solution and provide the polygon covering roughly the built-in Folium Draw circle, but exportable without any issues. The further expanded code will look as follows:
{% macro html(this, kwargs) %}
<script src='https://unpkg.com/@turf/turf/turf.min.js'></script>        {% endmacro %}
After loading the external script for the Leaflet Turf library…
{{ this._parent.get_name() }}.on(L.Draw.Event.CREATED, function(e) {
var layer = e.layer,
type = e.layerType;
feature = layer.feature = layer.feature || {}; // Initialize feature
var title = prompt("Please provide the name", "default");
var value = prompt("Please provide the value", "undefined");
var id = (L.Util.lastId)-165;
feature.type = feature.type || "Feature"; // Initialize feature type
if (type === 'circle') {
var theCenterPt = layer.getLatLng();
var center = [theCenterPt.lng,theCenterPt.lat];
console.log(center);
console.log(title);
var theRadius = layer.getRadius();
var turfCircle;
var options = {steps: 256, units: 'meters'};
var turfCirle = turf.circle(center, theRadius, options);
var NewTurfCircle = new L.GeoJSON(turfCircle)
drawnItems.addLayer(NewTurfCircle);
var thepoint = turf.point(center);
var buffered = turf.buffer(thepoint, theRadius, {units: 'meters'});
var NewTurfBuffer = new L.GeoJSON(buffered)
drawnItems.addLayer(NewTurfBuffer);
}
var props = feature.properties = feature.properties || {}; // Initialize feature properties
props.Id = id;
props.Title = title;
props.Value = value;
var coords = JSON.stringify(layer.toGeoJSON());
{%- if this.show_geometry_on_click %}
layer.on('click', function() {
alert(coords);
console.log(coords);
});
{%- endif %}
drawnItems.addLayer(layer);
});
we should have a separate condition specifically for circles. On our map, the difference will be noticeable, as the code will produce an overlay circle-looking polygon comprised of 256 separate nodes located exactly above the circle produced by standard code (Pic. 7).
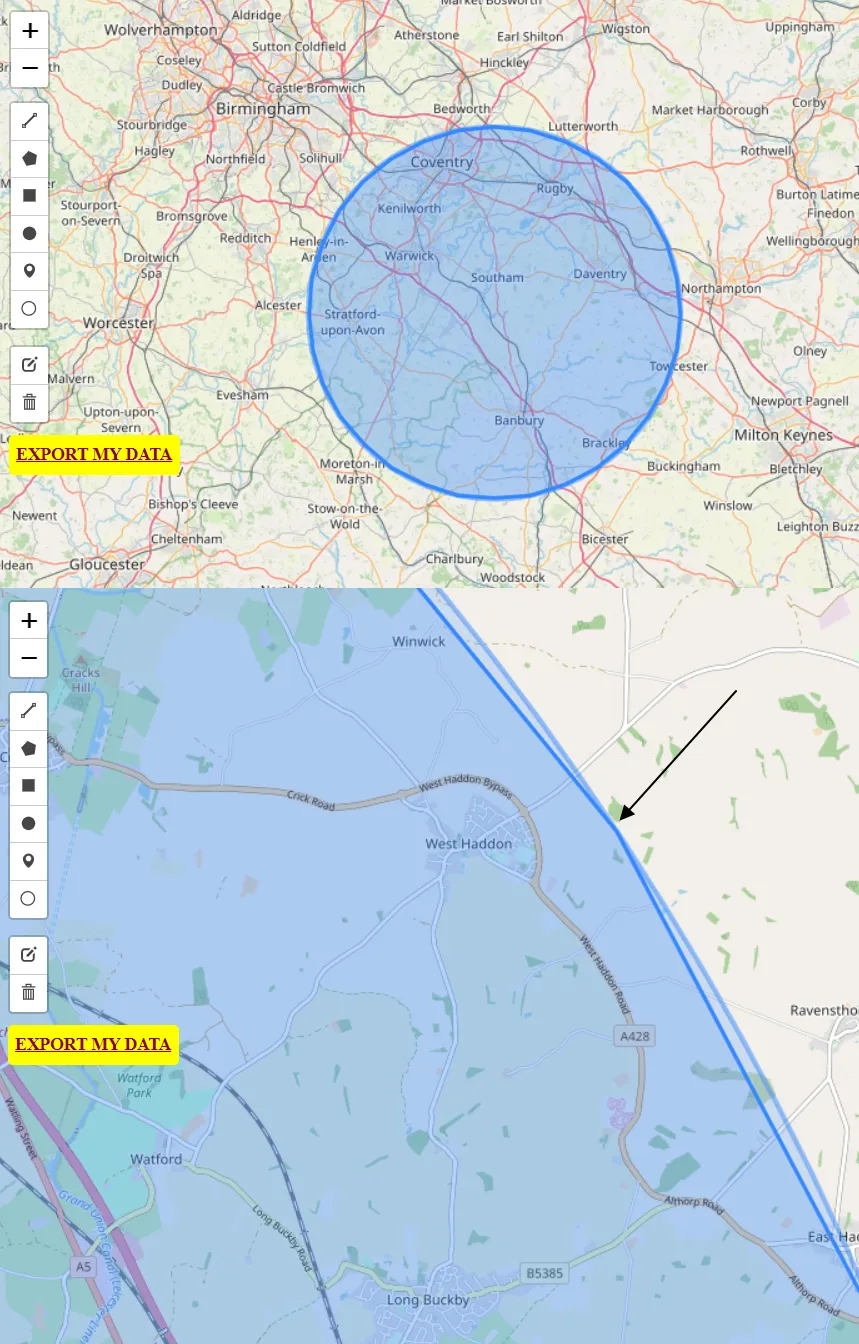
Our turf polygon will never be the ideal circle, but when a huge amount of steps is provided it will resemble the circle, at least for lower zoom levels. On the other hand, we shall expect a significant increment in size, as every single step requires both coordinates stringified to the .geojson file.
There is still one problematic thing, as the defined properties aren’t passed through our Turf polygon.
{"type":"FeatureCollection","features":[{"type":"Feature","properties":{},"geometry":{"type":"Polygon","coordinates":[[[-0.153375,51.977403],[-0.15616,51.995187],[-0.164531,52.012295],[-0.178172,52.028067],[-0.196561,52.041896],[-0.218994,52.053248],[-0.244608,52.061686],[-0.272414,52.066882],[-0.301338,52.068637],[-0.330262,52.066882],[-0.358068,52.061686],[-0.383681,52.053248],[-0.406114,52.041896],[-0.424504,52.028067],[-0.438144,52.012295],[-0.446515,51.995187],[-0.449301,51.977403],[-0.4464,51.959626],[-0.437932,51.942538],[-0.424226,51.926796],[-0.405813,51.913003],[-0.383403,51.901686],[-0.357855,51.893279],[-0.330147,51.888102],[-0.301338,51.886355],[-0.272529,51.888102],[-0.244821,51.893279],[-0.219273,51.901686],[-0.196862,51.913003],[-0.17845,51.926796],[-0.164744,51.942538],[-0.156275,51.959626],[-0.153375,51.977403]]]}},{"type":"Feature","properties":{"Id":6,"Title":"Circle3","Value":"533"},"geometry":{"type":"Point","coordinates":[-0.301338,51.977496]}}]}
In this case, we should make the changes in our code, where the turf plugin has been provided. By looking at the point definition under this line:
var thepoint = turf.point(center)
we can understand it as a simple point just with assigned coordinates. There are no options (properties) assigned.
We can choose the most simple approach here, by making the point definition manually:
var thepoint = {
type: 'Feature',
geometry: {
type: 'Point',
coordinates: center
},
properties: {"Id": id, "Title": title, "Value": value}
};
making our code finally like the below.
if (type === 'circle') {
var theCenterPt = layer.getLatLng();
var center = [theCenterPt.lng,theCenterPt.lat];
var theRadius = layer.getRadius();
var turfCircle;
var options = {steps: 256, units: 'meters'};
var turfCirle = turf.circle(center, theRadius, options);
var NewTurfCircle = new L.GeoJSON(turfCircle)
drawnItems.addLayer(NewTurfCircle);
var thepoint = {
type: 'Feature',
geometry: {
type: 'Point',
coordinates: center
},
properties: {"Id": id, "Title": title, "Value": value}
};
var buffered = turf.buffer(thepoint, theRadius, {units: 'meters'});
var NewTurfBuffer = new L.GeoJSON(buffered)
drawnItems.addLayer(NewTurfBuffer);
console.log(thepoint);
}
Finally, our properties are passed to the FeatureCollection – our Turf circle-looking polygon.
{"type":"FeatureCollection","features":[{"type":"Feature","properties":{"Id":331,"Title":"Circle4","Value":"500"},"geometry":{"type":"Polygon","coordinates":[[[-1.216574,52.541257],[-1.218117,52.550891],[-1.222722,52.560156],[-1.230214,52.568697],[-1.240307,52.576185],[-1.252613,52.582331],[-1.266659,52.586898],[-1.281904,52.589711],[-1.29776,52.590661],[-1.313616,52.589711],[-1.328861,52.586898],[-1.342907,52.582331],[-1.355213,52.576185],[-1.365306,52.568697],[-1.372798,52.560156],[-1.377403,52.550891],[-1.378946,52.541257],[-1.377368,52.531625],[-1.372734,52.522365],[-1.365221,52.513833],[-1.355121,52.506356],[-1.342822,52.500221],[-1.328796,52.495663],[-1.313581,52.492856],[-1.29776,52.491908],[-1.281939,52.492856],[-1.266724,52.495663],[-1.252698,52.500221],[-1.240399,52.506356],[-1.230299,52.513833],[-1.222786,52.522365],[-1.218152,52.531625],[-1.216574,52.541257]]]}},{"type":"Feature","properties":{"Id":331,"Title":"Circle4","Value":"500"},"geometry":{"type":"Point","coordinates":[-1.29776,52.541285]}}]}
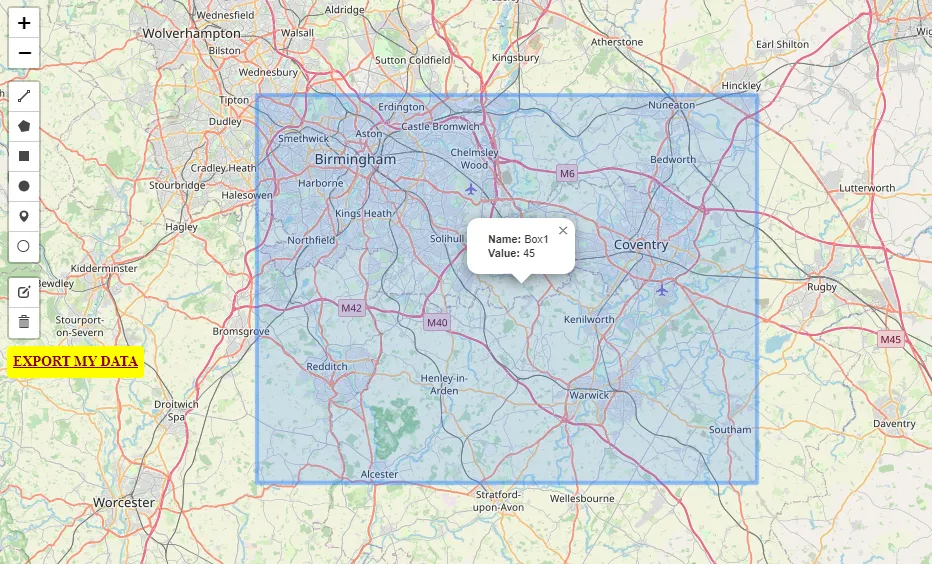
Our next challenge can be applying some on-click information to newly created elements. For this purpose, the best will be launching the Popup window:
layer.bindPopup('<b>Name: </b>' + title + '<br> <b>Value: </b>' + value)
which optionally can include the self-defined properties provided by input (Pic. 8).
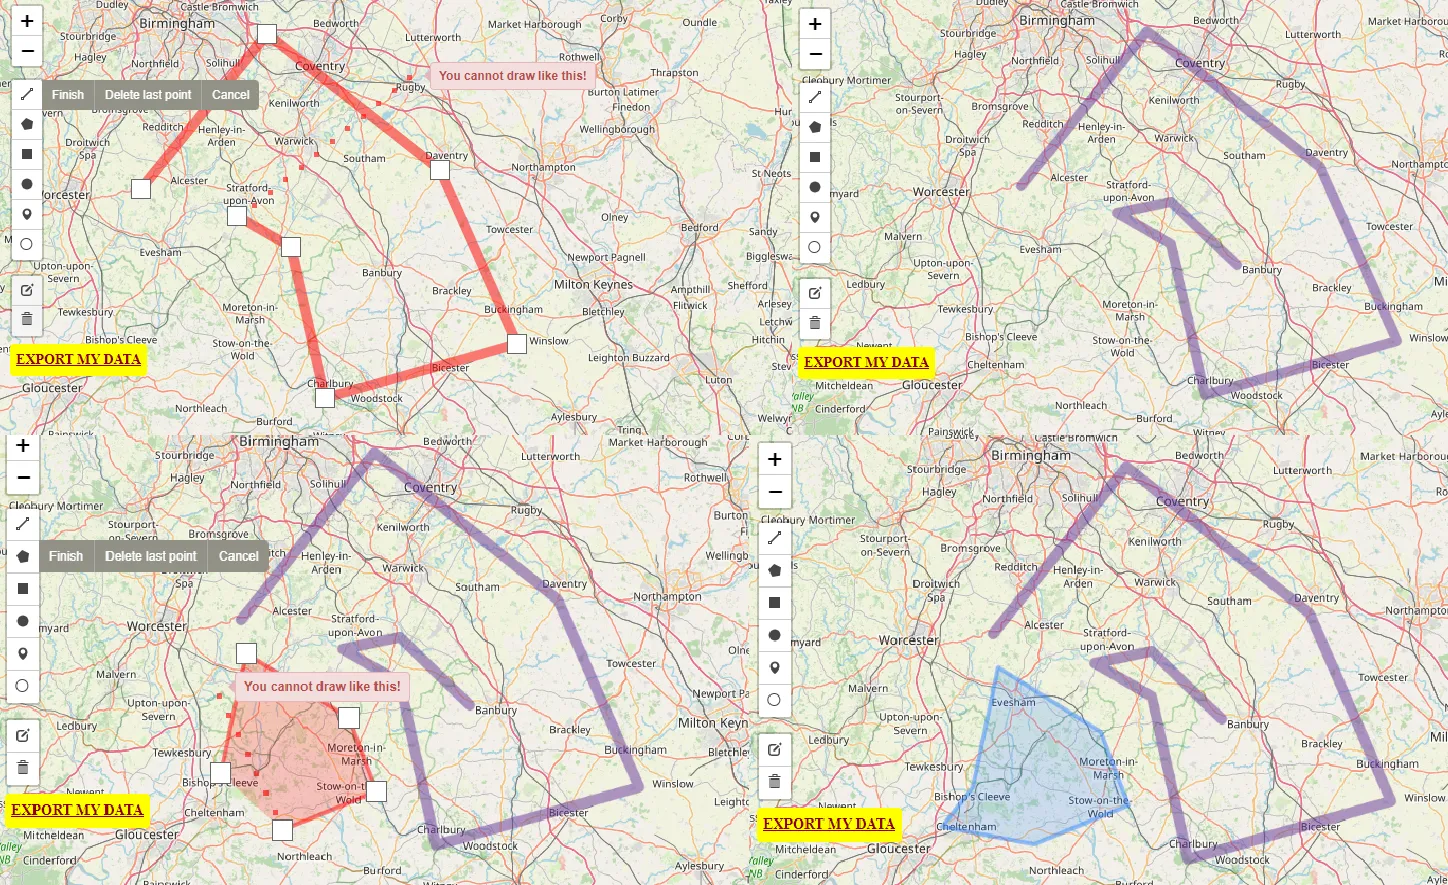
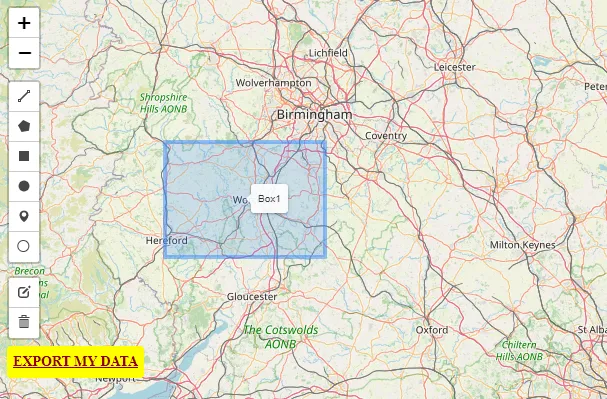
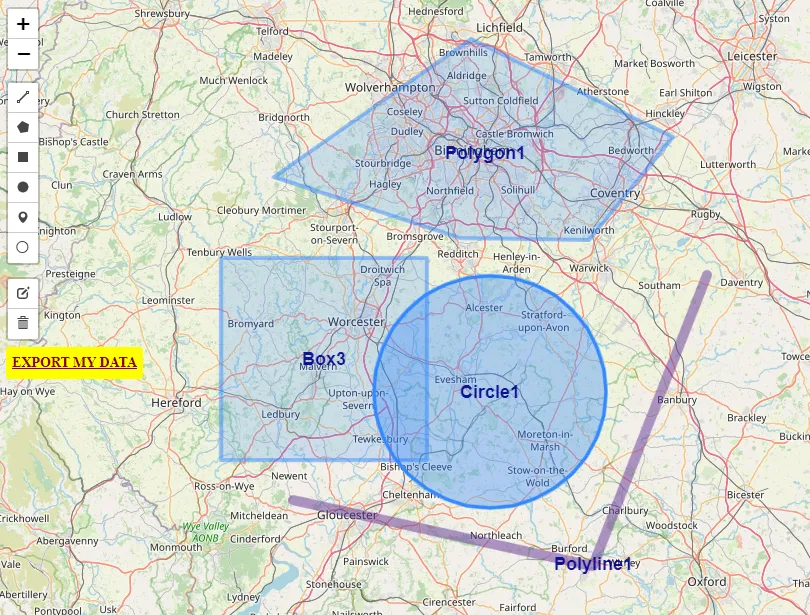
Next, let’s customize some drawing circumstances. We can specify the drawing conditions as well as the colors of the items. For this purpose instead of:
{% macro script(this, kwargs) %}
var options = {
position: {{ this.position|tojson }},
draw: {{ this.draw_options|tojson }},
edit: {{ this.edit_options|tojson }},
}
// FeatureGroup is to store editable layers.
var drawnItems = new L.featureGroup().addTo(
{{ this._parent.get_name() }}
);
options.edit.featureGroup = drawnItems;
var {{ this.get_name() }} = new L.Control.Draw(
options
).addTo( {{this._parent.get_name()}} );
which defines default settings, we can expand this section by providing our own preferences (Pic.9, 10).
var options = {
position: {{ this.position|tojson }},
draw: {
polyline: {
allowIntersection: false,
drawError: {
color: 'red',
message: '<strong>You cannot draw like this!</strong>',
timeout: 1000
},
shapeOptions: {
color: '#663399',
weight: 10
}
},
polygon: {
allowIntersection: false,
drawError: {
color: 'red',
message: '<strong>You cannot draw like this!</strong>',
timeout: 1000
}
},
circlemarker: {
color: '#170022',
}
},
edit: {
featureGroup: drawnItems,
selectedPathOptions: {
color: '#663399',
fillcolor: '#663399'
},
poly: {
allowIntersection: false
}
},
}
// FeatureGroup is to store editable layers.
var drawingColor = '#663399'
var drawnItems = new L.featureGroup().addTo(
{{ this._parent.get_name() }}
);
options.edit.featureGroup = drawnItems;
var {{ this.get_name() }} = new L.Control.Draw(
options
).addTo( {{this._parent.get_name()}} );
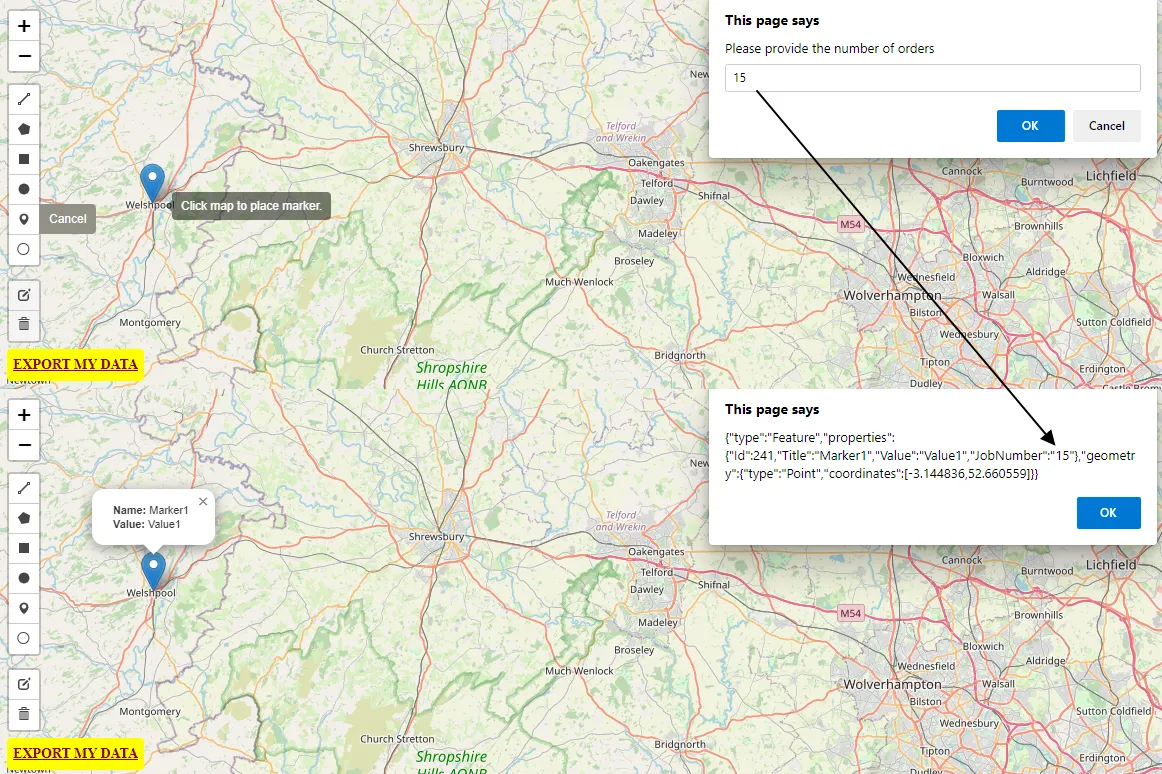
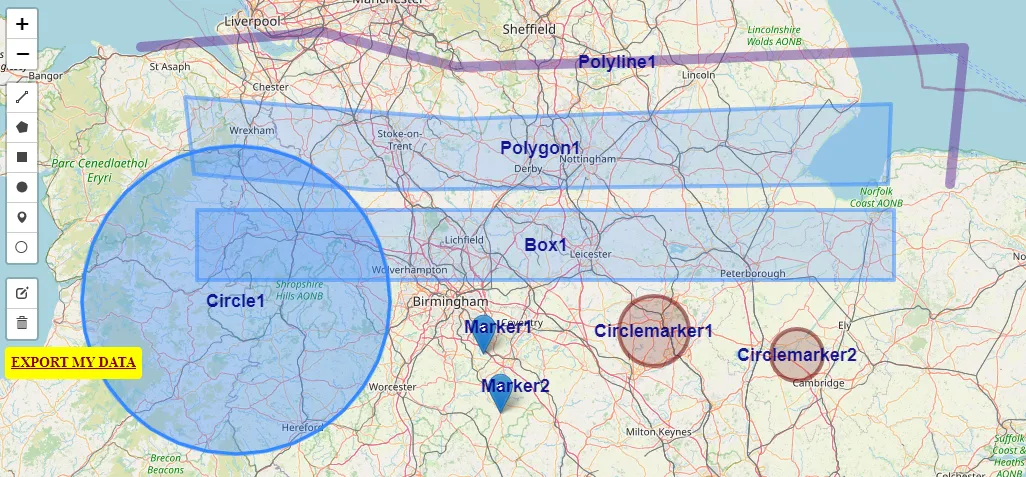
Now let’s expand the functionality of the markers. They’re points representing just a single location instead of a group of locations comprising of some shape or polyline, thus some extra functions can be added to them.
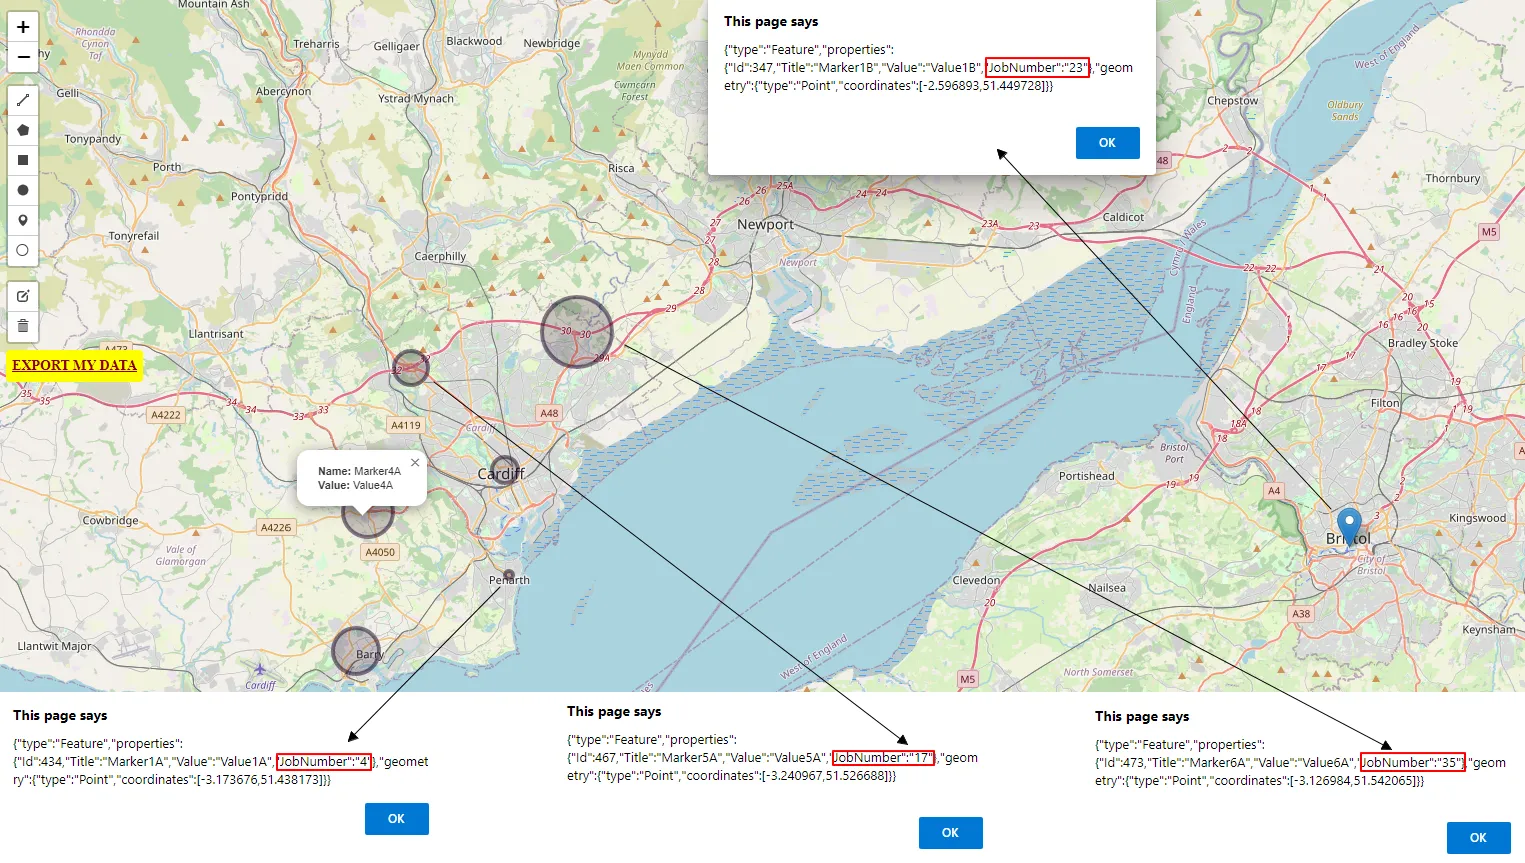
As the first, we could consider another input, make it defined as the “number of jobs”. It will be required only when a marker or circle marker is chosen…
else if (type === 'marker' || type === 'circlemarker') {
var jobnumber = prompt("Please provide the number of orders",0)
}


var props = feature.properties = feature.properties || {}; // Initialize feature properties
props.Id = id;
props.Title = title;
props.Value = value;
if (type === 'marker' || type === 'circlemarker') {
props.JobNumber = jobnumber;
}
and look pretty much like this (Pic. 11).
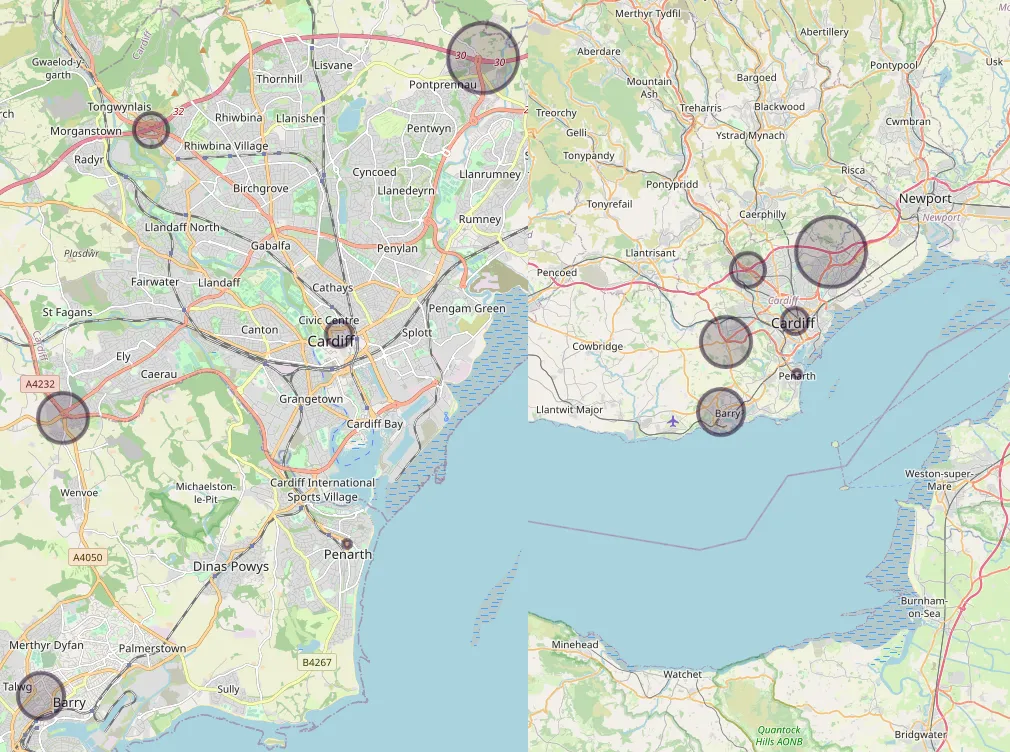
Moreover, for the circlemarker we can make the input-based radius, making it distinguishable from others, which represent different “number of orders”. The breakdown of the conditions is required since now the marker and circlemarker are treated separately despite similar preferences.
var props = feature.properties = feature.properties || {}; // Initialize feature properties
props.Id = id;
props.Title = title;
props.Value = value;
if (type === 'marker') {
props.JobNumber = jobnumber;
}
else if (type === 'circlemarker') {
props.JobNumber = jobnumber;
layer.setRadius(jobnumber);
}
In the circlemarker, we can provide the .setRadius() method, which cannot work with the normal marker. Remember, that the role of circlemarker is just visual, its size will remain the same regardless of the zoom level. It’s the same as for circlemarker used in the Folium map.
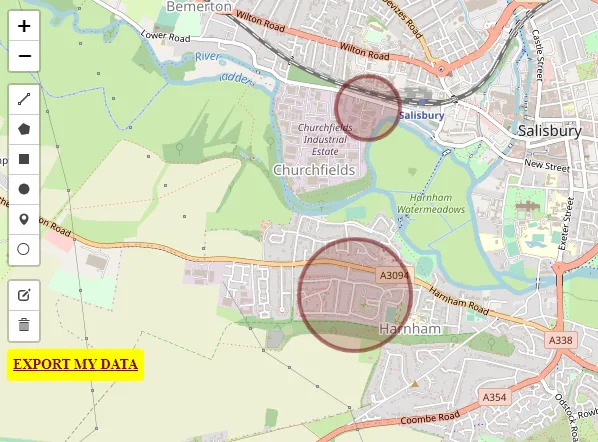
This is just the beginning. Other settings and features can be provided. As you see, the default color of circlemarker has been changed earlier. It can be defined also at this stage when the user wishes to have a different one.
else if (type === 'marker' || type === 'circlemarker') {
e.layer.options.color = '#670000'
var jobnumber = prompt("Please provide the number of orders",0)
}
It can be done quickly for circlemarker. For the normal marker, we need to provide the icon feature.
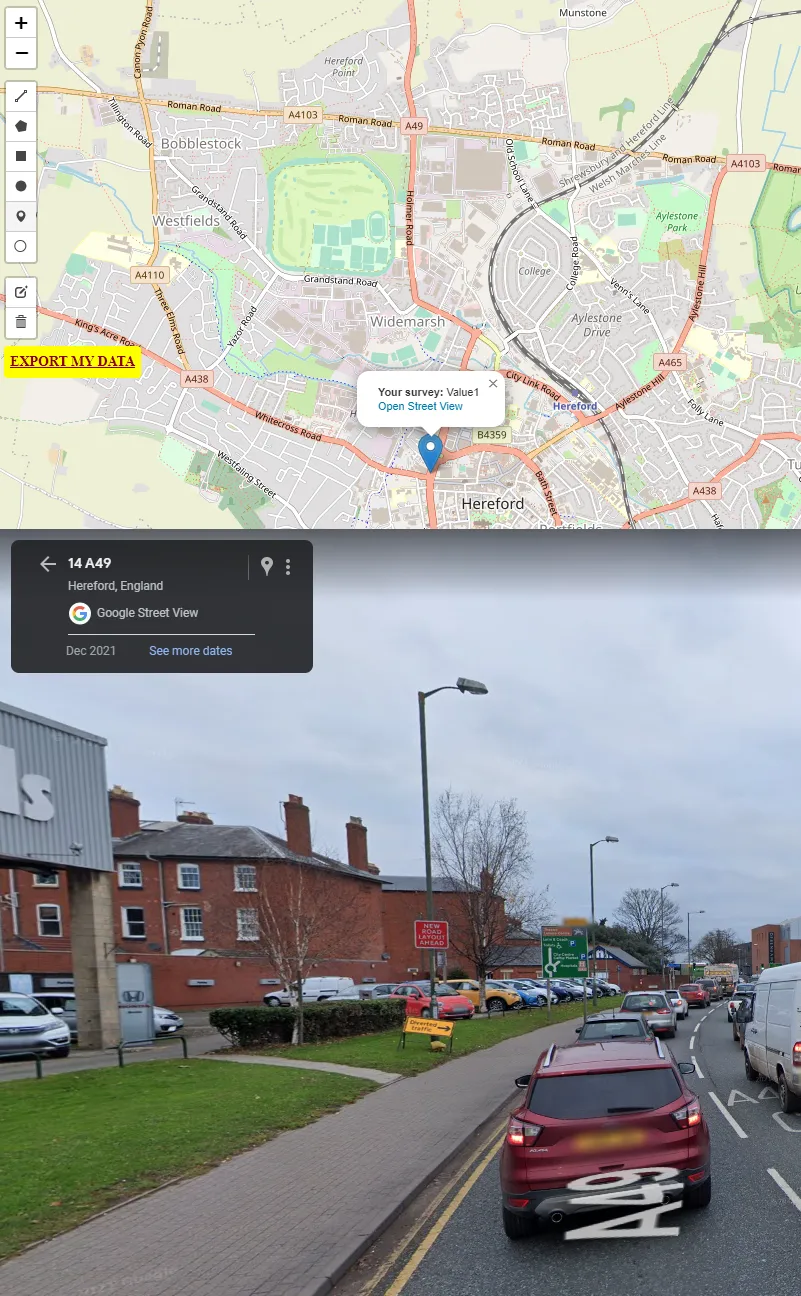
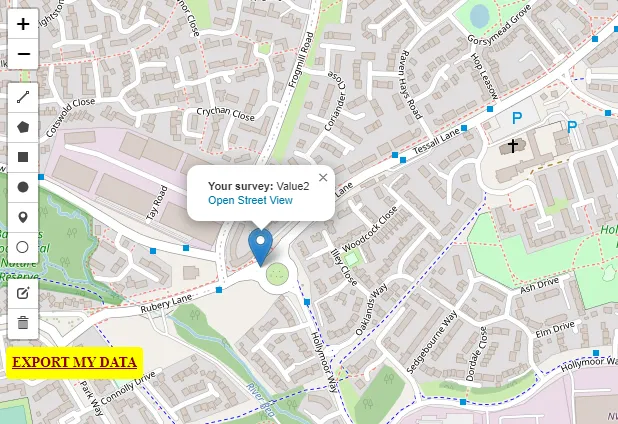
Here is also a space for a pop-up box and even a tooltip. The popup can represent some nice content, not necessarily related just to the provided values. Unlike the example shown earlier, we can include links. Because this is just a point, we could make straight access to Google Street View as discussed in earlier articles. For this purpose, some additional definitions will be required.
else if (type === 'marker' || type === 'circlemarker') {
e.layer.options.color = '#670000'
let lat = e.layer.getLatLng().lat.toPrecision(8);
let long = e.layer.getLatLng().lng.toPrecision(8);
var jobnumber = prompt("Please provide the number of orders",0)
var MarkerPopup = '<b>Your survey: </b> ' + value + '<br><a href="https://www.google.com/maps?layer=c&cbll=' + lat + ',' + long + '" target="_blank">Open Street View</a>'
layer.bindPopup(MarkerPopup)
}
We need to define the coordinates by using the .getLatLng() function, but this geometry must fit the Street View permalink. For this purpose, the decimals must be decreased. There are two functions in JavaScript, which can be used for this purpose. One of them (applied here) is .toPrecision(), and another one is .toFixed(). They define the number of decimals in the brackets, which must be applied. As Google Street View includes 7 decimals after the comma, we need to provide a similar number of digits in our code to make it load correctly (Pic. 17).
So far we’ve used some examples of functionality, which can be applied to the Folium draw plugin. Let’s style them now. We can start from the popup window.
In this case, a separate variable will be needed for storing the popup options. In our code it could look as follows:
var PopupOptions = {
'maxWidth': '400'
}
var MarkerPopup = '<b>Your survey: </b> ' + value + '<br><a href="https://www.google.com/maps?layer=c&cbll=' + lat + ',' + long + '" target="_blank">Open Street View</a>'
layer.bindPopup(MarkerPopup,PopupOptions)
but changes aren’t visible that much as we just decreased the maximum width of our box (Pic. 18).
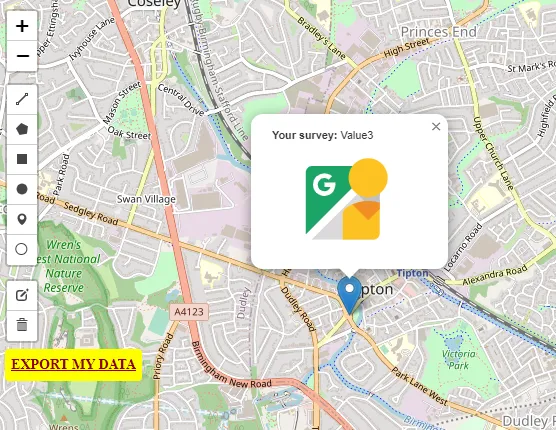
Staying by the Street View popup, it could be vital to include the image instead of crude text. Therefore I’ve prepared something, which could be attached.
var MarkerPopup = '<b>Your survey: </b> ' + value + '<br><a href="https://www.google.com/maps?layer=c&cbll=' + lat + ',' + long + '" target="_blank"><img src="streetview.svg" width="150"></a>'
layer.bindPopup(MarkerPopup,PopupOptions)
Very important is to set at least one of the dimensions parameters, as the image often comes in its original size, which fairly exceeds the popup boundaries.
Now in our popup, the Street View will be achievable by clicking on the image instead of the text (Pic. 19).
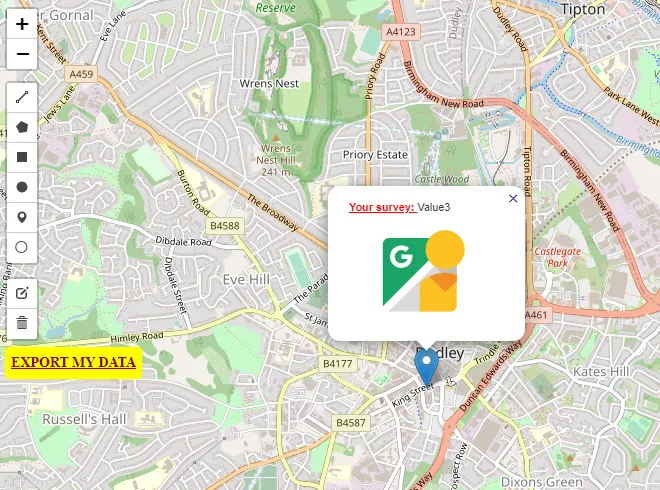
This is not the end, as our popup might have the CSS class included. Before we use the class option, we should create the one in a separate macro dedicated to styling, as follows:
{% macro header(this, kwargs) %}
<style>
.PopupDrawMarker .leaflet-popup-content-wrapper b {
color: red;
text-decoration: underline;
}
.PopupDrawMarker .leaflet-popup-close-button {
color: #00008b!important;
}
</style>
{% endmacro %}
and next…
var PopupOptions = {
'maxWidth': '400',
'className': 'PopupDrawMarker'
}
The class of our popup will always come first in line with the standard leaflet styling class. Moreover, from time to time, the overriding (!important mark) might be required.
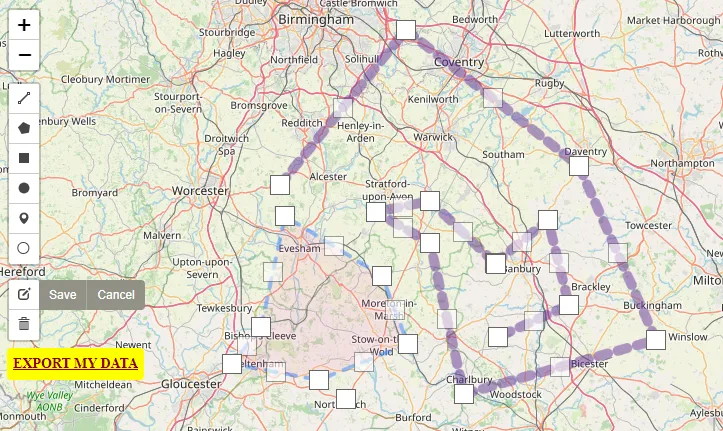
The last element, which should be implemented in this basic package is the tooltip. We will use it not in a standard way, but for label purposes. Firstly let’s define it in the code.
feature = layer.feature = layer.feature || {}; // Initialize feature
var title = prompt("Please provide the name", "default");
var value = prompt("Please provide the value", "undefined");
var id = L.Util.lastId;
feature.type = feature.type || "Feature"; // Initialize feature type
var PopupOptions = {
'maxWidth': '400',
'className': 'PopupDrawMarker'
}
layer.bindPopup('<b>Name: </b>' + title + '<br> <b>Value: </b>' + value)
layer.bindTooltip(title, {})
Secondly, test it on our map (Pic. 21):
where we can see the simplest tooltip possible. Admittedly we don’t want it in this form, as the popup has been defined with the same data. In our case, tooltip could rather act as the label. Therefore some upgrades in the code are required…
layer.bindTooltip(title, {
permanent: true,
direction: 'center',
offset: [0,1],
noWrap: true
})
where we can include the options like offset, direction, etc. Important this time will be making this tooltip visible on a permanent basis (Pic. 22).
It does look exactly the same but appears permanently. Moreover, by setting the direction to the center we are removing the tip visible earlier on the left (Pic. 21). The last step of preparation of the tooltip-based label is applying the CSS class, which must be specified before applying in the options.
<style>
.leaflet-tooltip.draw-label {
background-color: transparent;
border: transparent;
box-shadow: none;
font-weight: bold;
font-size: 18px;
color: #00008b;
}
.PopupDrawMarker .leaflet-popup-content-wrapper b {
color: red;
text-decoration: underline;
}
.PopupDrawMarker .leaflet-popup-close-button {
color: #00008b!important;
}
</style>
layer.bindTooltip('<b></b>' + title, {
permanent: true,
direction: 'center',
offset: [0,1],
className: 'draw-label',
noWrap: true}
)
The effect is striking! Now all our drawn items have their labels visible on the map (Pic. 22-23).
The very last exercise can be changing the color of our drawing – from default blue to violet for example…
var drawingColor = '#663399'
var drawnItems = new L.featureGroup().addTo(
{{ this._parent.get_name() }}
);
options.edit.featureGroup = drawnItems;
var {{ this.get_name() }} = new L.Control.Draw(
options
).addTo( {{this._parent.get_name()}} );
{{ this._parent.get_name() }}.on(L.Draw.Event.CREATED, function(e) {
e.layer.options.color = drawingColor
var layer = e.layer,
type = e.layerType;
feature = layer.feature = layer.feature || {}; // Initialize feature

This is just one of the ways you can expand the functionality of the Folium Draw plugin. The Leaflet JavaScript code inside the MacroElement gives wide opportunities for styling and developing the existing drawing options.
Mariusz Krukar
Links:
- https://leaflet.github.io/Leaflet.draw/docs/leaflet-draw-latest.html
- https://python-visualization.github.io/folium/plugins.html
- http://www.d3noob.org/2014/01/using-leafletdraw-plugin-for-leafletjs.html
- Python Folium plugins
- https://www.colorhexa.com/
- http://python-visualization.github.io/folium/plugins.html#folium-plugins
- Developer.mozilla.org: JavaScript, Window.prompt()
- How to handle circles in GeoJson
- https://geojson.org/geojson-spec.html
- https://macwright.com/2015/03/23/geojson-second-bite.html
- https://itecnote.com/tecnote/adding-properties-to-a-leaflet-layer-that-will-become-geojson-options/
- http://www.d3noob.org/2014/01/using-leafletdraw-plugin-for-leafletjs.html
- https://joeyklee.github.io/geosandbox/hello-drawing-tool.html
- https://www.rfc-editor.org/rfc/rfc7946#section-7.1
- https://www.wrld3d.com/wrld.js/latest/docs/leaflet/L.Util/
- Developer.mozilla.org: toPrecision
Forums:
- https://stackoverflow.com/questions/62337701/how-to-disable-drawing-any-polygon-on-leaflet-map
- https://stackoverflow.com/questions/59419337/how-to-add-text-below-a-marker-in-leaflet
- https://gis.stackexchange.com/questions/212820/overriding-leaflet-tooltip-style
- https://gis.stackexchange.com/questions/383363/adding-geojson-properties-when-creating-marker-in-leaflet
- https://gis.stackexchange.com/questions/285352/how-to-get-the-exact-circle-that-user-has-drawn-using-leaflet-draw-circle
- https://stackoverflow.com/questions/16942697/geojson-circles-supported-or-not
- https://stackoverflow.com/questions/65320098/using-turf-with-leaflet
- https://stackoverflow.com/questions/18014907/leaflet-draw-retrieve-layer-type-on-drawedited-event
- https://stackoverflow.com/questions/50117372/leaflet-draw-togeojson
- https://stackoverflow.com/questions/19721439/download-json-object-as-a-file-from-browser
- https://stackoverflow.com/questions/50327266/two-different-functions-with-one-button
- https://stackoverflow.com/questions/56617345/why-am-i-getting-the-typeerror-l-control-draw-is-not-a-constructor-error
- https://stackoverflow.com/questions/43730206/leaflet-draw-color-while-drawing
- https://stackoverflow.com/questions/71663283/leaflet-geojson-adding-properties-into-geojson-with-an-input-form-in-leaflet
- https://stackoverflow.com/questions/19676090/leaflet-draw-plugin-how-to-hide-show-drawing-tools-by-layer-type-dynamically
- https://stackoverflow.com/questions/51684951/how-to-set-various-option-in-leaflet-openpopup
- https://stackoverflow.com/questions/46443029/add-custom-icons-to-leaflet-draw-toolbar
- https://gis.stackexchange.com/questions/25279/is-it-valid-to-have-a-properties-element-in-an-geojson-featurecollection
- https://stackoverflow.com/questions/8820683/geojson-are-properties-allowed-in-featurecollection
- https://gis.stackexchange.com/questions/198368/create-buffer-around-point-with-turf
- https://gis.stackexchange.com/questions/211496/leaflet-draw-add-attributes-and-save-to-file
- https://gis.stackexchange.com/questions/201958/remove-leaflet-markers-leaflet-id
My questions:
- https://stackoverflow.com/questions/74536711/python-folium-problem-with-editing-draw-plugin
- https://gis.stackexchange.com/questions/412442/openlayers-problem-with-adding-features-to-custom-drawings
- https://gis.stackexchange.com/questions/450640/leaflet-to-geojson-circle-not-working
GitHub:
- https://github.com/Leaflet/Leaflet.draw
- Github.com: Folium plugin draw
- Github.com: Python Folium Draw – extended version
- Github.com: Export a draw circle
- Github.com: How to obtain the geometry(coordinates) of the drawn polygon or circle?
- Github.com: toGeoJSON of L.Circle doesn’t have the radius of the circle #390
- Github.com: Get layer data from polygons in Draw plugin #1388
- Gist.Github.com: Leaflet draw code example
- Github.com: Add option to voronoi to retain properties
- Leaflet marker icons example
Youtube:
Your point of view caught my eye and was very interesting. Thanks. I have a question for you.
What question do you have exactly?