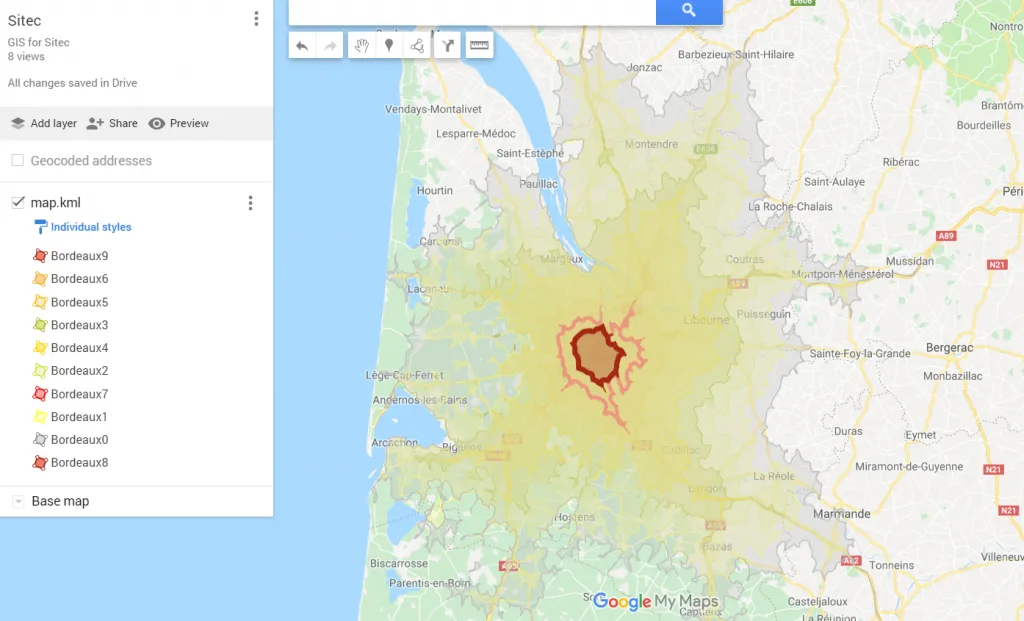
How can I make a geographic heat map in Google Maps?

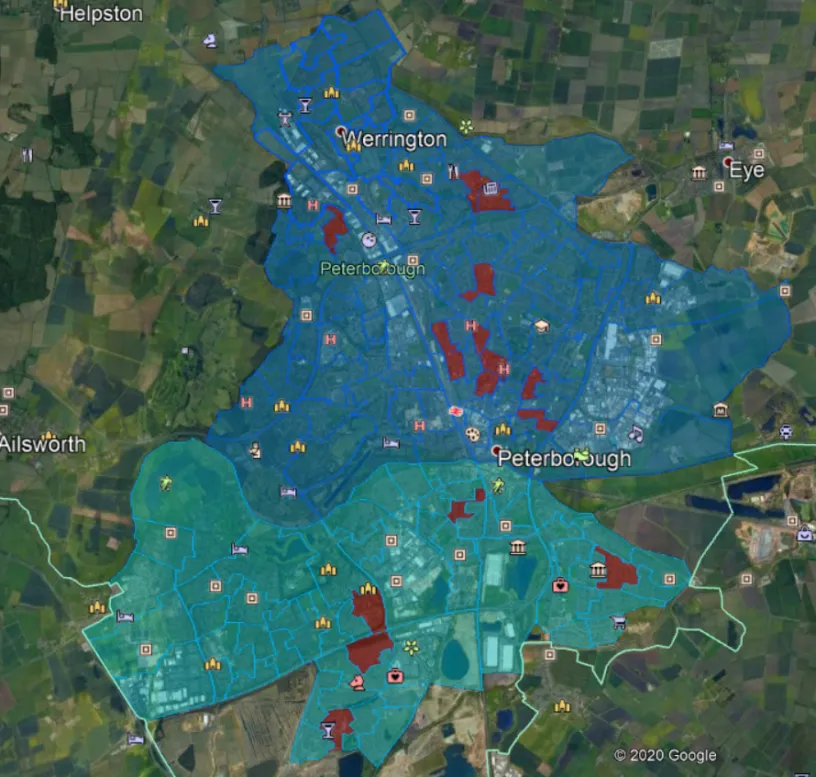
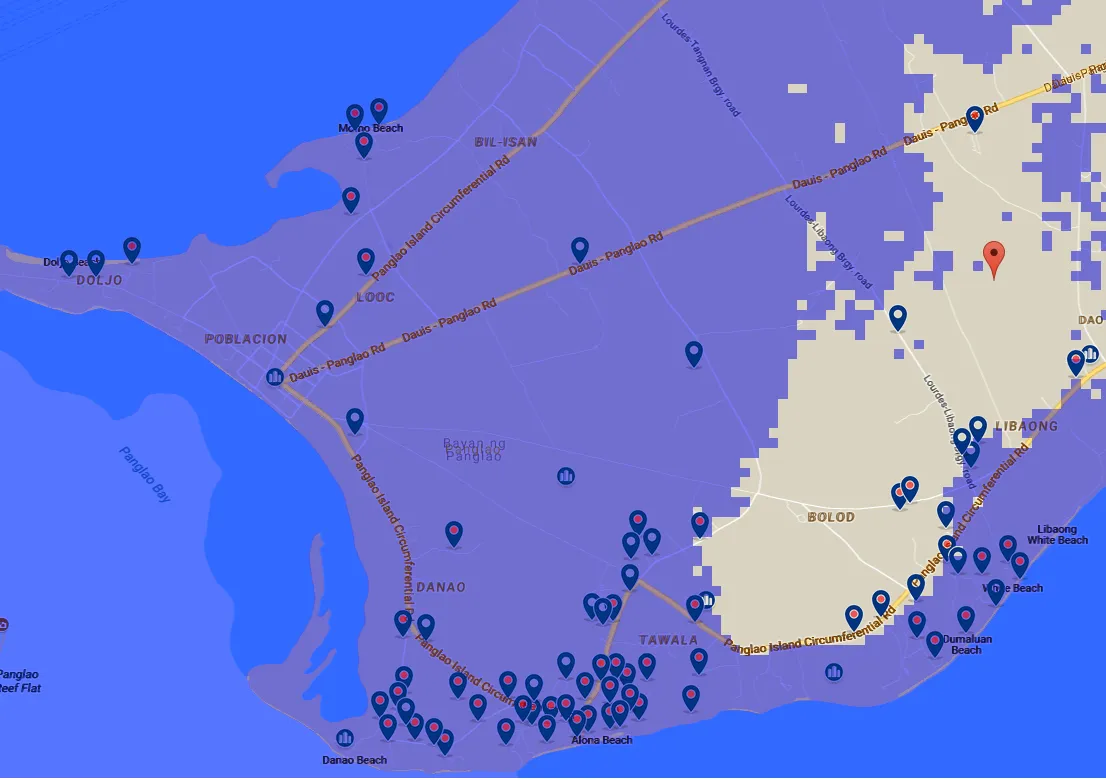
A heat map represents the density of specific data within an area of a map. It presents as color-coded circles on the map, depending on set parameters. The aggregation of this data formulates with location and the radius of influence, which is manually adjusted depending on the user’s preference. When the density of data increases … Read more