
Horizontal visibility as the main factor of long-distance observations, part 2 – contrast, human perception and weather forecast
In the 1st part of this article, I have explained the relationship between visibility and weather conditions as well as an astronomical factor and light scattering issue. Now I would like to explain the contrast phenomena and human eye perception of the view, which are also integral elements of long-distance observations. Recently the contrast issue has been mentioned in the case of light transition, however, that matter was related more to photography instead to eye perception. In the finish, I would like to back to the weather forecast again. A bit of this stuff has been already presented before, but this is still some stuff to show. Let’s get busy then.
- A CONTRAST ROLE IN SIMPLIFIED MODEL FOR VISUAL RANGES AT DAYLIGHT CONDITIONS
Usually, the best contrast with the sky in the background is to be made by the closest objects, which because of their vicinity to the observer are often unobstructed by haze or air molecules. In every single mountain range, located as a latter its appearance will be different despite air transparency. This is the contrast between these two mountain ranges, where a second, further one appears more diminished. The same situation will refer to the next mountain range, located further than the second one seen by an observer, etc. (Pic. 1). It is driven by the contrast law, which says, that a distant object’s appearance (an object illuminance observed) depends on: a real object illuminance, a distance this object to the observer and air transparency.
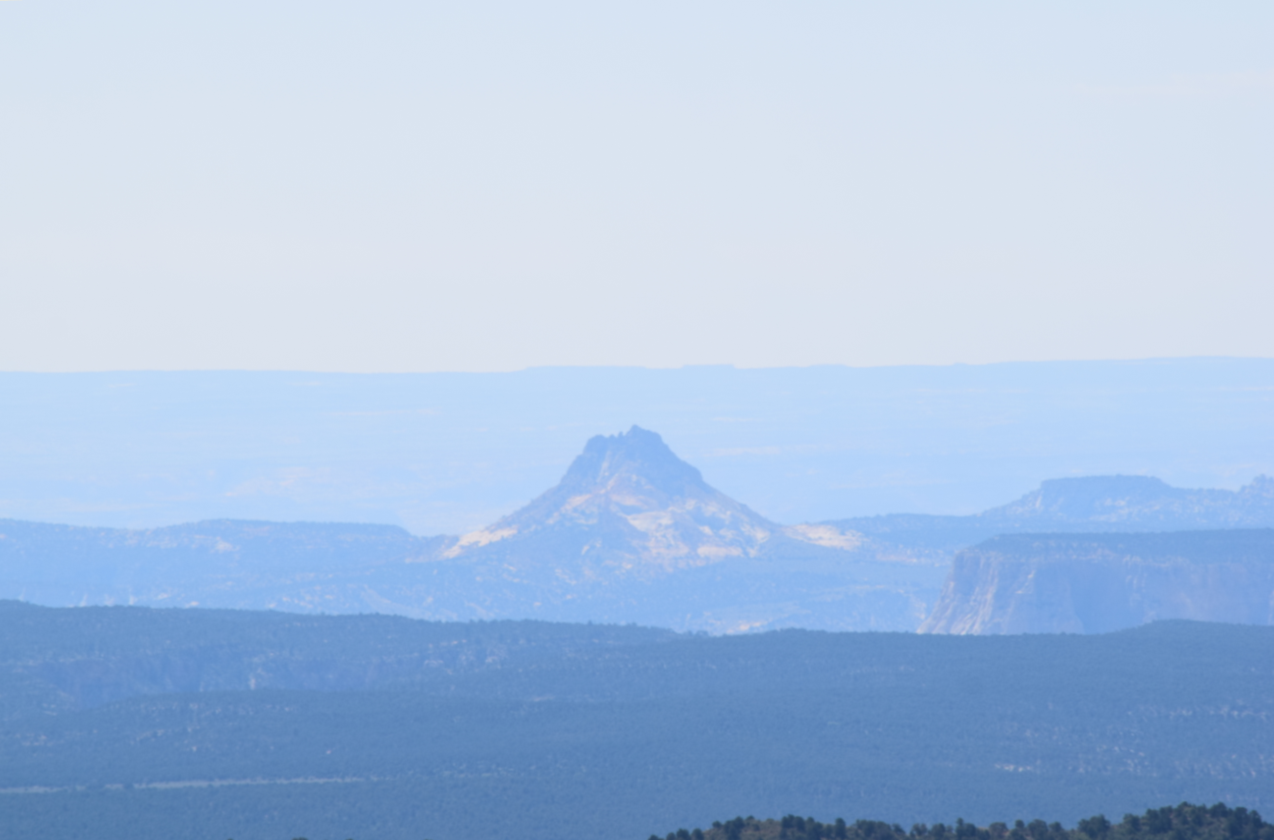
Pic. 1 A practical example of the Contrast law, where every single mountain range, being closer to the observer looks better unlike the most remote observed, which is usually merged with the haze particles or air molecules. View from Bryce Canyon National Park towards Mollies Nipple, UT, USA.
The contrast law is described simply by scattering coefficient C, where C = 1 indicates a completely dark or sharp view against the sky beyond. It refers to objects seen directly from i.e. a 1km distance, where the path between an observer and the object is unaffected by haze or air molecules. In turn, when C = 0 an object is far enough to be completely invisible at particular weather (atmosphere clarity) conditions, which obviously are different, as you could read in the previous part of this article. What exactly means the value 1 or 0? This is the contrast value, that varies between 0 and 1 lines/ min of arc, where 0 states, that object is not visible both to the naked eye and on the digital photos after enhancement. The opposite value 1 indicates a perfect view with the biggest contrast against the sky.
Looking at the charts below, we can see the contrasts for various scattering coefficients. There are 3 curves taken into account, where the black one represents the clearest atmosphere as opposed to the red one, typical for extremely hazy conditions. A lower chart (Pic. 3) shows a detailed situation of extremely low contrast against the distance. A red and blue dotted line shows a maximum visibility range as seen by the observer, knowing that the visibility threshold for the human eye is somewhat above 0.02 lines/min of arc (Schober, Hilz, 1965). It means, that perceivable contrast difference reaches a critical value, typically assumed to be around 2%.
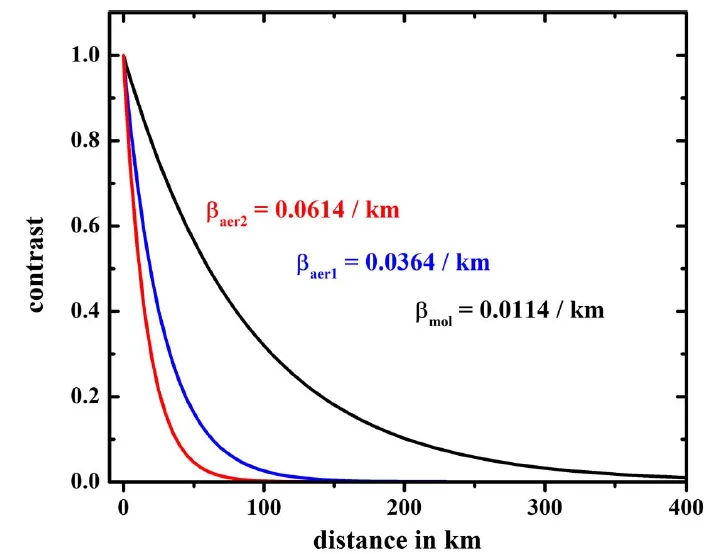
Pic. 2 A contrast values for various scattering coefficients, where the black line corresponds to the most transparent atmosphere, and a red one is the opposite one. Looking at the chart we can see, that the contrast coefficient line behaves likewise in logarithmic function. (Penndorf 1957, Vollmer, Shaw, 2018
Pic. 3 Dependency of extremely low contrast against a distance for different Beta scattering coefficient values (Vollmer, Schaaf, 2018).
The principal basis is, that if the source of light is further, then its appearance is fainter up to be completely invisible. It arises out of increasing air illuminance on the line of sight between an eye and the object observed.
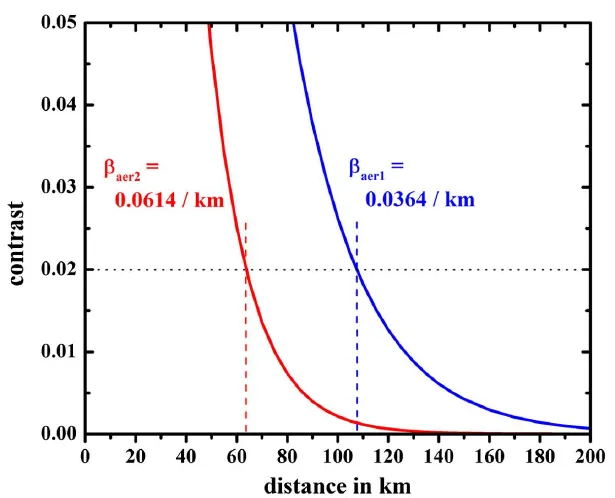
The charts above (Pic. 2, 3) show also another important feature – the line of contrast coefficient, which behaves like a logarithmic function. As you may have noticed, the contrast for various scattering coefficients behaves like a logarithmic scale. It means, that the object looks much fainter comparing it within a short distance. When we compare the view of the object at a longer distance, near the maximum value of visual range its appearance doesn’t vary so much. To be more practical, for shorter paths, like between 20km and 50km distance an observer will see a bigger difference with object illuminance. In turn, the remote object outlines, barely visible by the human eye tend to remain visible with no huge differences i.e. between 100km and 130km line of sight distance (Pic. 4). I believe, that you will find better examples. All images comprised of the pic. 4 have been done in the same air mass, but at a different angular distance to the Sun due to journey progress.
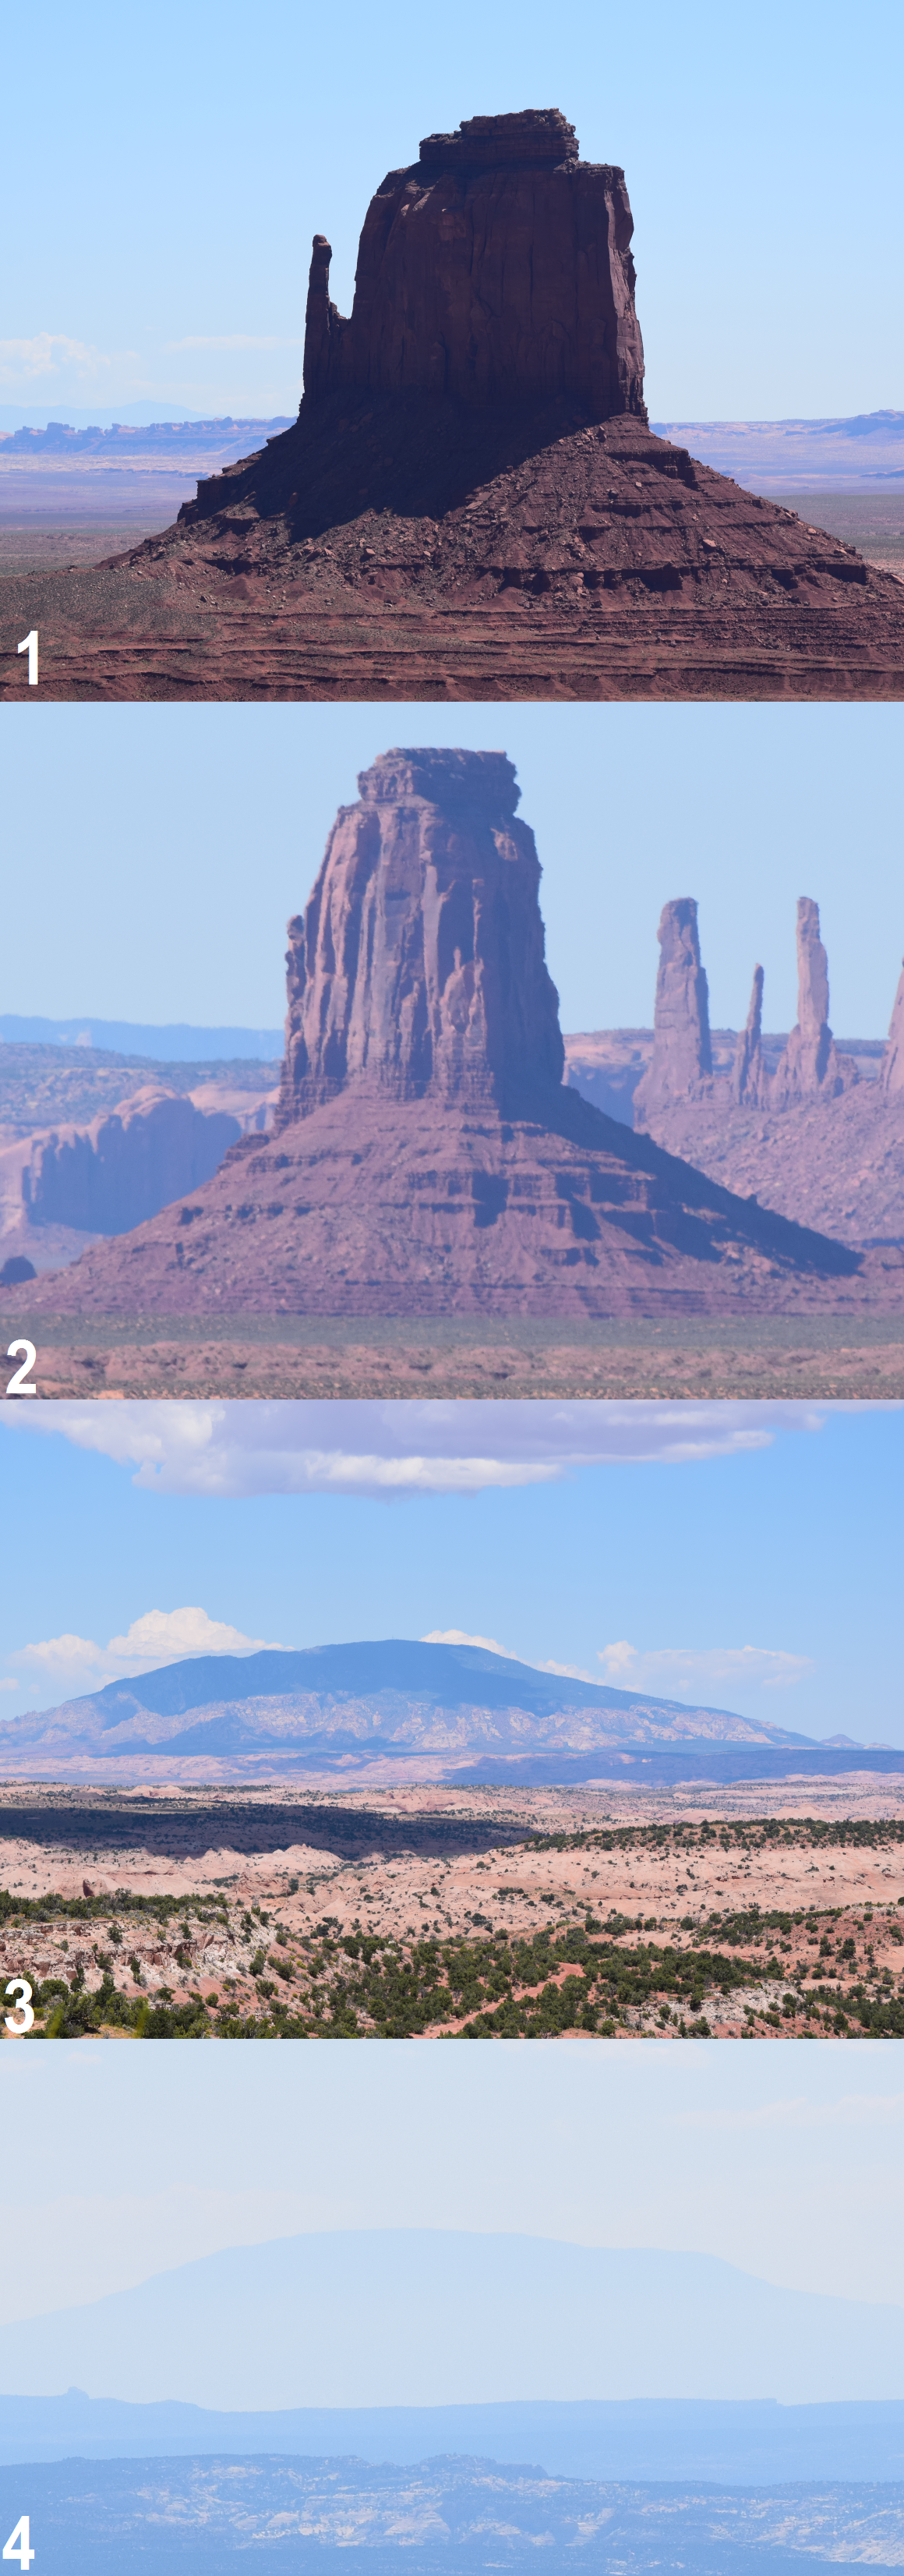
Pic. 4 A contrast comparison between a different line of sight distance from the observer to the remote object. The pictures show a dependence on contrast changes from a distance. At shorter distances this difference appears to be usually bigger, than at longer distances, which is related to logarithmic function: 1 – West Mitten Butte seen from about 1.5km, 2 – West Mitten Butte seen from about 15 km, 3 – Navajo Mt seen from about 40km, 4 – Navajo Mt seen from about 130 km.
It’s good to mention, that the scattering coefficient varies due to other factors, like the density of precipitation and, what is much more important the object’s illuminance, which depends on its surface. The different light wavelengths make various scattering coefficients (Pic. 5).

Pic. 5 A various scattering coefficients due to light wavelength (Abdulsalam, 2012).
Regarding the considerations above about a contrast and scattering coefficient we usually assume, that the atmosphere is horizontally homogeneous, consisting of only a spatially uniform distribution of molecules and haze aerosols. The atmosphere homogeneity is an important factor, but this discussion has been omitted. This is for the sake of simplification. Normally the effects of localized haze layers could be considered as well as a different kind of aerosol scattering. To simplify it is easier to take the same angular scattering factor for molecules and aerosols scattered both isotropic and anisotropic. Moreover, every light scattered in the atmosphere is undermined by molecular and aerosol absorption. Most of the paths through the atmosphere to remote objects are slightly oblique if the observer and object have different heights.
An analog phenomenon to this, which can occur commonly, is cloudiness, which has been roughly explained in the previous part of this article.
The aerosol optical thickness is a measure of the extinction of the solar beam by dust and haze. It tells us how much direct sunlight is prevented from reaching the ground by haze, dust, smoke, and pollution. An average aerosol optical depth is between 0.1 to 0.15. A value of 0.01 corresponds to an extremely clean atmosphere and a value of 0.4 would correspond to very hazy conditions. These values are dependent on the same factors as visual range conditions. For example, the image below shows an aerosol optical depth variation for opposite seasons around the Globe (Pic. 6).
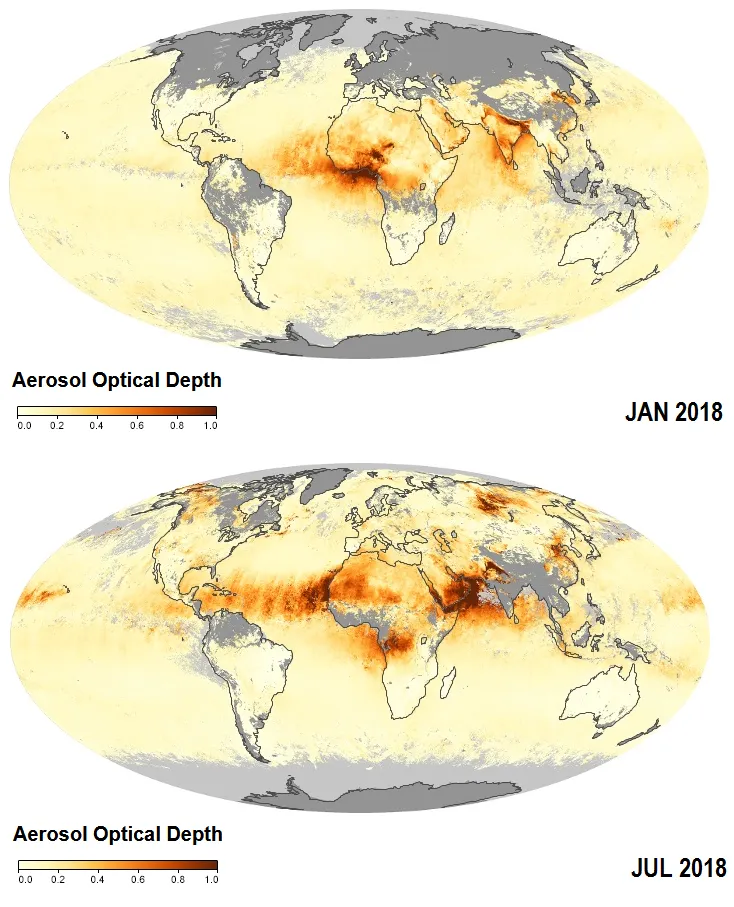
Pic. 6 Aerosol optical depth around the world comparison between the opposite seasons. The scale has been extended to percentage-like values. (Credits: Earthobservatory.nasa.gov)
Looking at the image above we can also find an answer to why the visibility conditions tend to be the worst in Europe during the summer when aerosol optical depth is the biggest. However is not a rule, because the climate is dynamic and changes every year. We should treat it as a tendency.
More about aerosol optical depth says the Angstrom coefficient. The Angstrom coefficient describes the dependency of the aerosol optical thickness or aerosol extinction coefficient on the wavelength (Pic. 7). The Angstrom exponent is inversely related to the average size of the particles in the aerosol – when the particles are smaller, the exponent is larger.
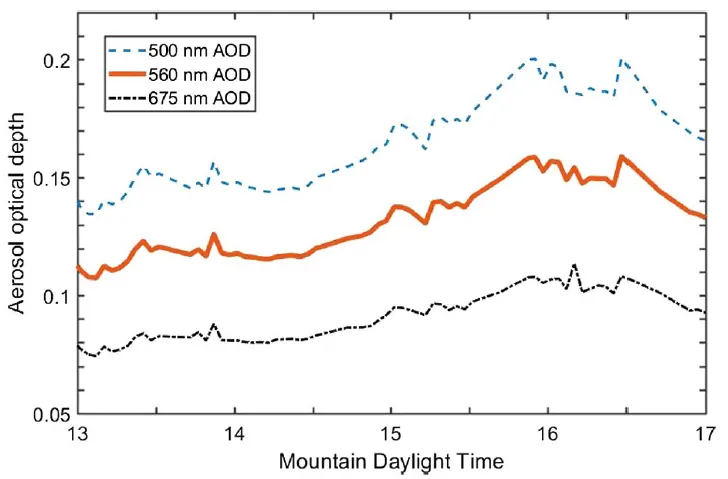
Pic. 7 An aerosol optical depth variation between 1 pm and 5 pm Mountain Daylight Time on 21.08.2017, when a total solar eclipse occurred above the USA (Schuster, Dubovik, 2006)(Vollmer, Shaw, 2018).
2. HUMAN PERCEPTION OF VISIBILITY AGAINST THE PHOTOGRAPHY AND SIMPLE IMAGE PROCESSING TECHNIQUES
Human perceptions of horizontal visibility should be treated like psychophysical responses of the eye-brain system to incoming radiation (Malm, 2016). This factor determines the skill of the observer at resolving the object against its background. This is referred to as the minimum contrast between the object and the sky (AlecBennett, 2016). It was concluded that the eye-brain system to some degree compensated for the effects of haze on the color change of the landscape feature as the haze level increased or decreased (Malm, 2016). The human eye operates much like a photographic camera because it has a lens to focus an image on a very sensitive detector called the retina (Malm et all. 1999). The eye is able to detect relative differences in brightness, thus the eye measures contrast between adjacent objects or between an object and its background. As you know from the previous section the contrast of an object is simply the percent difference between an object’s luminance and its background (Malm et all, 1999). Visibility estimates can also be made during the night by observing the maximum distance that light of known intensity can be identified. The human eye can easily identify closer targets in full moonlight. In this case, the relationship between illumination and light scattering within the haze or air molecules will be the same. Moonlight is too faint to distinguish extremely far objects, which usually during the day, even under the best atmospheric clarity looks like faint outlines with small contrast between them and the illuminated sky beyond. For these very distant objects with a visual range close to their distance from the observer important is the assumption to be black in order to enhance their outlines. It will give the best possible contrast with the horizon. As we know, the contrast critical value for the human eye is 0.02 of the scattering coefficient. To move this critical value down we definitely need a digital photo enhancement (Pic. 8).

Pic. 8 Moving the contrast critical value down through a simple dehaze process allows the observer to see the vista, which he was not able to see on site. More details about the quickest way to dehaze a picture for long-distance observation purposes have been released here.
There are ways of how to do it. Some of them I described here. Another one, the quickest for mobile phones is provided by Photoshop Express. Anyhow this step is necessary for these objects because the amount of light transmitted from them is strongly attenuated via scattering along the line of sight. Such that the observer sees very little transmitted object radiation or, as often happens, the objects appear to be invisible by the naked eye and further photo corrections are required. The exceptions to this are non-black objects like snow-capped mountains, which are able to reflect the sunlight more effectively.
3. HOW TO PREDICT GOOD VISIBILITY CONDITIONS?
The best way to predict good visibility conditions is by looking at special weather forecast websites. Nowadays it is becoming more straightforward due to the quick development of interactive weather predictions and real-time weather monitoring. However, some of these platforms don’t contain many important weather elements such as humidity, visibility, or dust concentration, which for long-distance observation observers plays a key role. Instead of this, you can find decent information about precipitation, cloudiness, temperature, etc. which obviously can help, but more for people being clued up enough with visibility predictions. Possibly you will become this type of person when you have read a previous part of this article. Anyway, even if you did this I am going to show you a more simple way to check the visibility patterns for a few days ahead between the observation place and potential objects (mountains) to be observed at once. For this purpose, I will use both numerical weather predictions and interactive weather forecast platforms, which become popular recently.
Maybe not the most known yet, but for sure the most convenient interactive weather forecast is the Windy.com platform. I would like to stick to this server a bit longer, because anyone, who is interested in visibility conditions can find relevant weather elements there.
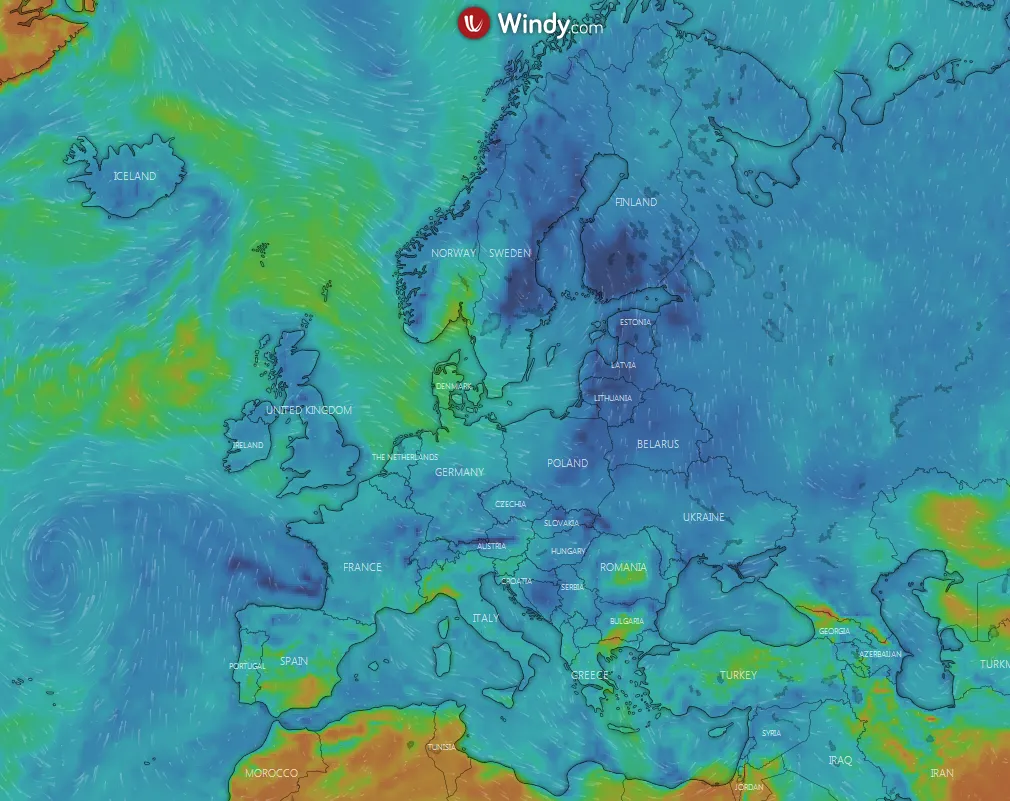
Pic. 9 Windy.com – an interactive weather forecast platform.
Windy.com has a well-developed menu, where a lot of weather elements have been taken into account. All of them have been presented in the picture below (Pic. 10), where these ones, relevant from a visual range point of view have been redded off.
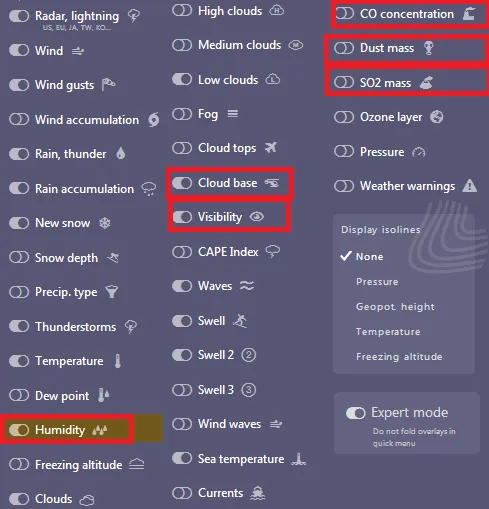
Pic. 10 Windy.com weather forecast main menu.
These elements are obviously proposals. I haven’t marked i.e. fog, because intentionally when fog occurs, then a visual range is near 0, when there is no fog, then it’s better to check the humidity value in order to know is, for instance, misty or not. Another element, which can be sometimes important is a dew point and precipitation, although, In my opinion, all elements marked by red rectangles should be sufficient to determine a visual range quality in an interesting area.
The Windy.com main menu is located on the right of course (Pic. 10). In the meantime, I would advise you – to create an account, because it can help you set your favorites or custom weather alerts, etc.
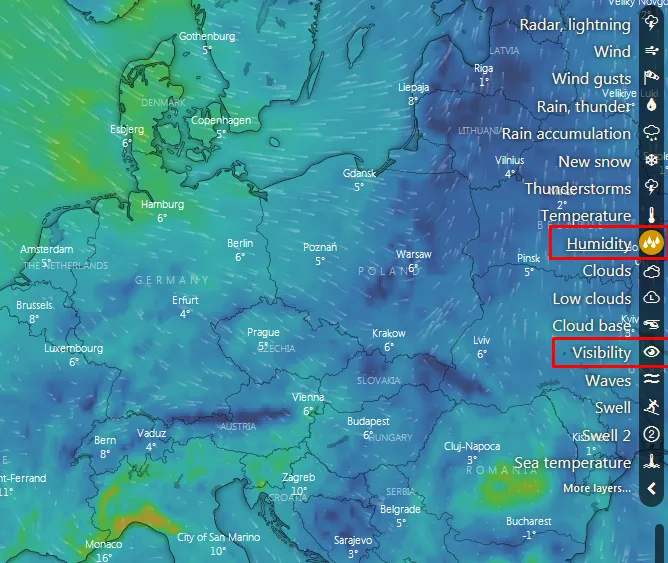
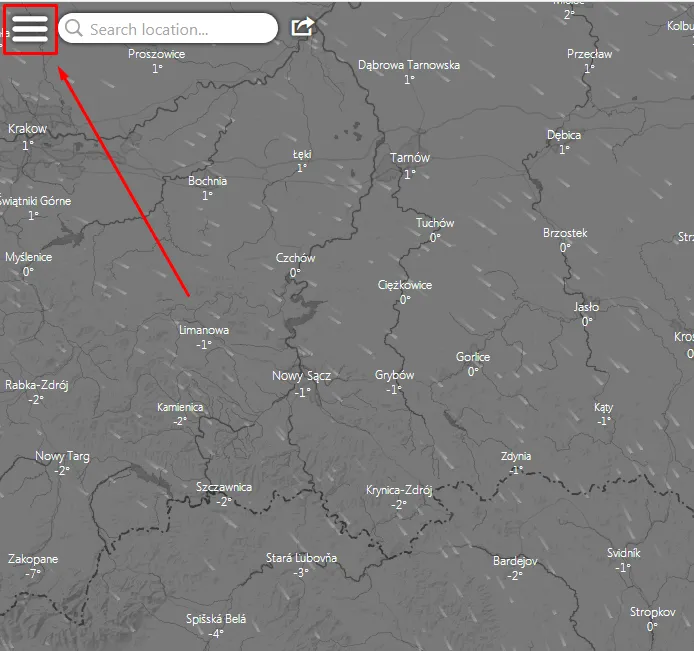
Pic. 11 Windy.com – a weather forecast main menu on the right part of the screen with some relevant weather elements marked by the red rectangle.
Before we start to analyze every weather element separately, I would like to aware you, that on the Windy.com portal you are also able to:
– check the detailed forecast for every single place (with the meteogram too) around the World up to 5 days ahead! (Pic. 13) using different forecast models, (Pic. 14)
– measure the distance between multiple places, (Pic. 15)
– check the sounding forecast, where you can check local vertical atmosphere features, like the height of the inversion layer, etc. (Pic. 19)
– adjust the weather forecast map to your needs (Pic. 16, 17) i.e. change units, layers colors, or background map,
– embed the weather forecast map into your private website or blog.
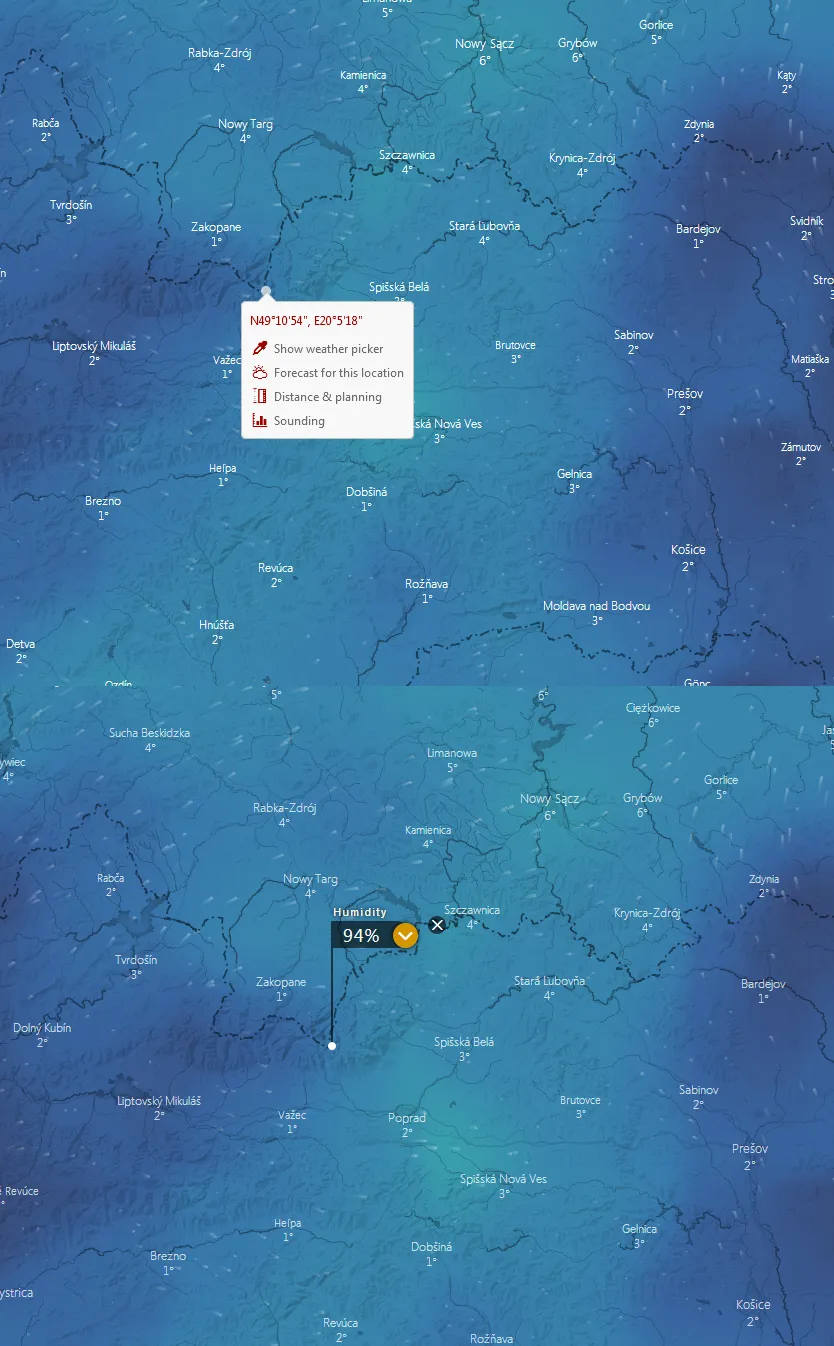
Pic. 12 A right-click menu at Windy.com. The bottom image shows a “Weather picker” example with a certain value proper for every single weather factor forecast.
So now, when you have the main menu issue sorted, you can check every weather element one by one and asses will the visual range is decent or not (Pic. 12 – 15).
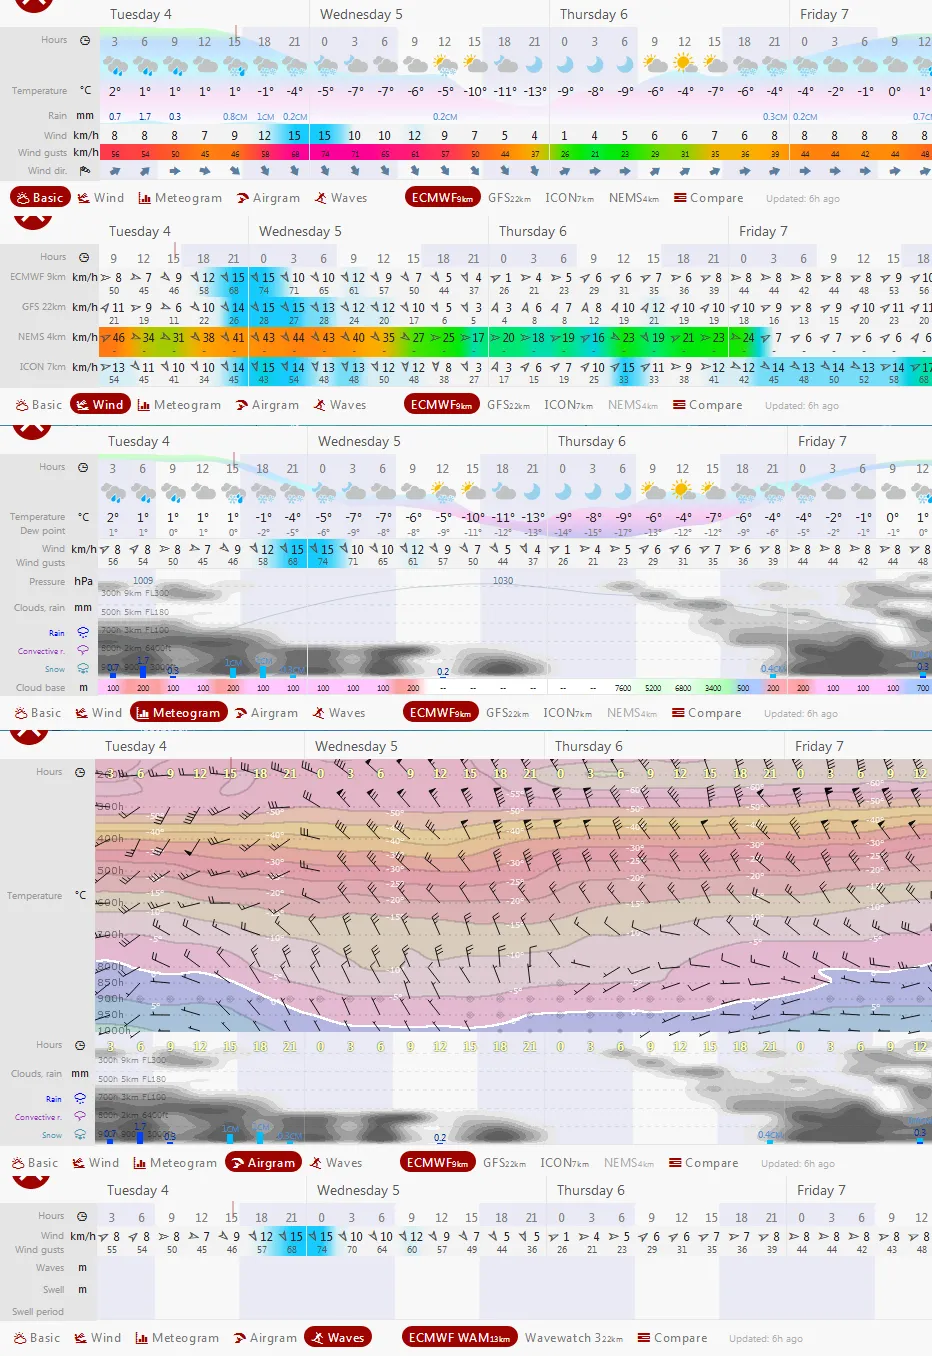
Pic. 13 A detailed weather forecast provided by Windy.com (for single sections) up to 5 days ahead.
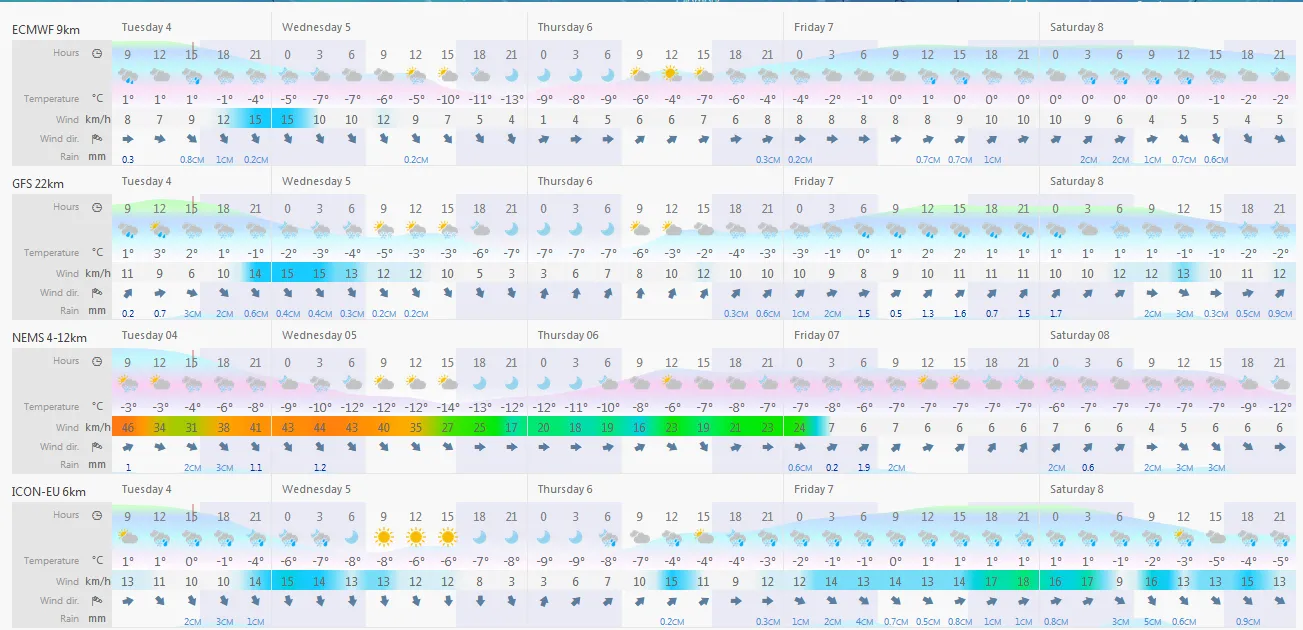
Pic. 14 Numerical weather forecast comparison on Windy.com interactive weather platform.

Pic. 15 A distance measurement option on the Windy.com platform.

Pic. 16, 17 Settings on the Windy.com platform, located at the top left side of the screen. Some of them are available after creating the account.
Okay, now we can analyze some weather elements separately on a rough example. I would like to check if Tatra Mts is possible to see from Bieszczady Mts or not (Pic. 18)? The distance is 170km. First, that comes to mind is checking the “Visibility” forecast, which unfortunately doesn’t play a key role here, because the scale is only up to 17-20km. When a visual range is longer than 20km, then everything is marked as good. The legend (scale) you will find at the bottom right corner of the screen.
Humidity presents better because our line of sight is a considerable area where value drops to about 50%. However, the most important parts of our path (where the highest mountains are located) feature a higher humidity level, reaching about 80% in places. The not favorable situation is provided also by cloudiness, where low-based clouds cover about 50 to 70% sky on our path. In this event, we can be sure, that the Tatra Mts won’t be visible at this moment. If you want, you can check other weather elements, such as dew point or dust forecast.
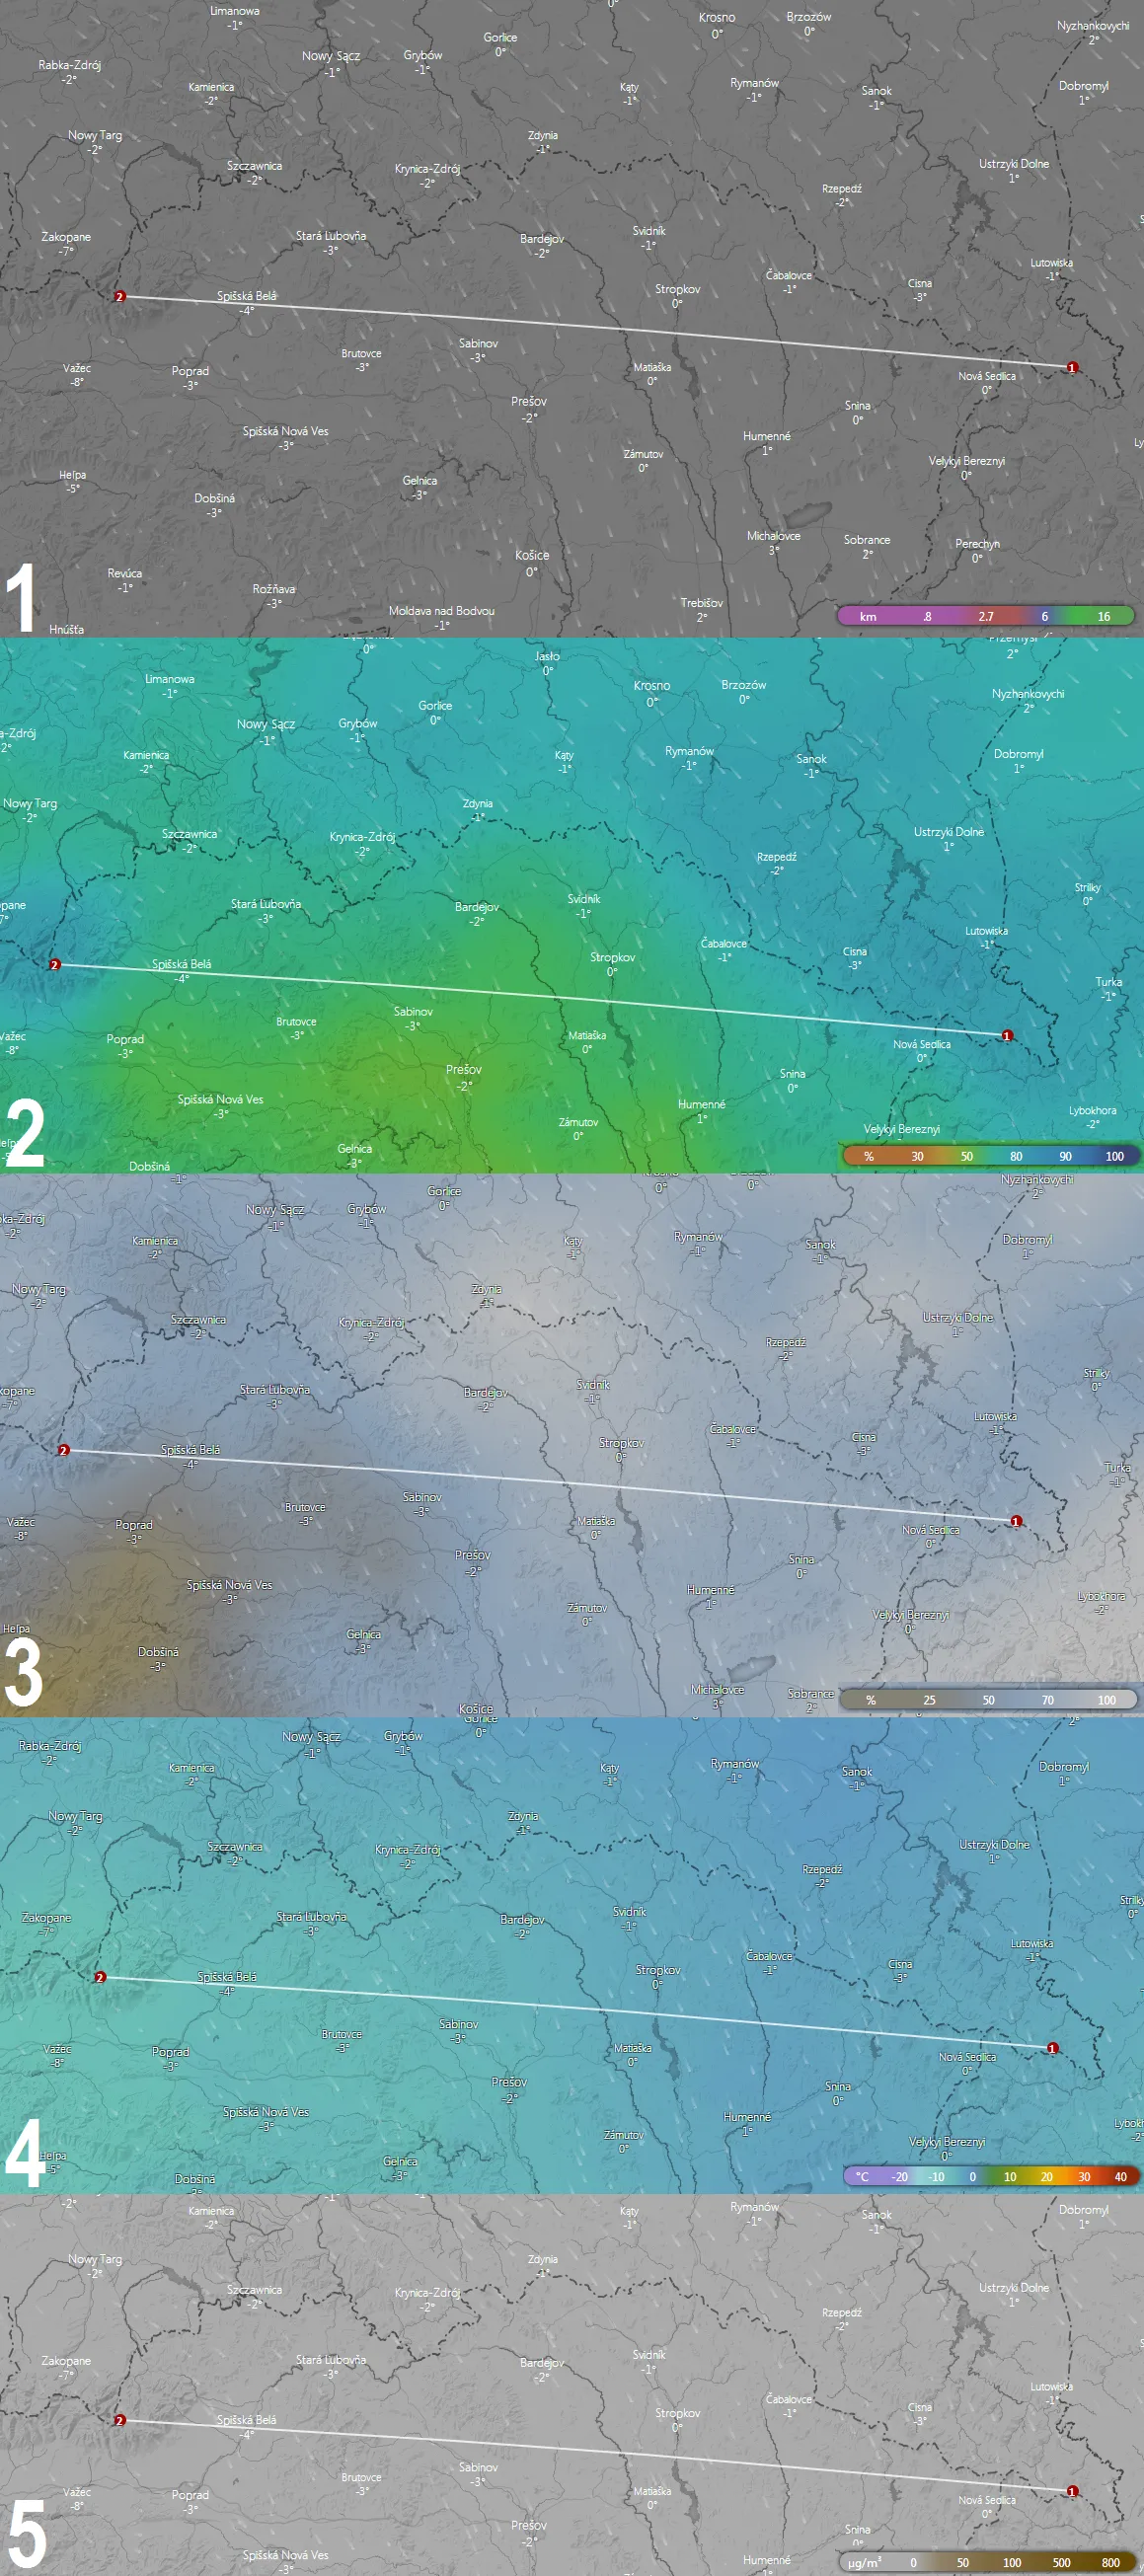
Pic. 18 Some weather conditions comparison in terms of asses the visual range, where: 1 – Visibility forecast; 2 – Humidity forecast; 3 – Low cloud base forecast; 4 – Dew point forecast; 5 – Dust concentration forecast.
Looking at the very bottom of the screen you have got a timescale, where you can set another day ahead from now. Obviously, the weather prediction there is only an assumption, however, feel free to plan your observations up to 3 days ahead!
Atmospheric sounding describes a plot of the vertical profile of temperature, dew point, and often the winds above a fixed location. Sounding is used in severe weather forecasting and also in determining a local temperature inversion and measuring the strength of capping inversion (Pic. 19).
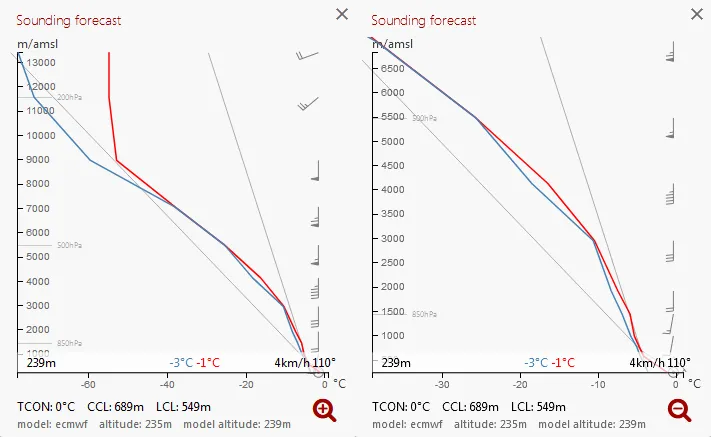
Pic. 19 Atmosphere sounding forecast for Rzeszów, provided by Windy.com. You can also zoom in (right image) and get details for the lower part of the atmosphere.
Aside from the Windy.com platform, there are other weather forecast websites, where you can check both real-time and numerical weather forecasts from now to the forthcoming few days. I would like to show some of them, which can help you to plan long-distance observations.

Pic. 20 A meteogram on the Wxcharts.eu weather platform, where the humidity or visibility forecast is not provided. However, in a case like this, you can refer to the relation between a dew point temperature and air temperature in the red box. A green arrow shows potentially good moments to see distant objects from this place, located in Pyrenees Mts.
As I said above in many weather forecast platforms, i.e. Wxcharts.eu (Pic. 20) the humidity or visibility forecast is not provided (at least is not intuitive to find right after hitting the website), then you can look briefly at the relation between air and dew point temperature (Pic. 20). Once these 2 temperatures are quite far from each other, then can be a good time to see distant objects. Higher air temperature next to low dew point temperature means, that a humidity level is lower. Sometimes forecast maps include both dew point temperature and humidity values (Pic. 21).
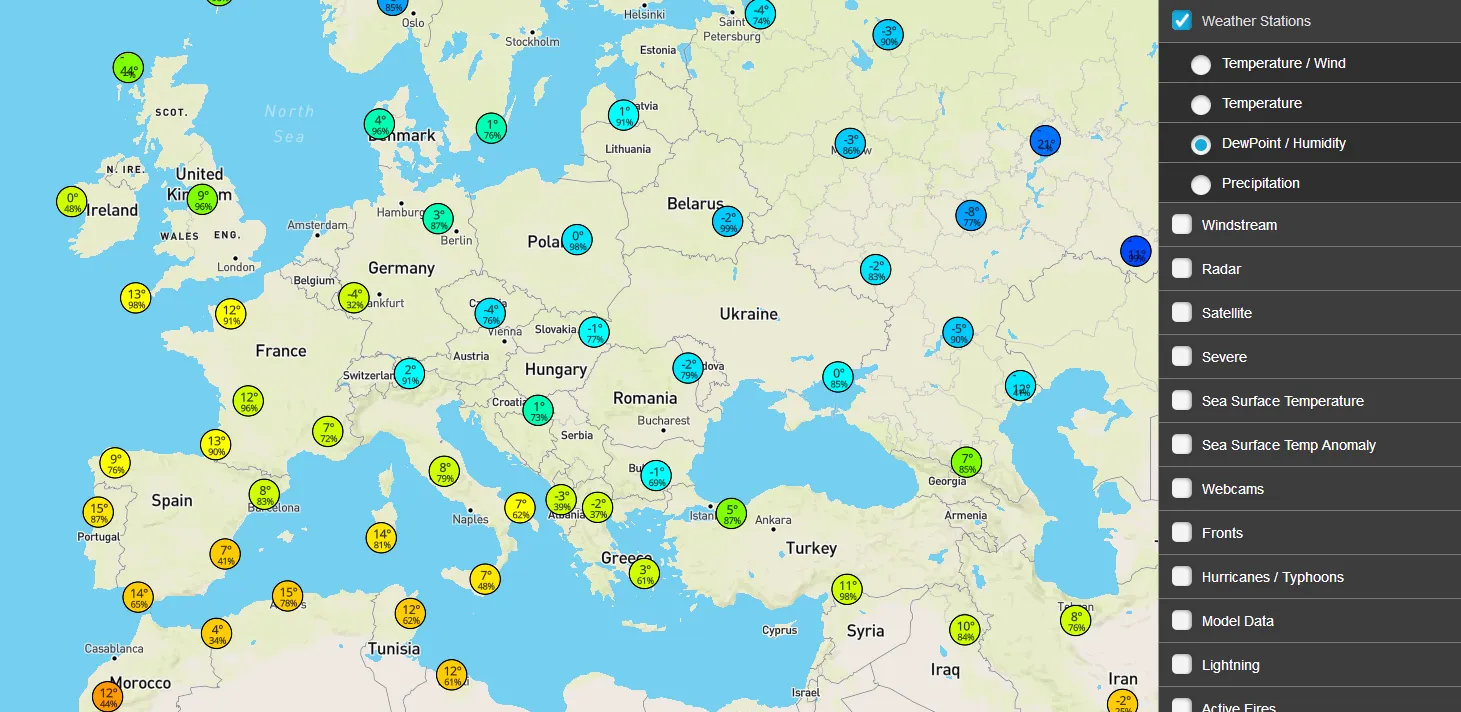
Pic. 21 The Wunderground.com forecast map with dew point temperature and humidity level across Europe.
It is good to look at the maps, like this above, because always we have insight both on our observation place and a distant object observed. If you would like to get more detailed information, then you should zoom in in this case or find an appropriate numerical weather forecast platform, which covers the area of your interests and provides a relevant map (Pic. 22).
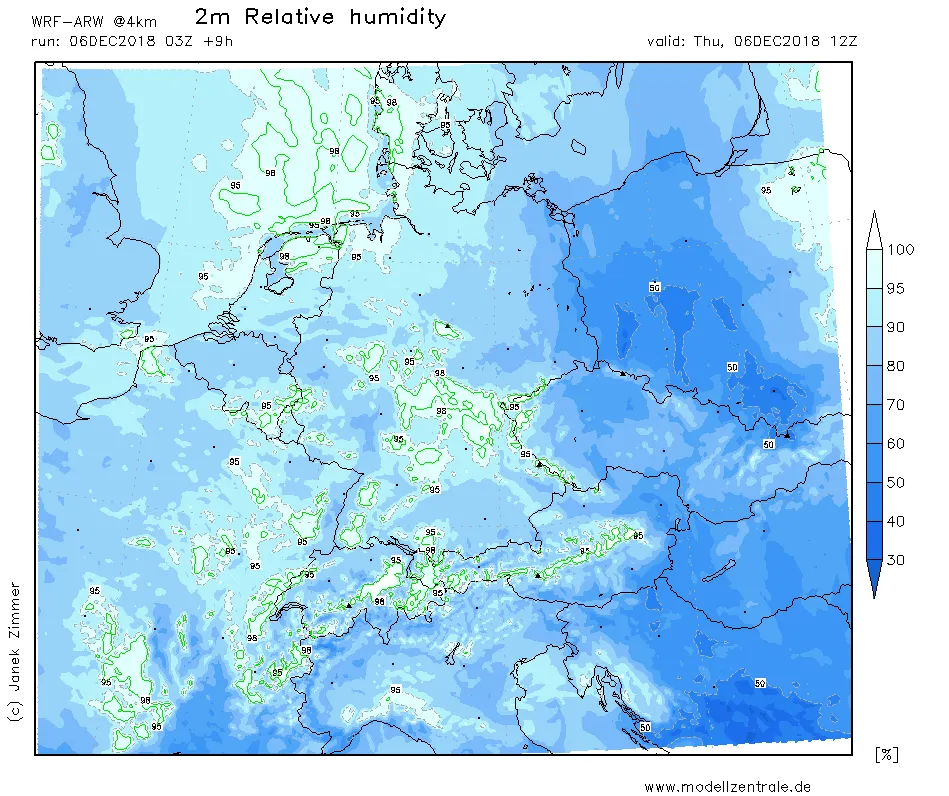
Pic. 22 A very detailed numerical weather forecast map, showing an estimated humidity level in western Europe (Modellzentrale.de)
Threading this way I wish I could show you every single weather forecast platform one by one, but it doesn’t make sense, because everyone can choose his own the best and most convenient weather forecast platform from the web or a full list available here.
Now I would like to focus a bit on weather meteorograms, from which you can easily read when the conditions with the best visibility occur.
One of the best numerical weather forecast platforms, where you can get a very detailed meteogram is Meteo.pl. This Polish numerical weather forecast platform covers mainly central Europe with some southern and northern bits of this continent. Below I have prepared a meteogram for San Marino, where a good visibility period is going to occur at 9.12 (Pic. 23), which has been framed in a black rectangle.
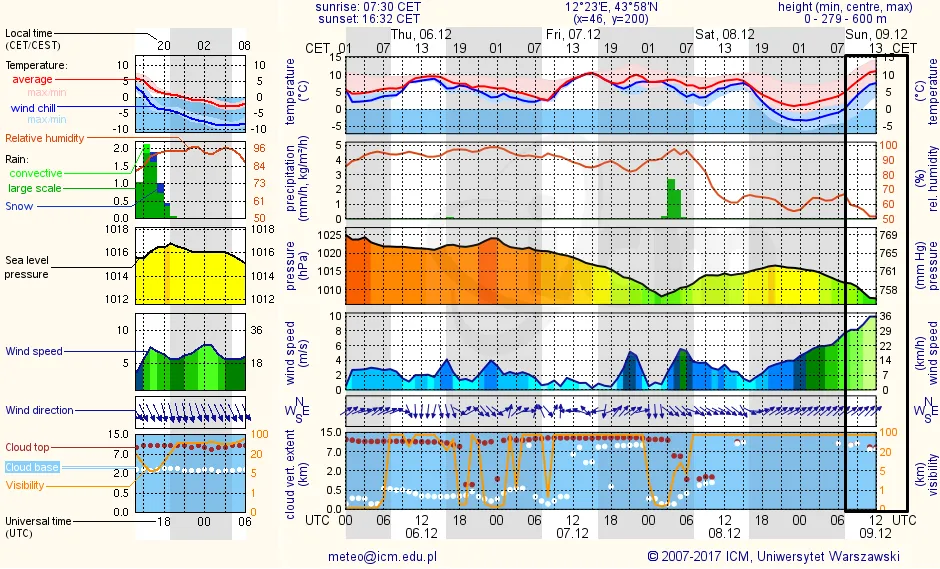
Pic. 23 A meteogram for San Marino, where a predicted period of good visibility has been framed in a black rectangle. You can see, that the humidity level is going to drop down to 50% with temperature and wind speed rising (Meteo.pl).
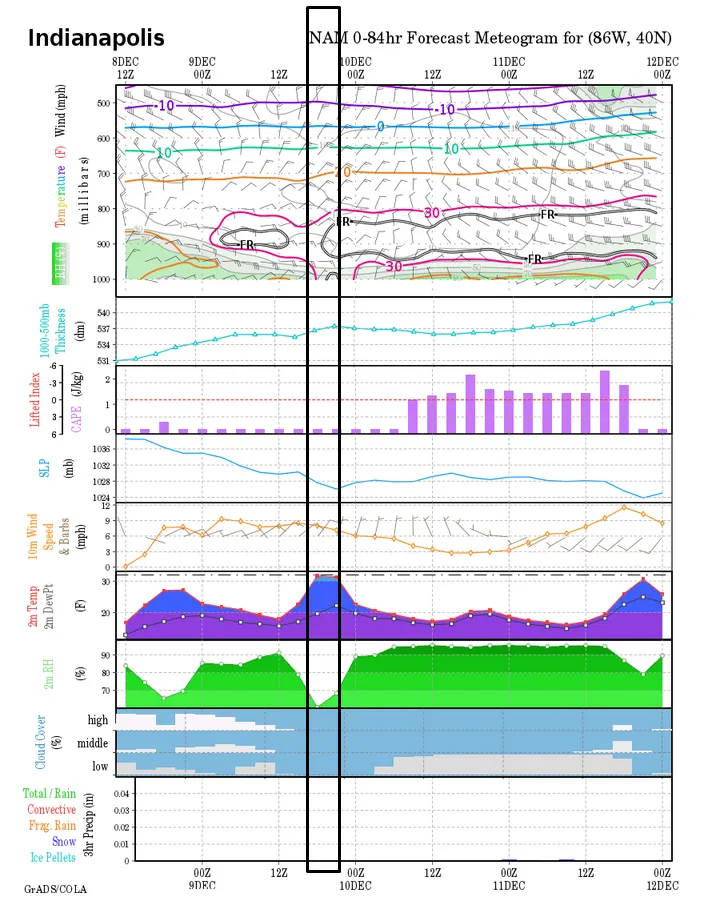
Pic. 24 A meteogram for Indianapolis with the best visibility conditions framed by the black rectangle (Weather.gov).
Looking at these 2 example meteorograms above, you can notice, that the periods with possibly good visibility tend to be quite short. In this event, we can say about a moment, instead of a particular day. When weather is dynamic, good visibility can last even only a few hours, and as it is worse it may not cover both an observation site and a distant mountain at once.
The main problem is, that these meteorograms provided on various weather forecast services are not equal to each other and often present different data. The examples shown above are one of the most detailed, we can find on the web. Unfortunately, most of the services provide a reduced forecast version with some weather elements (like humidity or dew point) not shown. However, there is one universal website, where you will able to get a decent weather meteogram after clicking on the map. An example from this website is presented below (Pic. 25). This is the weather meteogram for Cambridge with the best visibility conditions (for the time being) framed with a black rectangle.
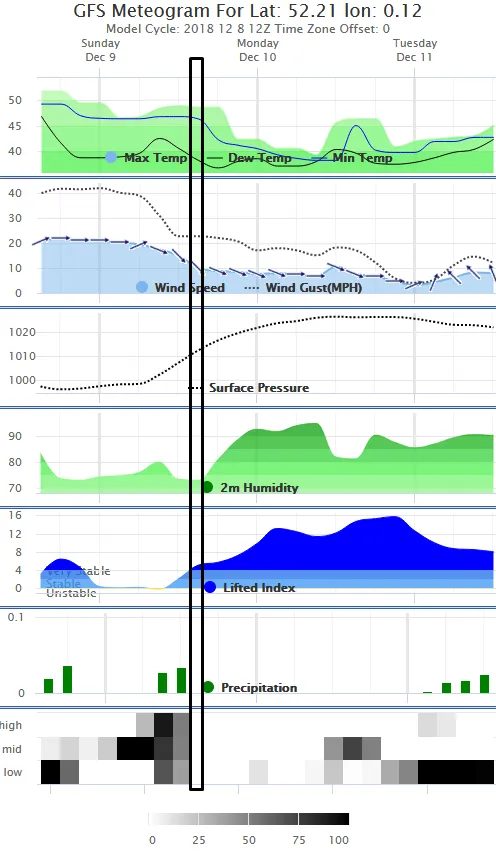
Pic. 25 A GFS meteogram for Cambridge, the UK where the best visibility conditions within the forthcoming 3 days occur on Monday morning. Despite poor visual range conditions (relative humidity of more than 70%), there are still the best conditions for this 3-day forecast period (Meteogram.com).
Unlike weather maps, meteorograms present a weather forecast for one place only, which is their main drawback in terms of long-distance observations. In this case, it’s good to generate a meteogram at least for 2 places: your observation site and a distant object observed. I wrote at least, because sometimes weather pattern changes alongside the line of sight, as you could see above (Pic. 18).
In the end, I would like to show you another interesting weather server, which is the SpotWx. This platform provides also location-specific graphical weather forecasts, taken from various numerical models. There are important elements in the horizontal visibility point of view, like humidity or ventilation. An example of the SpotWx forecast you can see below (Pic. 26).
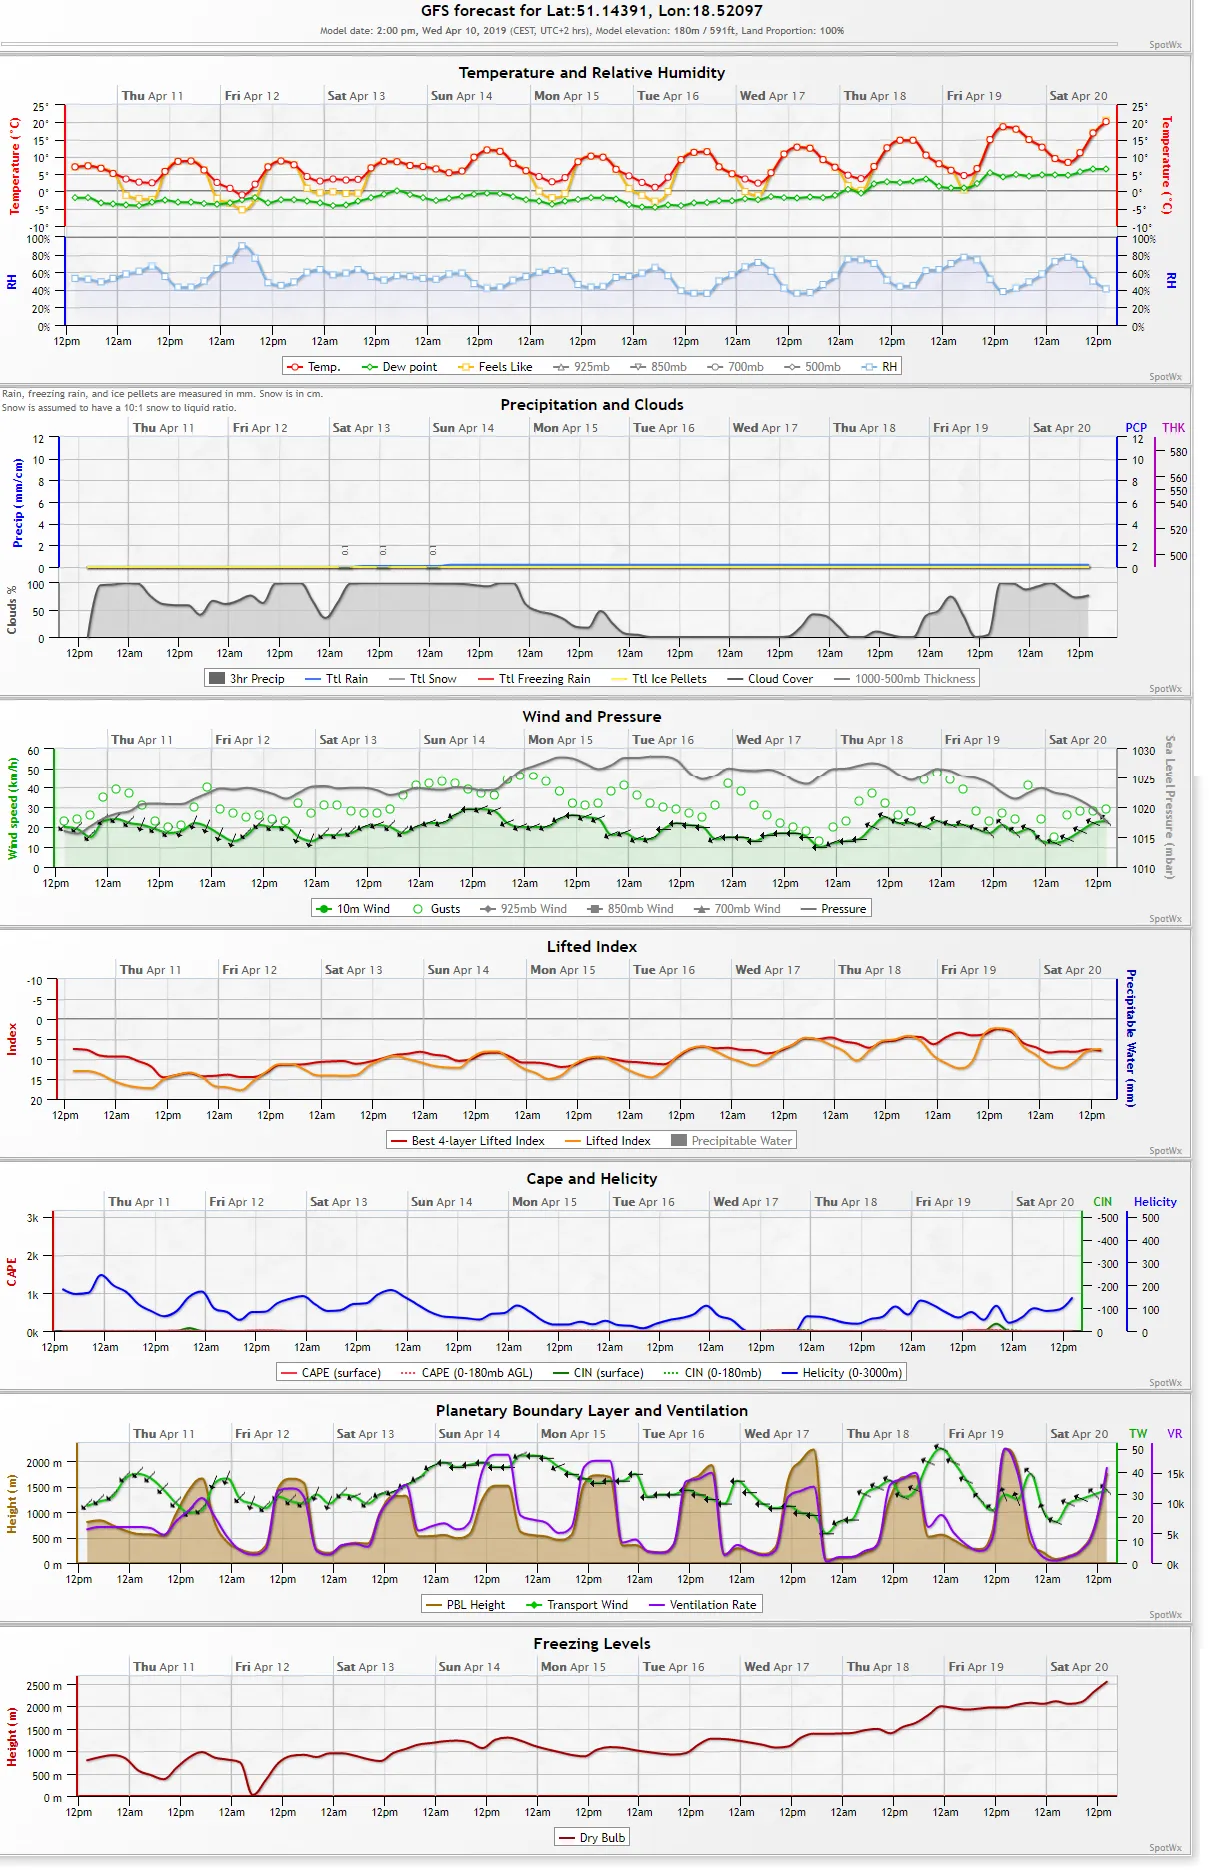
Pic. 26 Spotwx.com graphical weather forecast for Warsaw (Poland).
Concluding this section, the best weather forecast service to check visibility conditions is Windy.com. You can also use Spotwx.com or Meteogram.com if you are interested in visual range conditions in any place around the world. Other weather forecast websites are rather confined to their main areas, like central Europe, the USA, etc., where they will be more useful.
4. CONCLUSIONS
This 2-section article has shown what is horizontal visibility and the atmospheric conditions, that are associated with it. The most important is the weather factor, which basically decides about good visibility or not. This weather factor consists of the kind of air masses and dynamics (wind, pressure areas) and finally the haze concentration. Other elements play rather a minor role. Knowing the Earth’s troposphere as a very dynamic layer I cannot assure in 100%, that all meteorological elements described above and earlier will perfectly indicate the moment with the best horizontal visibility. There is no rule for it, however, this information can help. On top of that, as a conclusion, I can list 10 major principles of better visibility conditions occurrence:
1. When the humidity level is lower, the visibility is better,
2. The visibility tends to be better behind a frontal band, which always brings a fresh air mass,
3. The clearest air mass is the Antarctic and Arctic,
4. The best moment to see a distant object is around 15-20 min after sunrise or before sunset when this object is located in the antisolar direction or at civil twilight when an object is located around solar azimuth.
5. The best moment to see a distant object occurs when a whole line of sight is shaded by clouds, but the sky at the horizon beyond remains clear, being strongly illuminated at once,
6. The atmosphere is always more transparent when looking up, even within the boundary layer,
7. Wind helps to clear the atmosphere from haze particles, making a visual range better,
8. Own light emission helps a distant object be visible during the night,
9. The best visible surface from the distance is ice or snow, only when illuminated by the Sun,
10. The best weather forecast platform to check visual range conditions is Windy.com
Visibility includes also psychophysical processes that indicate a human ability to perceive an object through the contrast threshold given by the human eye. It is important to recognize and appreciate the form, contrast detail, and color of near and distant features. Horizontal visibility is not only being able to see a black object at a distance for which the contrast reaches a threshold value. It is important to how many details can we spot watching the distant object. I mean the color of the mountain (vegetation, snow cover, shadows cast by overhead clouds), geological features, and degree of urban or industrial infrastructure).
Mariusz Krukar
References:
- Abdusalam G.A., 2012, Effect of clear atmospheric turbulence on quality of free space optical communication in western Asia, (in:) Optical Communication Systems
- Bohren C.F., Clothiaux E.E., 2006, Fundamentals of atmospheric radiation: An introduction with 400 problems, John Wiley & Sons, Weinheim
- Penndorf R., 1957, Tables of the refractive index for standard air and the Rayleigh scattering coefficient for the spectral region between 02-20u and their application to atmospheric optics, (in:) Journal Optical Society of America, vol.47, p.176 – 182
- Schober H.A.W., Hilz R., 1965, Contrast sensitivity of the human eye for square-vawe gratings, (in:) Journal of Optical Society of America, vol. 55, i. 9, p.1086-1091
- Schuster G.L., Dubovik O., Holben N., 2006, Angstrom exponent and bimodal aerosol size distribution, (in:) Geophysic Research, p.111
- Vollmer M., Shaw J.A., 2018, Extended visual range during solar eclipses, (in:) Applied Optics, vol. 57, no. 12, p.3250 – 3259
Links:
- Antisotropic scattering in spherical geometry
- Earthobservatory.nasa.gov: Aerosol optical depth
- Calculation of aerosol optical thickness
- Angstrom coefficient calculation
- Researchgate.net: A different scattering coefficients
- Analyzing the long-distance observation conditions – an example (Polish)
- Atmosphere sounding – what for?
- ESA: Sounding of the atmosphere
- University of Wyoming – Atmosphere sounding forecast around the world
- A list of weather forecast websites from around the world
- How to read a meteogram?
- http://www.meteogram.com/
- https://www.windy.com
- https://spotwx.com/
Wiki: