Preparing simple custom grid in QGIS print composer
Print composer in QGIS gives us the possibility of creating printable maps and atlases, which can be saved as the .pdf or .svg. The print composer provides a wide spectrum of options by adding various elements and components to our maps. Next, we can resize, align, and rotate each other as we need to. As a result, we receive a powerful way to publicize our geographical information produced with QGIS, which can be included in reports, publications, etc.
Undeniably the most important element in the QGIS print composer is our map, but we also should bear in mind the most important components of this map. One of them is the coordinate grids. Coordinates are a set of values identifying each of a set of places on our map. When they are displayed as the grid, they can in some cases also act as the map scale, but predominantly their role is to locate the object on our map. This role is much bigger when instead of map units (derived from CRS) we decide to set up metric units combined with custom labeling. This is roughly the type of coordinates, which I would like to discuss here. It will be simple, without programming involvement.
The explanations of how to draw and set up map grids in the QGIS printing layout can be found in the links and videos attached at the very end. I will start with the existing map grids.
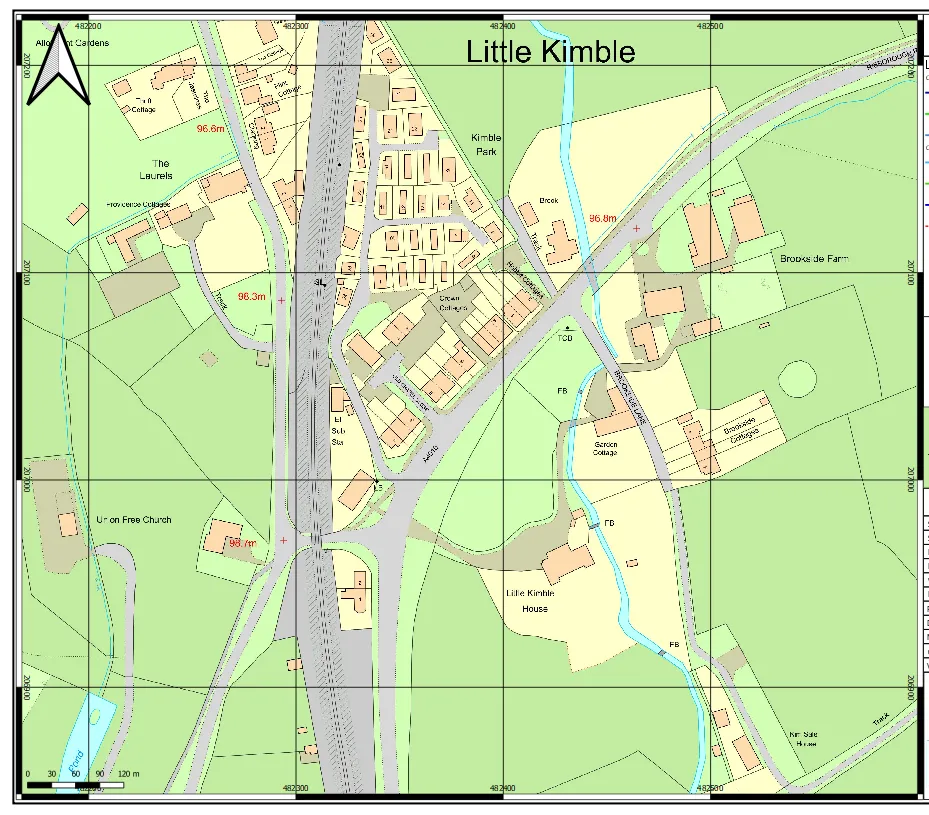
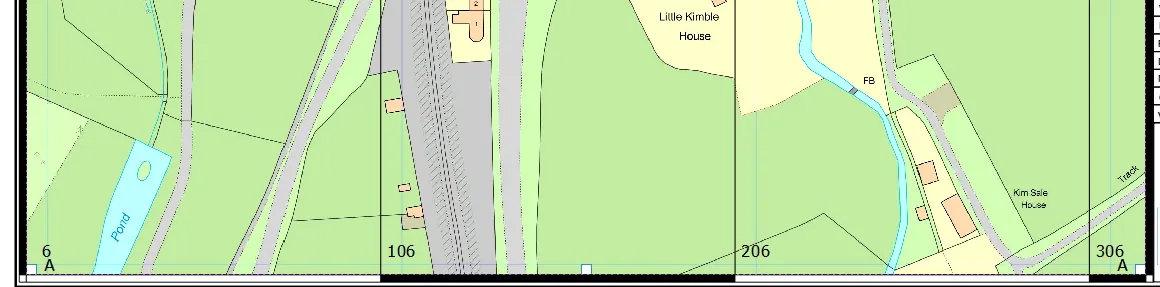
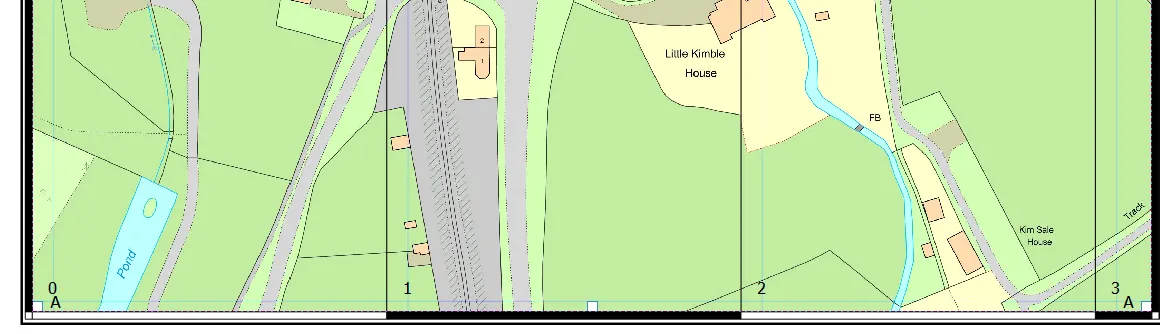
Pic. 1 Generated map with default coordinates in QGIS print layout. The coordinates are based on the OSGB 36 coordinate system widely used for the Ordnance Survey topographic maps in the UK.
Looking at the map above we can spot an already existing coordinate grid, which is based on the EPSG:27700 CRS system corresponding to the British National Grid. Moreover, the labels overlay grids, which is not the best practice. The goal of this article is to turn these coordinate grids into custom with offset labeling.
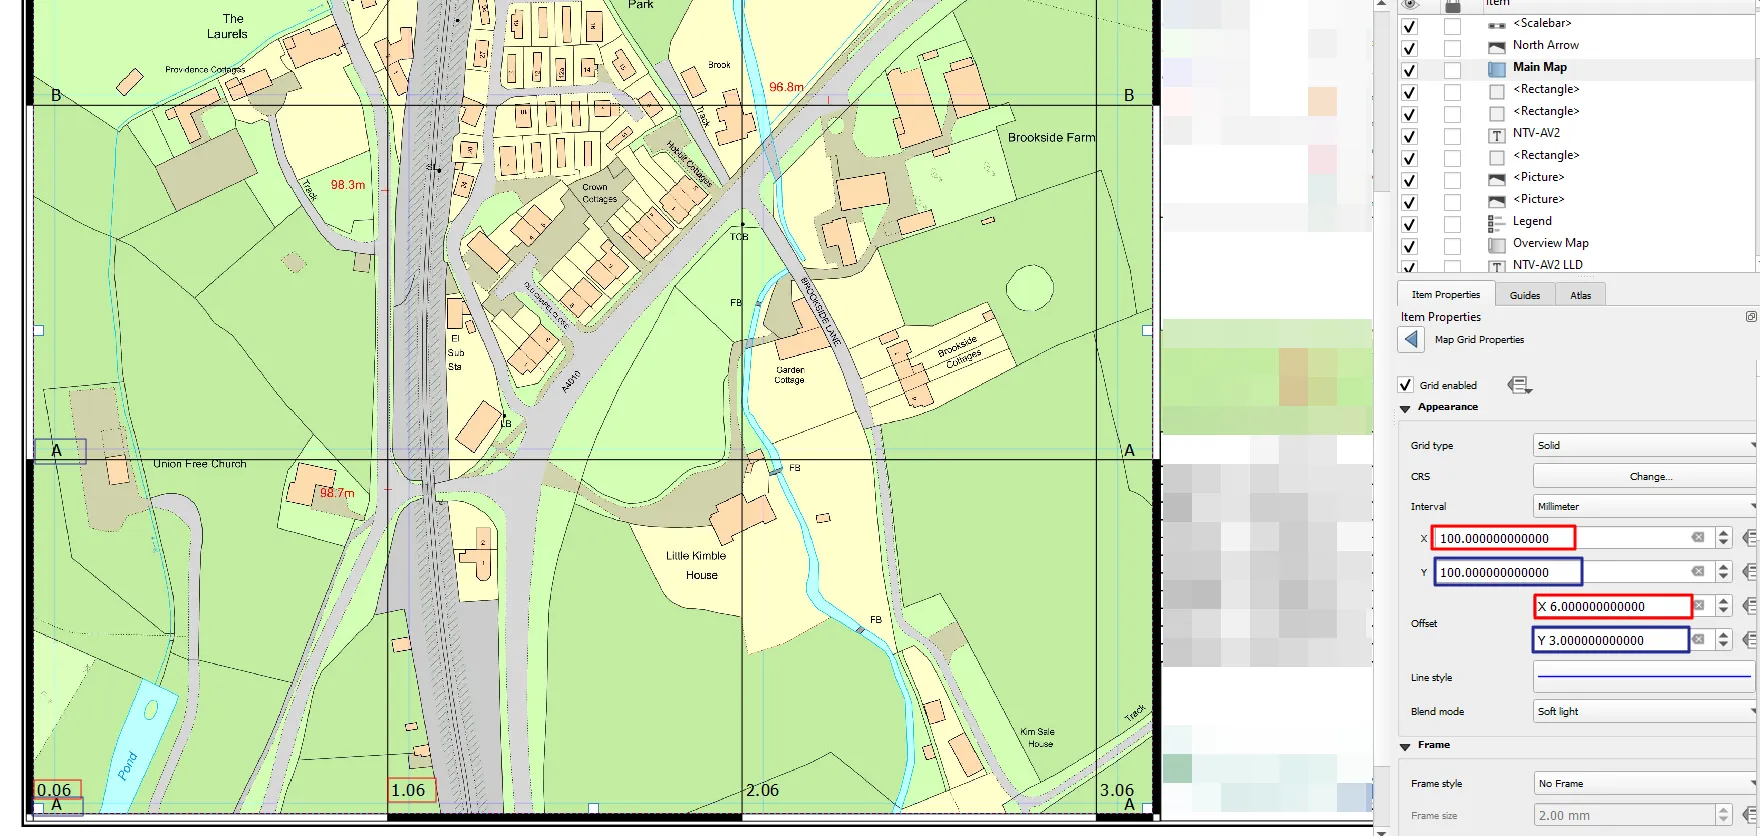
1. Firstly, we should select our map from the Items panel on our right. Afterward in the “Item properties” panel below, we must find the “Grids” section with the “List of grids” available. Any grid available there can be modified (Pic. 2).

Pic. 2 Finding the map grids in QGIS Print Composer amidst other items.
2. When you click “Modify Grid” you should see other sections expanded. The most important by now is the very first one – “Appearance“, which defines both the grid intervals and their offset. Here is also the place to change the CRS of our map grids, but we don’t need to do it. We just have to define the interval unit and value (Pic. 3).
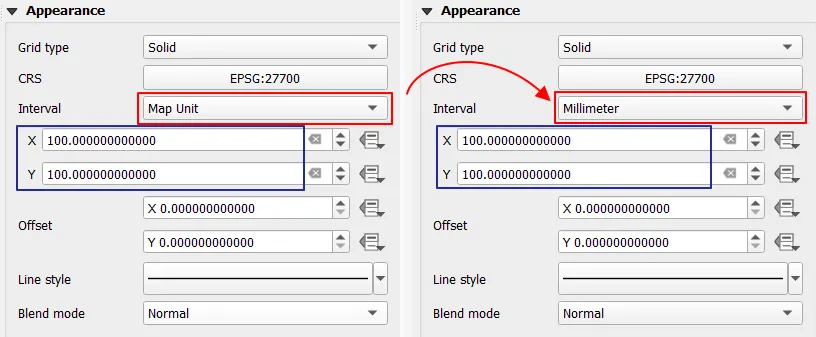
Pic. 3 Changing grid interval options in the QGIS print composer. For the purpose of custom grid layout, we have to resign from “Map units” reliant on the CRS and choose metric units expressed in millimeters or centimeters, adequate to the real map size proposed in the “Page size” section.
Changing the grid units from map units to metric units must be thought over with respect to the real map dimensions. They can be set i.e. by right-clicking on the map. Since you have chosen the A3 paper size, you can have max. 420mm in width and 297mm in height. When you reserve some space for other elements like a legend, etc., this space will be even smaller (Pic. 5). There is no point in setting cm units with 100 intervals then. Instead of it you can select mm units and keep 100 intervals or 10 intervals for centimeters. For the comparison, I used the A2 paper size, where an interval of 100 millimeters has been applied (Pic. 4).
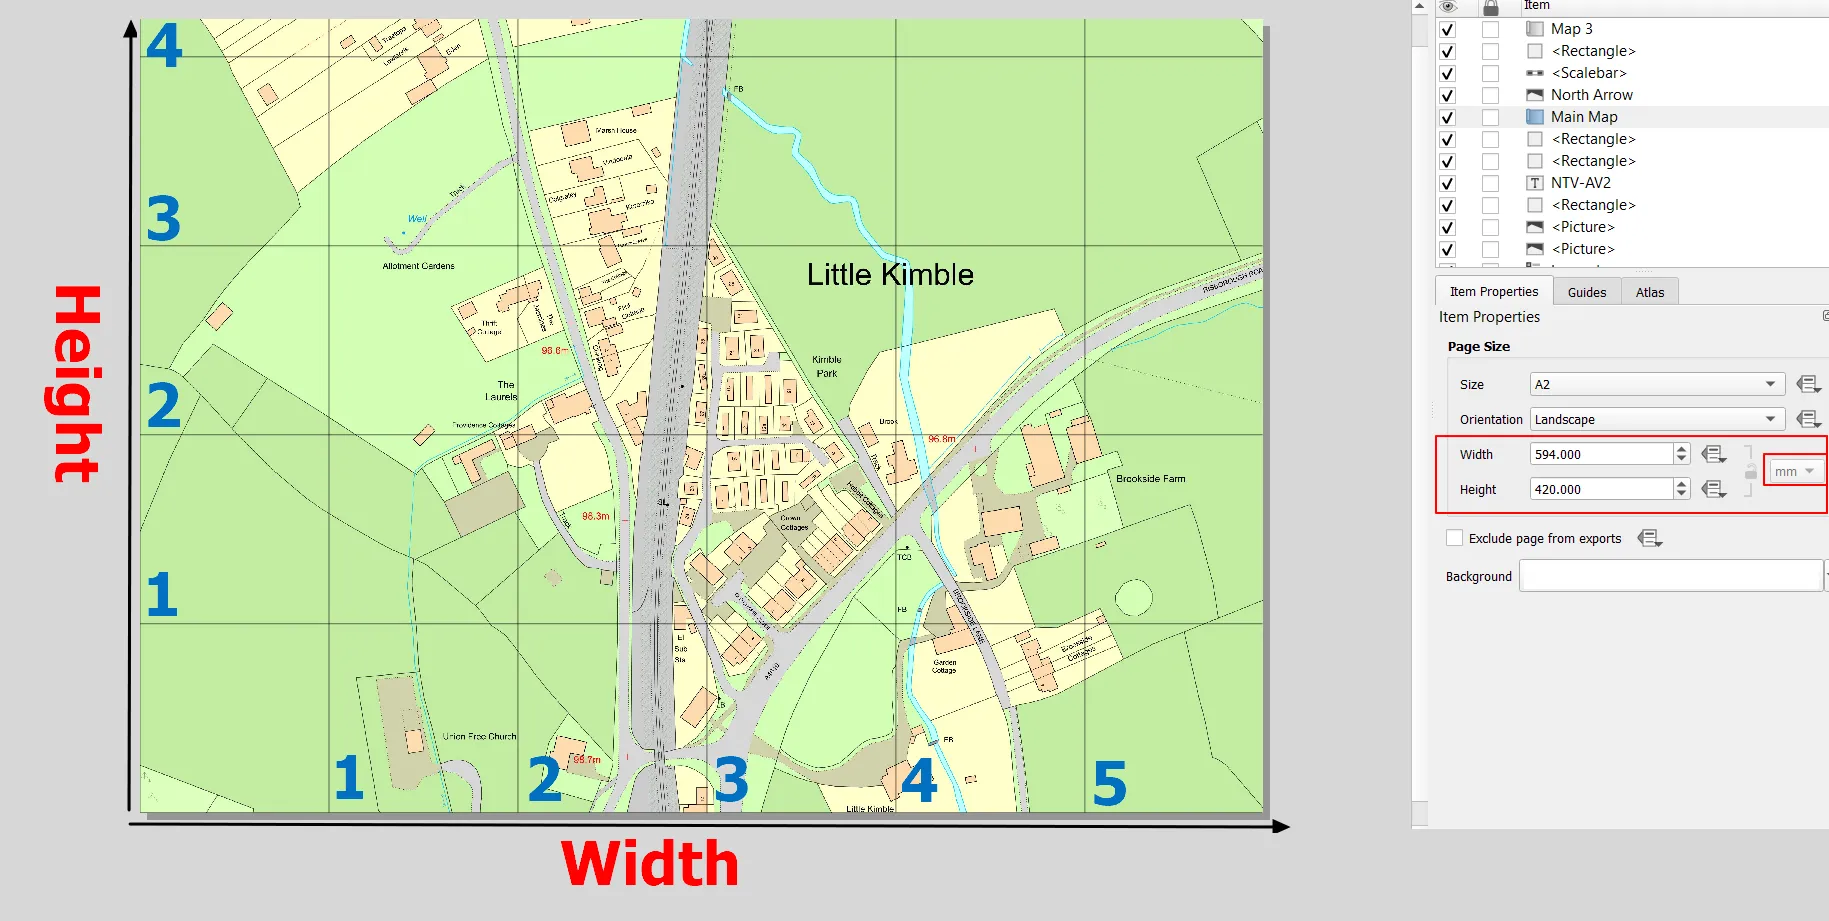
Pic. 4 The interval of 100 millimeters applied for the grid deployment on the A2 map and explanation. Since the width is 594mm, you can get as many as 6 boxes with intervals of 100. The same applies to height. Height value corresponds to the Y-axis and Width value corresponds to the X-axis.
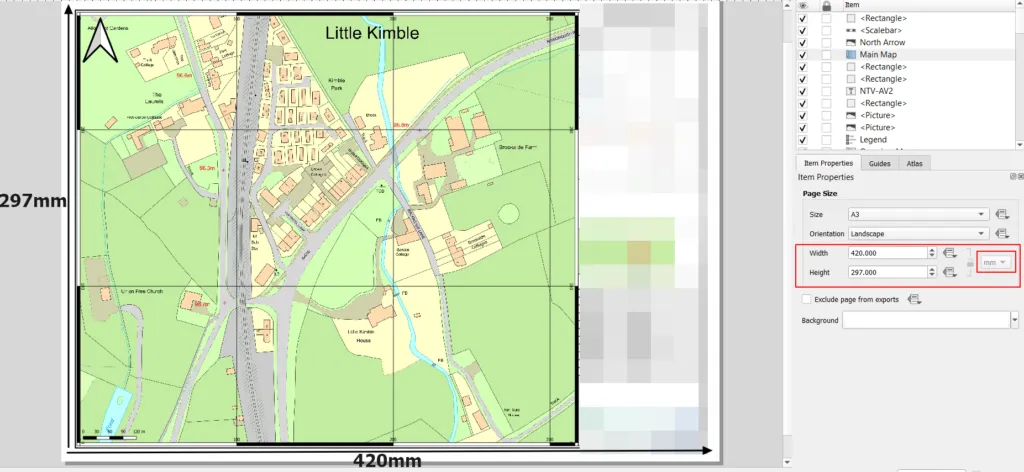
Pic. 5 The map is composed of the A3 paper size with space reduced by legend and other elements.
In the situation above, an appropriate will be to apply 100mm intervals or 10cm intervals for receiving the same number of grid boxes.
3. Browse your “Map Grid Properties” panel down until you reach the “Draw Coordinates” section. It’s switched on, as you can see labels overlaid on the girds. We should turn them off and keep just grids (Pic. 6).
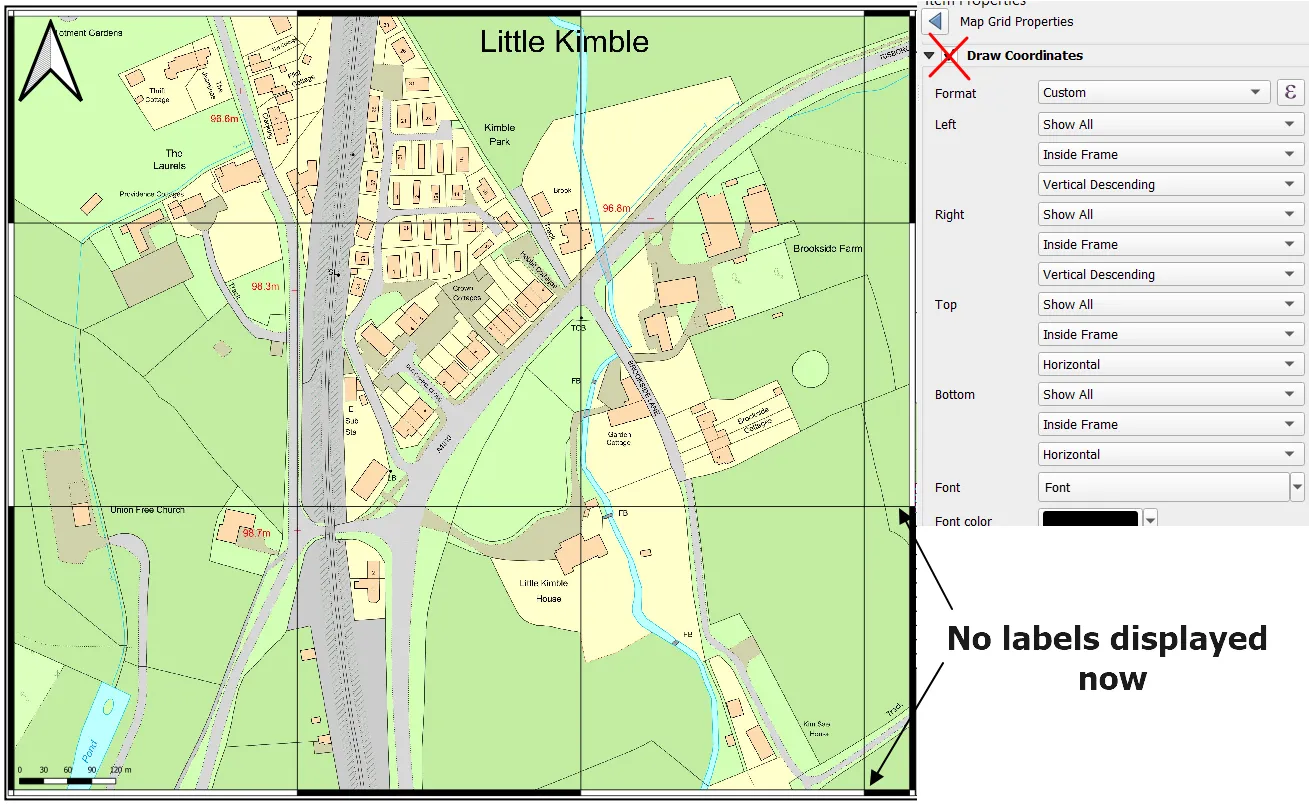
Pic. 6 The way of switching off the labels and leaving just a coordinate grid in the QGIS print layout.
4. Create the new grid layer and preferably change the name of both (Pic. 7). Since now we will have one grid layer for the grid display and another one will be prepared for the labels only. Our job starts to make sense now and vice versa!

Pic. 7 Creating the new grid for our map with optional change naming of both.
5. Now, we will focus on our new grid, which will be dedicated to the labels only. However, our prerequisite should be displaying the grids as default before we define the interval, and what is the most important here – the offset. For the sake of simplification, we can change the grid color in order to distinguish it from the 1st grid set. Next, we should define the same interval features as we did for our first grid. The default interval will be the “Map Unit“, therefore these two grids will be separate from each other. By changing the interval to “Millimeter” like we did for our first grid, and setting the value 100 both for X and Y the second grid will be exactly overlapped with the first one. In order to get an interesting effect, we should use the “Offset” feature and set it up both for X and Y values. For millimeter units, changing these values to 6 or 7 should give a satisfactory effect for us. The second grid is offset properly (Pic. 8), thereby can be used for displaying the labels, which you can see already in the middle of the 2nd grid provided.
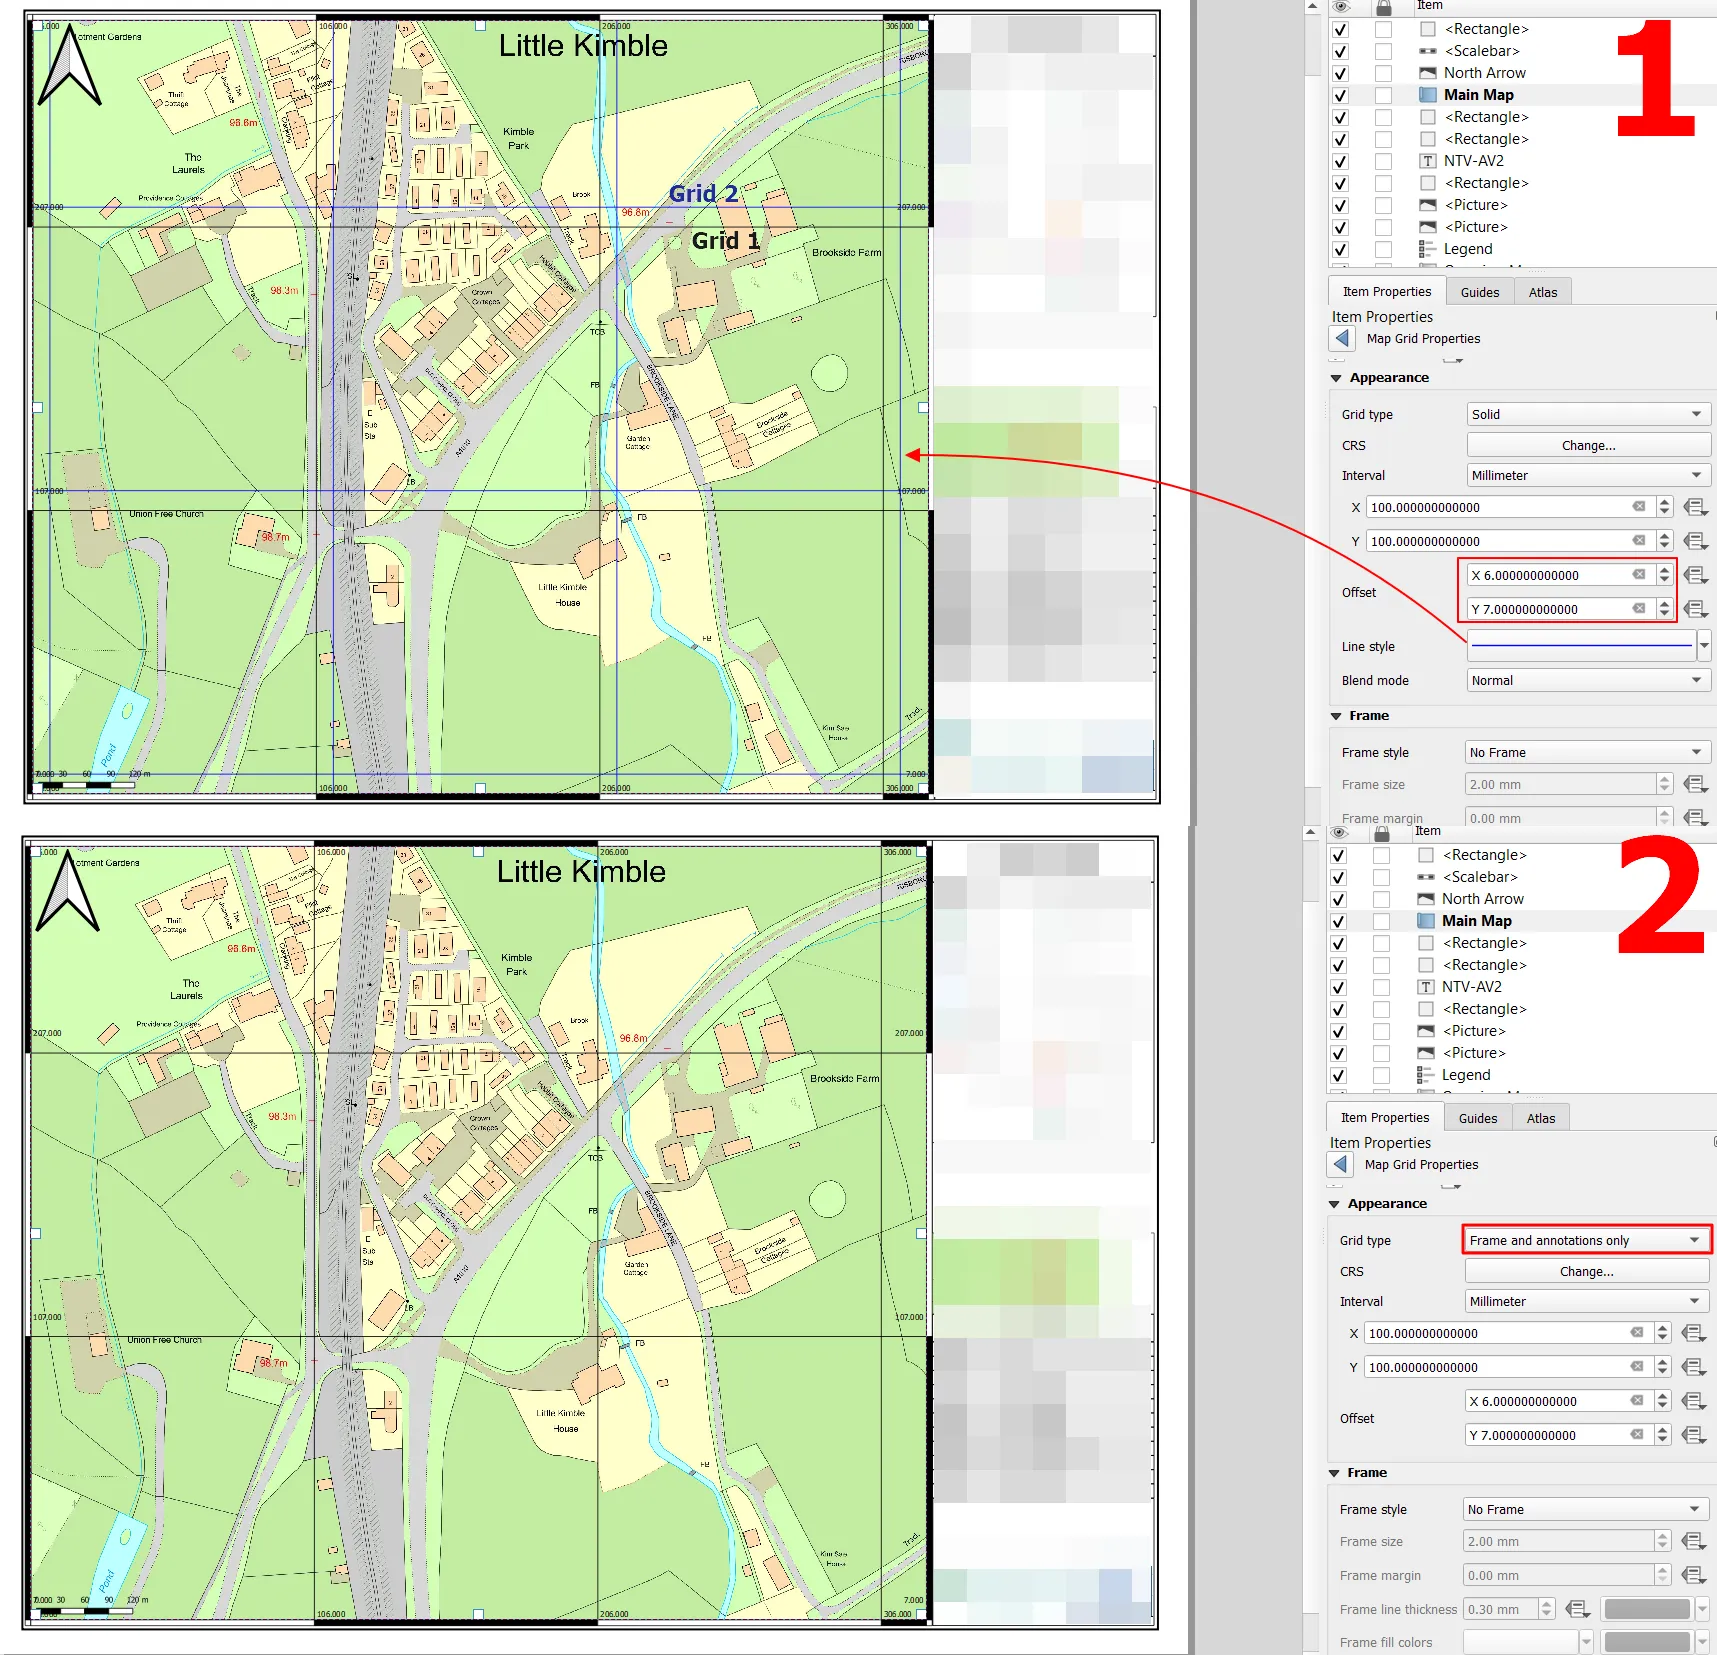
Pic. 8 Setting new grid in QGIS print layout map in order to use it for label display.
Since we are fine with the position of the 2nd grid, we should change the “Grid type” from “Solid” to “Frame and annotations only“. It will switch the grid off and keep labels only (Pic. 8, 2).
These labels remain not correct, as they show the millimeter units rather than custom values.
6. This is the time for playing with the label formula in order to make them customized for our own purposes.
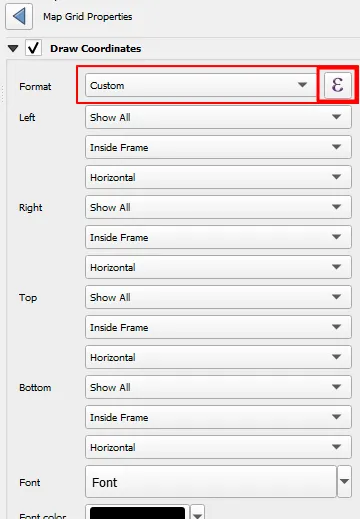
Pic. 8 The “Draw Coordinates” properties in QGIS print layout, where we can define the position of our labels as well as their format.
By the way, we can set their position in this section by placing them inside or outside the frame, etc. For the custom setting purpose, it’s essential to change the format from “Decimal” as the default to “Custom” as presented in the image next to (Pic. 8).
Toggling the “Format” type only to “Custom” means nothing itself unless we hit the Ε symbol bounded red. This is the place, where the Expression Based Annotation window opens with all formulas available in our QGIS software.
Our initial formula could look like the below:
CASE
WHEN @grid_axis = 'y'
THEN substr('ABCDEFGHIJKLMNOPQRST', (@grid_number) / 100 , 1)
WHEN @grid_axis = 'x'
THEN (@grid_number) / 100
END
which would give the result like in the image below:
Pic. 10 Our initial custom labeling was a result of the formula provided.
with strict attention to the interval rate and offset. Namely, both numbers determine the value of the label appearing on our map. By analyzing our formula we should take a look at the key values there:
– for the Y-axis we use the substr function, which assigns the letter to our value, thereby the @grid_number = 1 corresponds to the “A” letter. In turn, the number 1 at the very end…
THEN substr('ABCDEFGHIJKLMNOPQRST', (@grid_number) / 100 , 1)
…determines the total amount of letters to be displayed. By putting number 2 there we will have “AB” instead of “A” and so on.
– for the X axis we have simply the @grid_number divided by 100 because we set the “Interval” value 100 for the X (Pic. 10). As you surely noticed, the same equation has been applied for the Y axis.
Concluding the interval value defined in the “Map Grid Properties” must collaborate with the value of the @grid_number. Imagine, that you will keep the @grid_number value as 100 with the interval as 100. The result will be at least inappropriate because we will have to number every 100 instead of 1 (Pic. 11). This is because the grids are marked in every 100 as defined in the “Interval“.
Pic. 11 Wrong numerations of our grid labeling as a result of non-conformity between the @grid_number and interval value.
We have to always remember about proper equations and adjust the final @grid_number value to the value of our interval defined.
Pic. 12 Wrong numerations of our grid labeling with substr function included.
With the substr function, the situation looks different. With the same non-conformity as described above, we will receive just one letter (Pic. 12) and it won’t be “A“. The letter will be offset-based and might start from “C“, “D“, or “B” depending on what offset we defined. When you take a look at the symbols within the substr function you can count up to 20. It means, that the letters won’t appear when @grid_number exceeds 20. In our case, since the interval is set to 100 and the grid appears every 100 units (millimeter), we have letters just for 20 units. Finally, we can see the string label just in one place.
Let’s jump to the offset values, which also affect our label values here. We can sort it out in two ways.
The first way will simply deduct the offset value defined. When we set the offset value as 6, then our formula for the X-axis should look like this:
WHEN @grid_axis = 'x'
THEN ((@grid_number) - 6) /100
where we are reducing the @grid_number by 6 and subtracting by our Interval value.
The first way is to include everything within the round function, which will help us smartly get rid of all the decimals.
WHEN @grid_axis = 'x'
THEN round((@grid_number)/100,0)
Finally, we should be happy with our custom labeling for the X axis… (Pic. 13).
Pic. 13 Good numerations of our custom labeling – X-axis.
…but we should still sort the Y-axis problem out because the first symbol appears twice (Pic. 14).
Pic. 14 Wrong numeration Y-axis
This is because our @grid_number has been divided by 100 and provided something like “symbol 0” which is replaced by the “A” letter – the first defined in our string.
WHEN @grid_axis = 'y'
THEN substr('ABCDEFGHIJKLMNOPQRST', (@grid_number) /100 , 1)
In this case, we have to push (increase) our @grid_number value by 1 in order to supersede this “symbol 0” with the first string letter defined.
Essential will be alteration like below, which finally will make our custom grid fine(Pic. 15).
WHEN @grid_axis = 'y'
THEN substr('ABCDEFGHIJKLMNOPQRST', (@grid_number + 100) /100 , 1)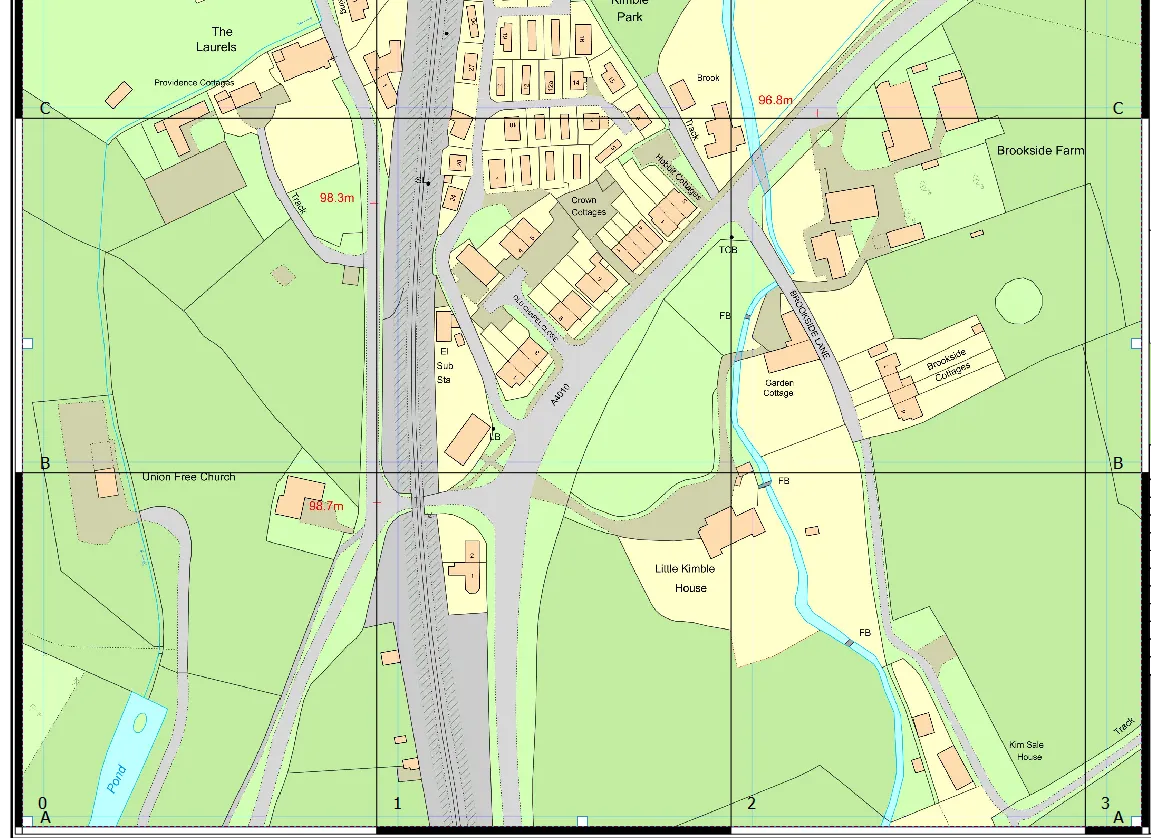
Pic. 15 Our custom grid looks good now.
If you don’t want to start from “0” at your X-axis, you can do the same for the first part of your formula:
WHEN @grid_axis = 'x'
THEN round((@grid_number + 100)/100,0)
The final formula for our custom grid should look as follows:
CASE
WHEN @grid_axis = 'y'
THEN substr('ABCDEFGHIJKLMNOPQRST', (@grid_number + 100) /100 , 1)
WHEN @grid_axis = 'x'
THEN round((@grid_number)/100,0)
END
or
CASE
WHEN @grid_axis = 'y'
THEN substr('ABCDEFGHIJKLMNOPQRST', (@grid_number + 100) /100 , 1)
WHEN @grid_axis = 'x'
THEN round((@grid_number + 100)/100,0)
END
and the final map including custom grids with offset labels will be also presented nicely(Pic. 16, 17)!
Pic. 16, 17 Final maps with custom grids in QGIS print layout: 16 – X-axis values starting from 0; 17 – X-axis values starting from 1.
Mariusz Krukar
Links:
- http://www.qgistutorials.com/fi_FI/docs/3/making_a_map.html
- https://kartoza.com/en/blog/create-a-custom-reference-grid-in-qgis-composer/
- https://kartoza.com/en/blog/create-a-custom-reference-grid-in-qgis-composer-part-2/
- https://blog.sourcepole.ch/2014/07/10/multiple-map-grids-in-the-qgis-print-composer/
- Wikimho.com: how to add grid coordinates in QGIS 2.12.0-Lyon in the print composer canvas?
- pCloud: Setting up the grid properties in QGIS print composer#
- https://docs.nextgis.ru/docs_ngqgis/source/map_composer.html (Russian)
- https://tr.azedupress.com/737729-excess-decimal-points-showing-on-BNMNXP-article (Turkish)
- https://kartoza.com/en/blog/data-defined-settings-for-grid-placements-in-qgis-312-ltr/
- https://geoafrikana.com/how-add-grids-and-grid-frame-map-qgis/
Forums:
- https://gis.stackexchange.com/questions/233431/qgis-print-composer-grid-draw-coordinates-line-offset
- Can anybody help explain how to remove the random decimal points on my grid? QGIS 3.8.1
- https://gis.stackexchange.com/questions/262497/how-to-change-page-size-in-qgis-composer
- https://www.quora.com/How-do-you-custom-format-a-coordinate-grid-using-QGIS
- https://gis.stackexchange.com/questions/213099/print-composer-draw-coordinates-in-right-format-and-language
- Github.com: Allow data-defined control over grid spacing and offset
- Github.com: Custom format for grid coordinates
- https://gis.stackexchange.com/questions/168057/drawing-coordinates-next-to-grid-crossings-in-qgis-map-composer
- https://gis.stackexchange.com/questions/167998/qgis-map-composer-has-wrong-coordinates
- Github.com: Grid lowest Y coordinate hidden in layout when set outside frame
- https://www.researchgate.net/post/How-to-draw-correct-coordinates-on-QGIS-38-map-composer
- Github.com/: Layout grid offset
- https://gis.stackexchange.com/questions/261254/creating-multiple-line-grid-frames-in-qgis-print-composer/261259
- Github.com: Changing grid options in print layout makes QGIS crash on subsequent project load
- https://gis.stackexchange.com/questions/344161/how-to-create-a-grid-with-customized-labels-in-qgis
- https://gis.stackexchange.com/questions/411438/no-feature-was-found-when-making-custom-grid-coordinate-format
- https://gis.stackexchange.com/questions/195293/how-to-create-a-custom-coordinate-grid-in-the-qgis-2-14-2
My questions:
- https://gis.stackexchange.com/questions/420778/qgis-custom-grid-in-printing-layout-not-working
- https://gis.stackexchange.com/questions/420965/qgis-custom-grid-overlapping-in-printing-layout
Youtube: