
The quickest way of making the speed limit map
Previously I explained to you how to make the speed limit in QGIS and display it in Google Maps. This process required drawing the new layer including the speed limit of the given road sections collected from the Waze.com map service. Admittedly this is not the quickest way of getting a map such as this, although it gives you full control of the streets in your considered area. In practice, it means, that if at some point the road hasn’t been marked on the map yet, which is typical for quickly developing urban areas, it can be added (drawn) by yourself. On the other hand, the method can be useful in the case of omission of the large dataset, which could make your computer freeze or simply in a situation when you don’t need to cover so much large area.
Now it’s time for the presentation of slightly another approach to preparing the speed limit map and not necessarily in QGIS only, although the method will be still based on this open-source GIS software. The primary thing here is, that the map can be done even within…5 minutes. Maybe let’s not exaggerate and give yourself about twice more, however, everything will depend on your expectations. Let’s plunge into it!
For clarity, the OpenStreetMap dataset will be used here, which can be imported from this map server in different ways. The OpenStreetMap offers large raw GIS data for any location you need. The dataset is maintained by several hundred thousand contributors around the world.
With reference to these several ways of extracting the OpenStreetMap data mentioned above, I would like to just skip across them, because only one approach is considered in the frame of this text. Without further ado, when you are interested in just a small area independent from any administrative borders, you can choose the Export from the OpenStreetMap panel. For larger areas, we can use the BBike extract platform, but if you need them bounded within some administrative boundaries, then the Geofabrik.de service will be the best. This is our task, for now, however, it’s worth knowing that there is also a larger OpenStreetMap dataset than offered by Geofabrik.de. It’s the Planet OpenStreetMap service, about which I will write you in the future. Another option can be utilizing the OSM plugin for QGIS, Osmosis, and Multi-stream OSM data downloader. This is still not everything, that could let us get the stuff from OpenStreetMap because we can do it with the SUMO network file or OSM Extract.
The key thing is based on the maxspeed tag, used for roads and waterways in OpenStreetMap, which defines the maximum speed of the given road. We can add to the query result
The Geofabrik.de is the download server for the OpenStreetMap datasets, which is supposed to encourage societies to share their innovations and potential ideas. Moreover, this data is mostly free of most kinds of license restrictions. In practice, the dataset available in this service can be distributed in any way and through any channel.
I. STEPS TO MAKING THE SPEED LIMIT MAP QUICKLY
1. The very first step is visiting the Geofabrik.de service. The administrative selection looks as presented below (Pic. 1).
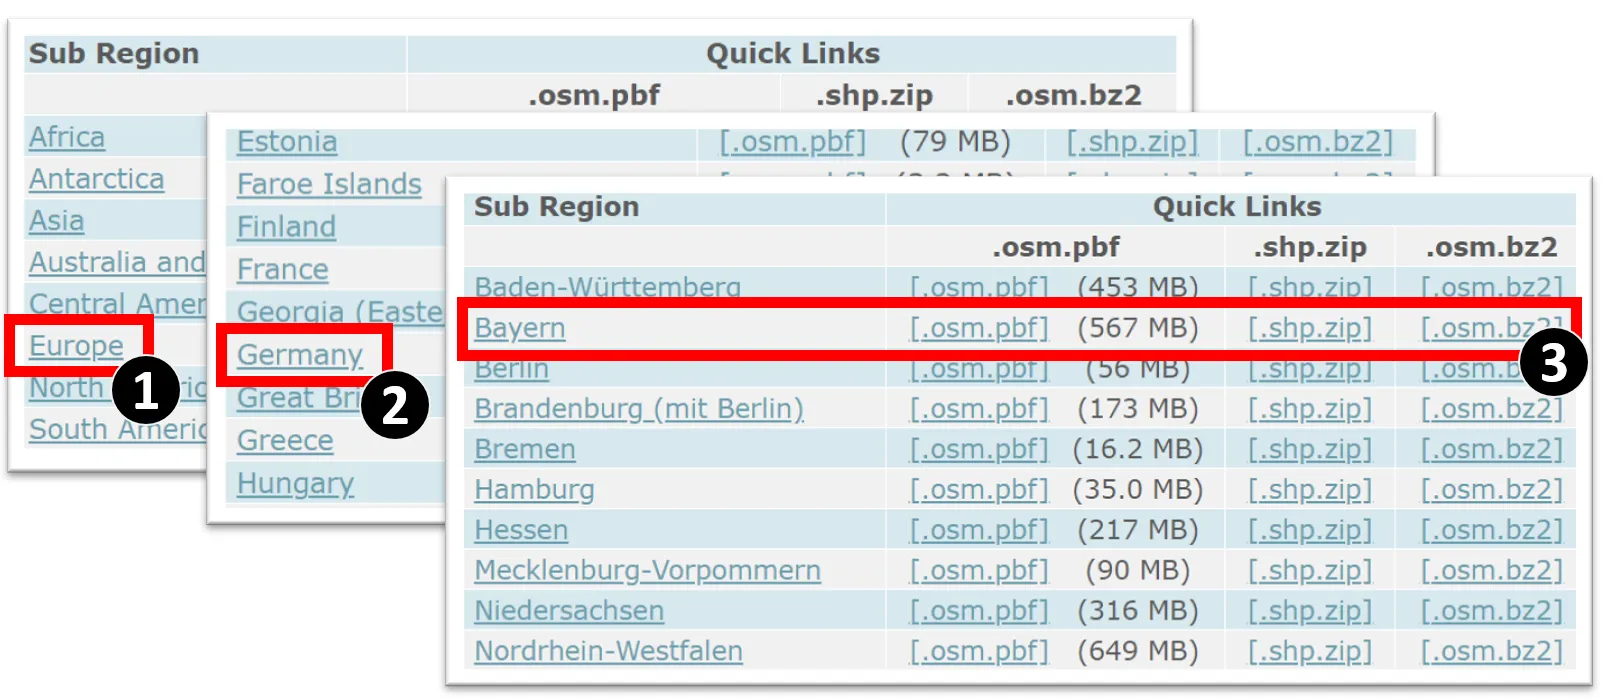
Pic. 1 Select the administrative areas in the Geofabrik OpenStreetMap server in order to download them to our drive (Towardsdatascience.com).
When you select the proper region, the most convenient option is downloading it as a zipped shapefile.
2. Select the appropriate shapefile and load it to QGIS. In our case, we just need the road network (Pic. 2).
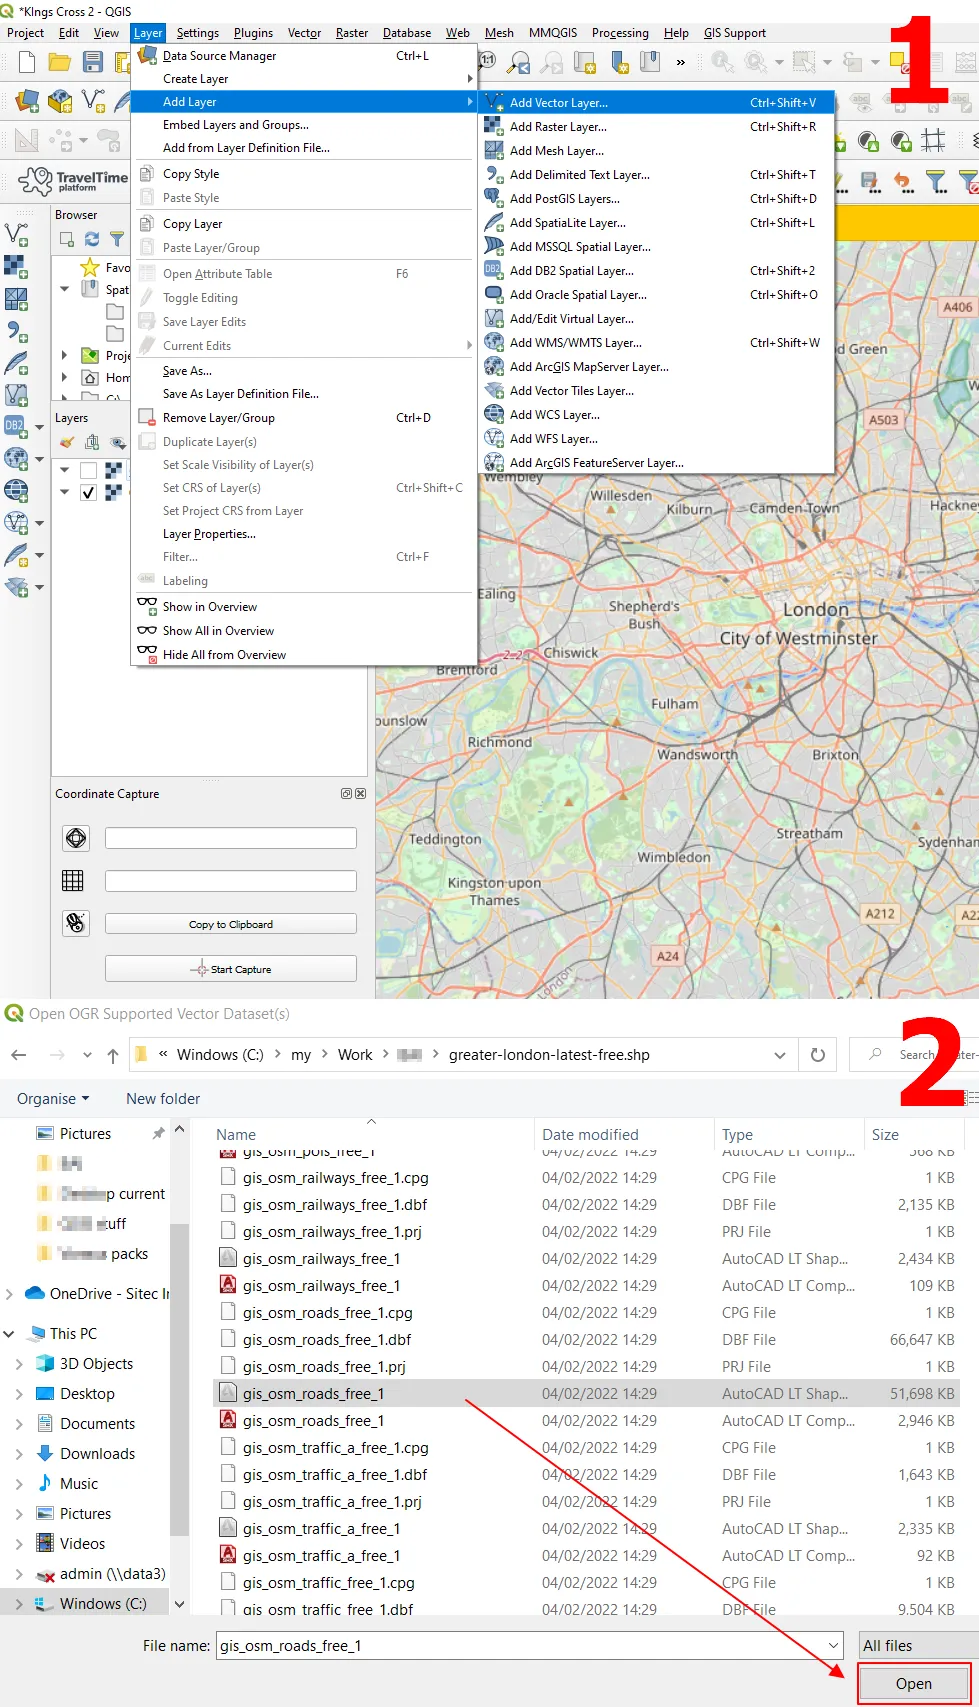
Pic. 2 Adding Geofabrik shapefile vector layer to QGIS.
Alternatively, we can grab the highlighted file from the extracted folder, drag it onto the QGIS map canvas, and drop it there. It will have the same effect on us.
3. Since our road network layer has been loaded successfully (Pic. 3). As the first thing, we should open is the data attribute table.
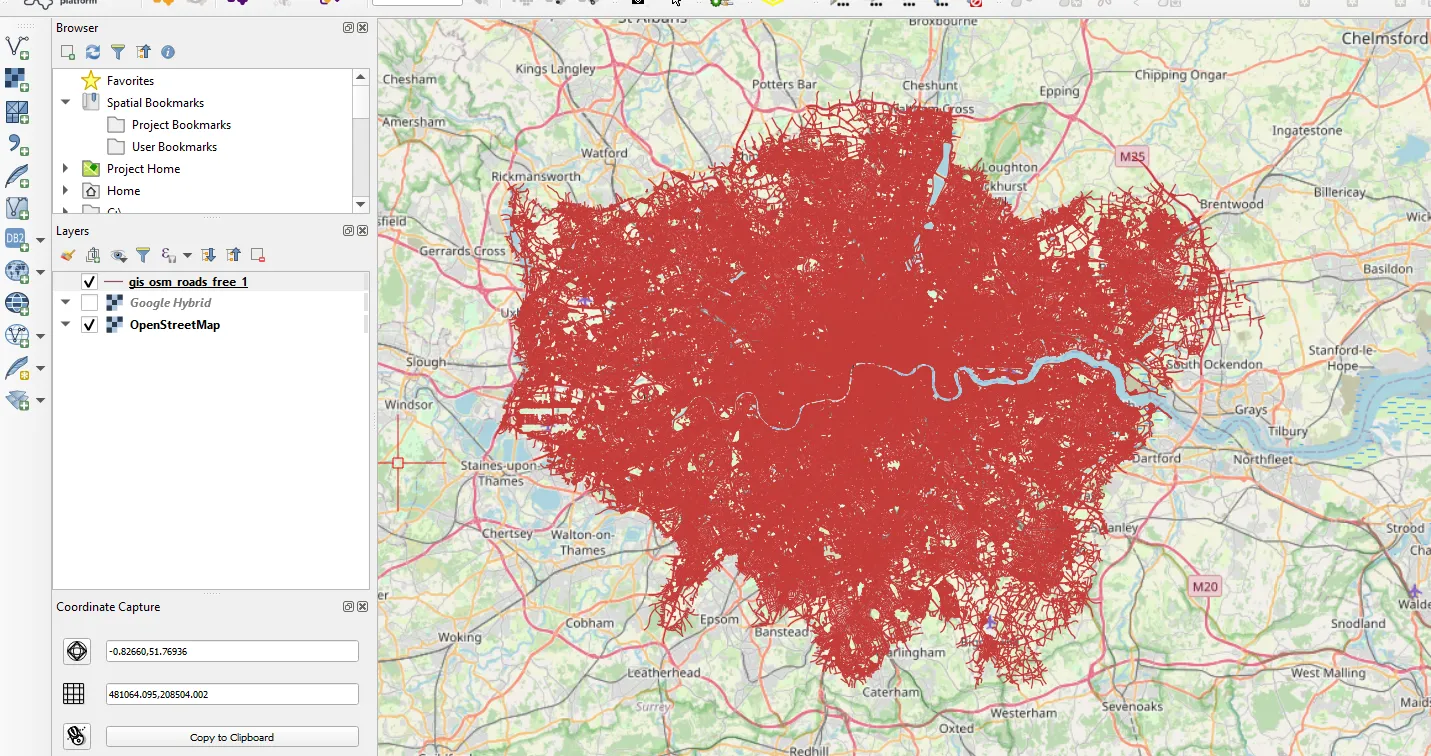
Pic. 3 Our London road network shapefile loaded in QGIS.
In the data attribute table, we should sanitize the road network by the maxspeed column, which will give us just these roads, where the maximum speed limit has been set. In this case, we should use the “Select by expression” option and use the following formula:
maxspeed > 0
or
maxspeed is NOT null
considering the situation, where instead of the value 0, we have a blank cell in the maxspeed column.
Another, but not essential step can be showing only selected items in our data attribute table unless your QGIS doesn’t respond for a long time (Pic. 4).
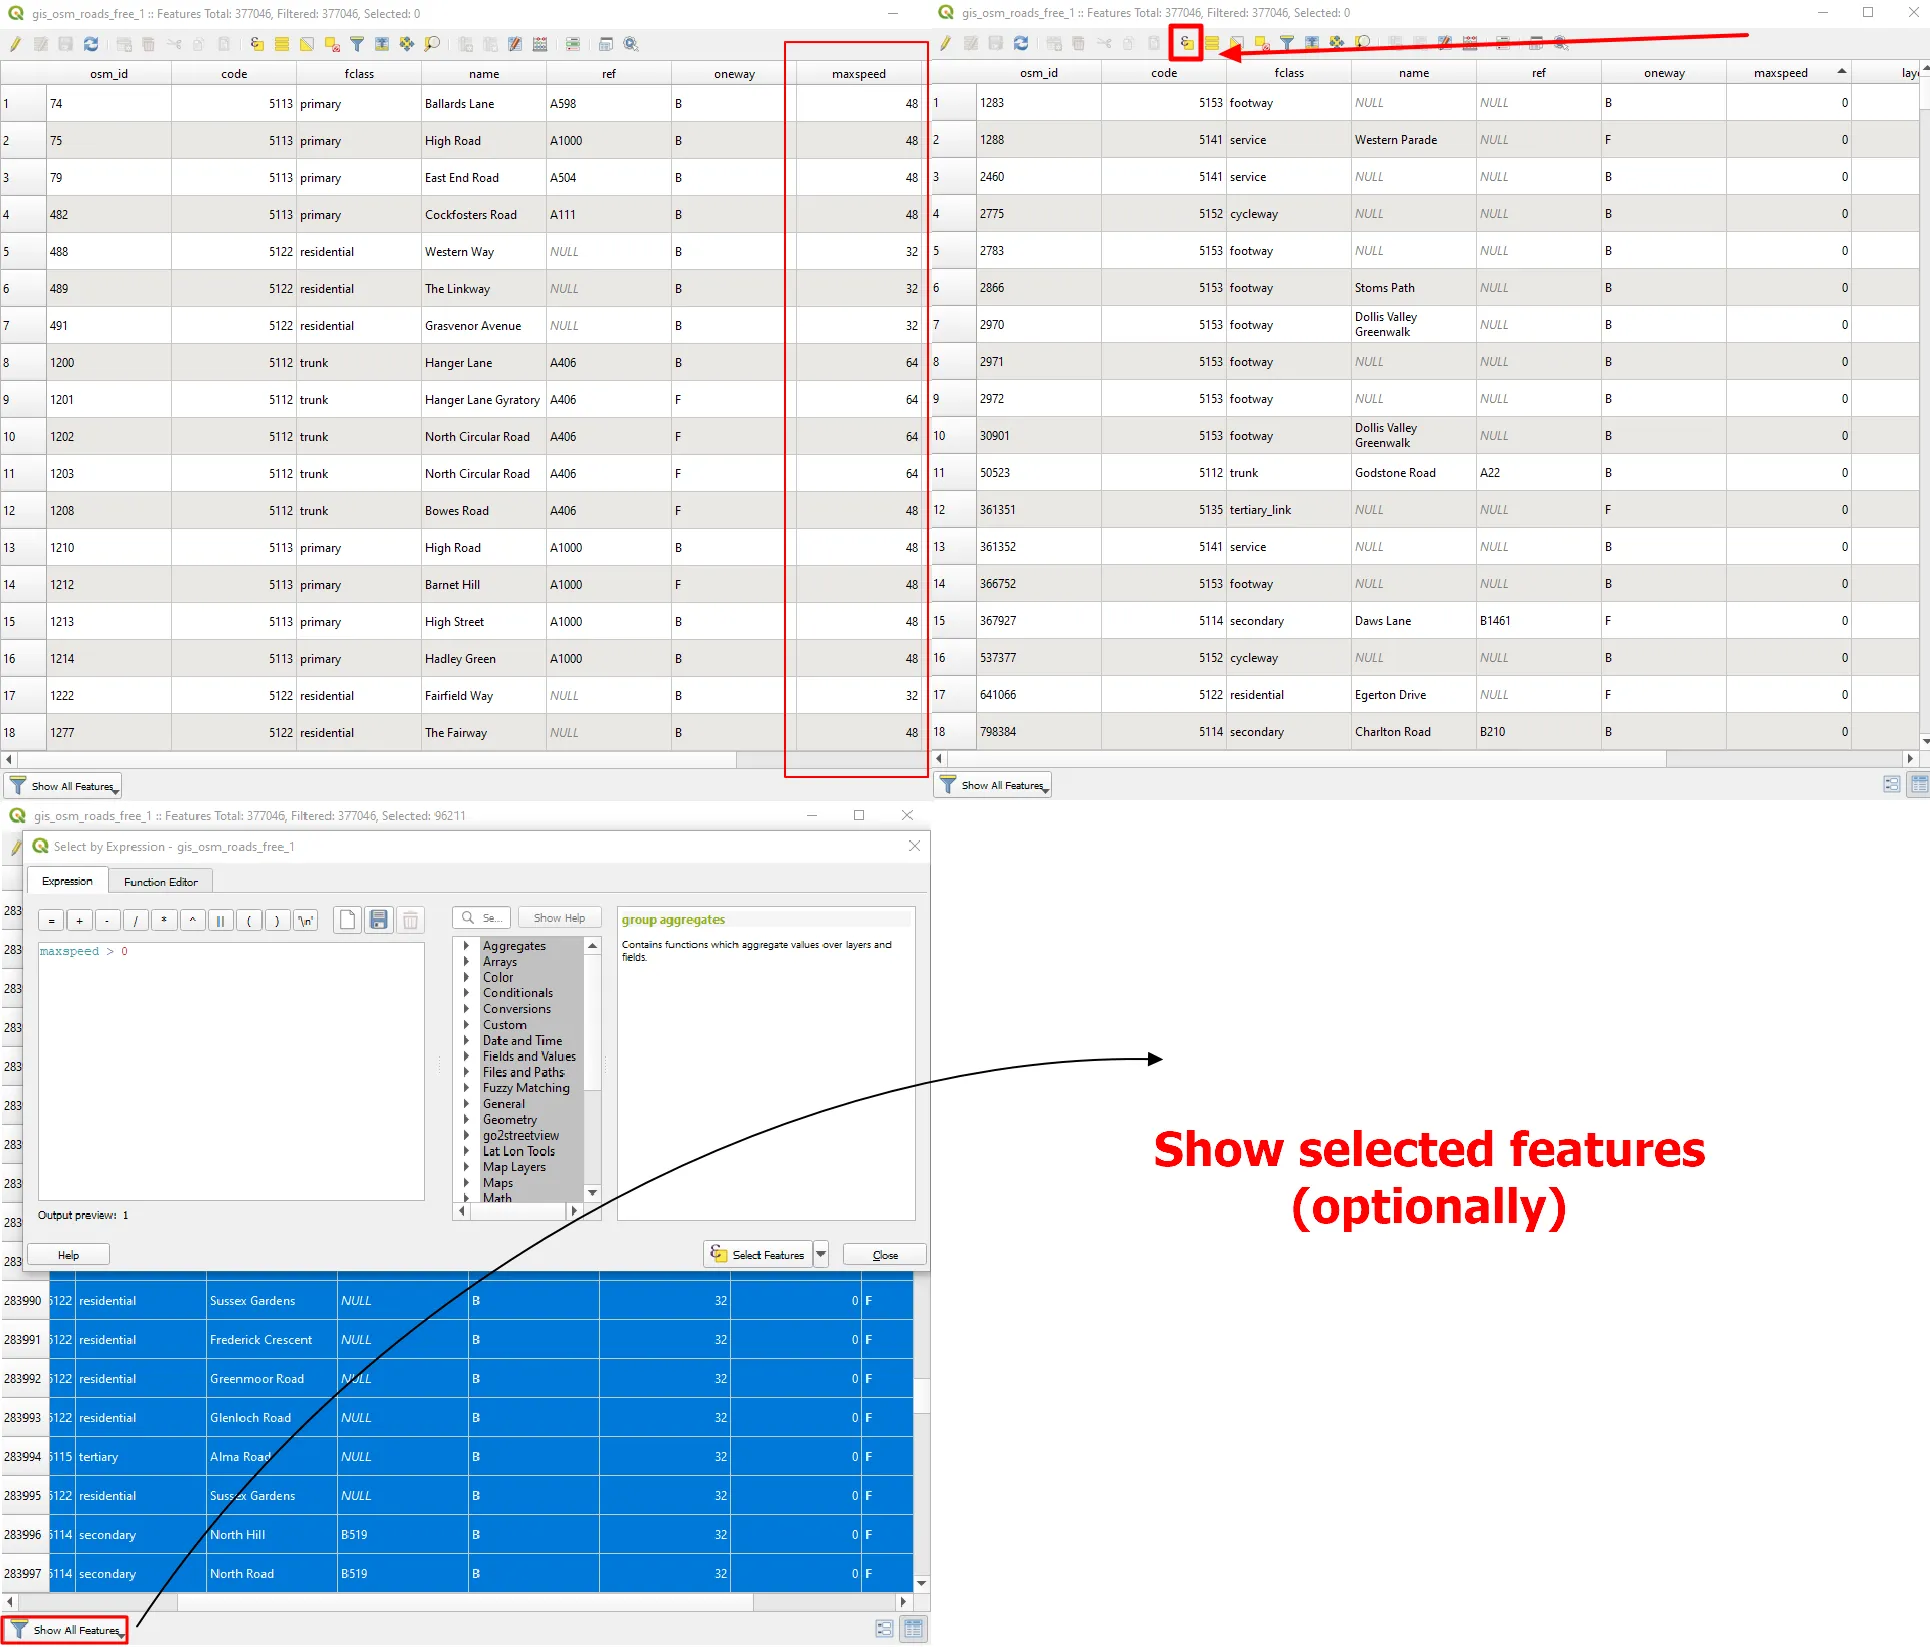
Pic. 4 Selecting road network by expression in the data attribute table.
You should now see the roads with the speed limit selected. Other stuff is out of classification, which applies to i.e. cycle routes, footways, and other networks like this (Pic. 5).
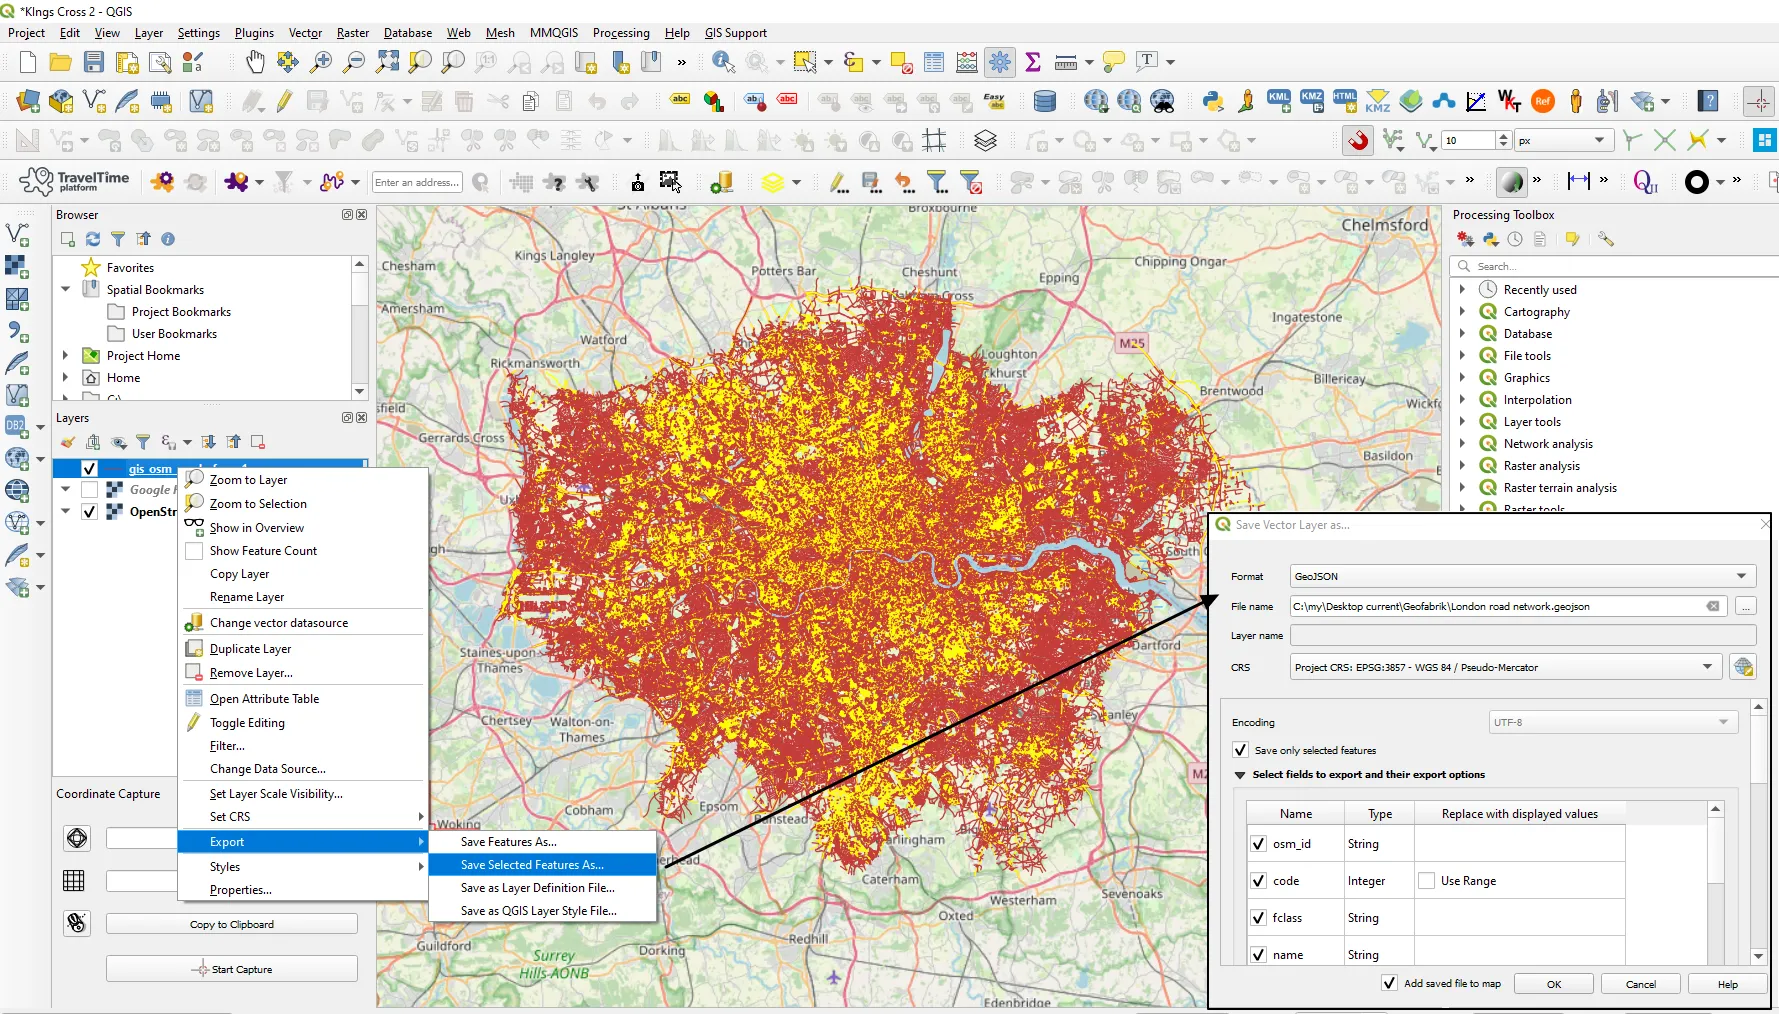
Pic. 5 The Selected road network has been highlighted in our QGIS project. Now we can export them as separate files.
4. However the most important thing here is extracting all the selected stuff from the whole layer. We can do it by exporting them in a separate file (Pic. 5).
After loading the exported road network to our QGIS project again, we will see basically everything needed for our next step. The previous layer containing the whole lot can be turned off (Pic. 6).
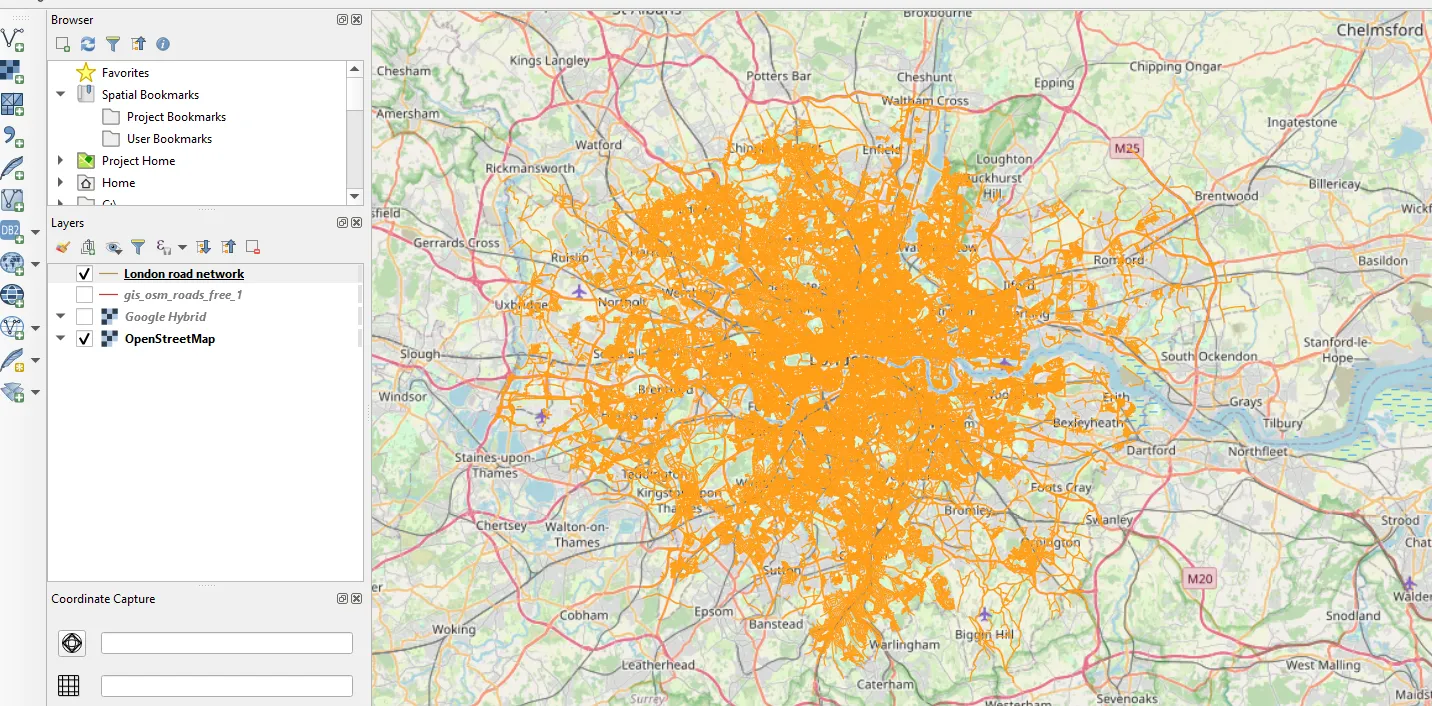
Pic. 6 Our road network with speed limit included extracted from the main shapefile.
5. Our next step will be categorizing the road network by the speed limit value defined. We might have quite a lot of categories, however, it shouldn’t be a problem to allocate an appropriate coloration and line thickness (Pic. 8). We should remember a couple of basic things here like the selection of the proper column and auto-categorization of the values (Pic. 7).

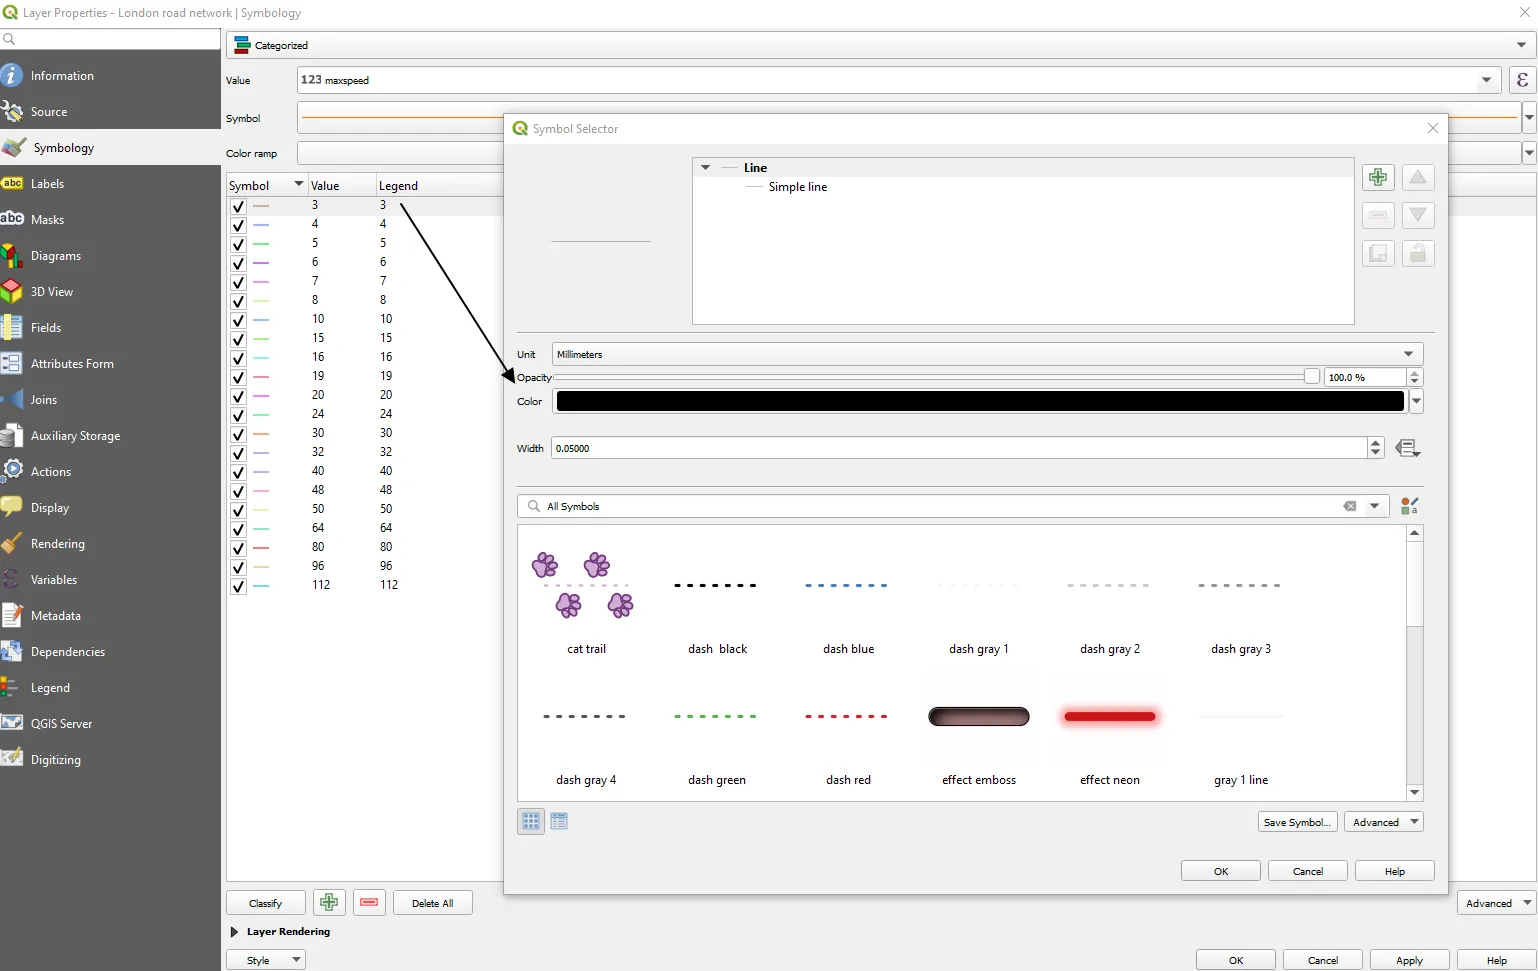
Pic. 7, 8 Categorizing the styles for our road network with manual assigning the proper coloration and line thickness.
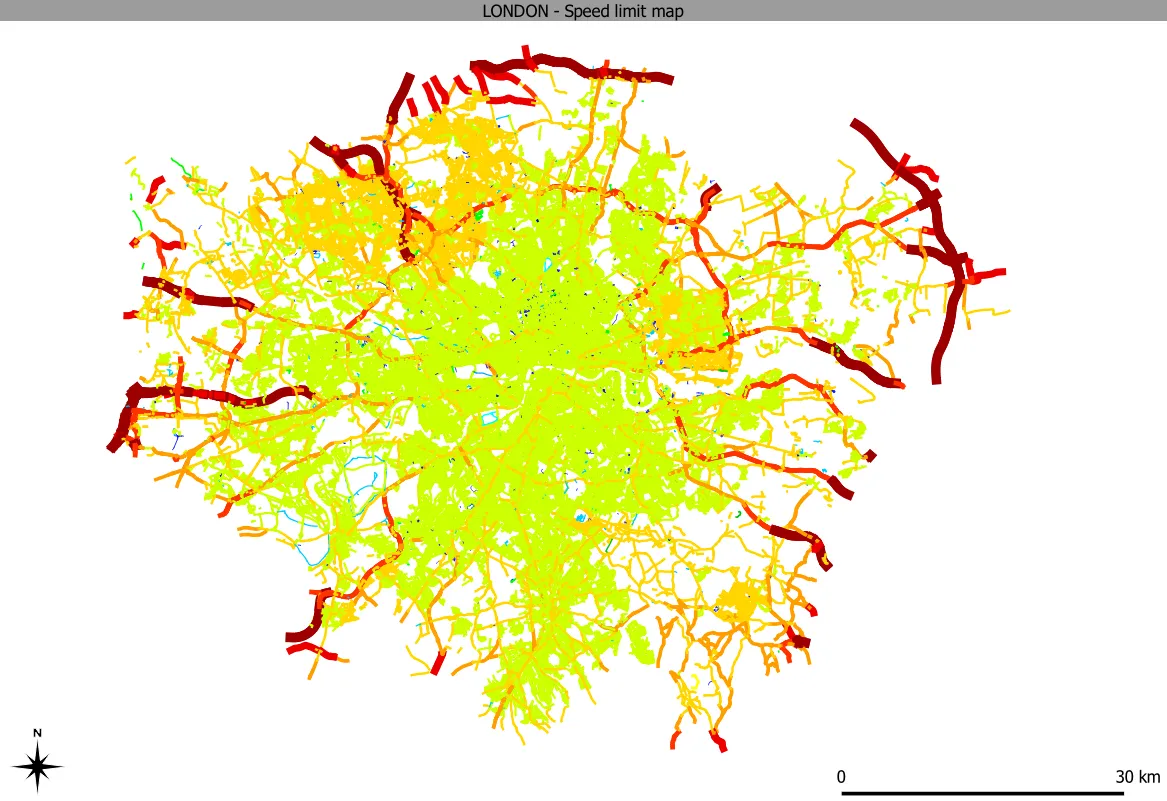
6. We are essentially done! Our map looks like the one below (Pic. 9).
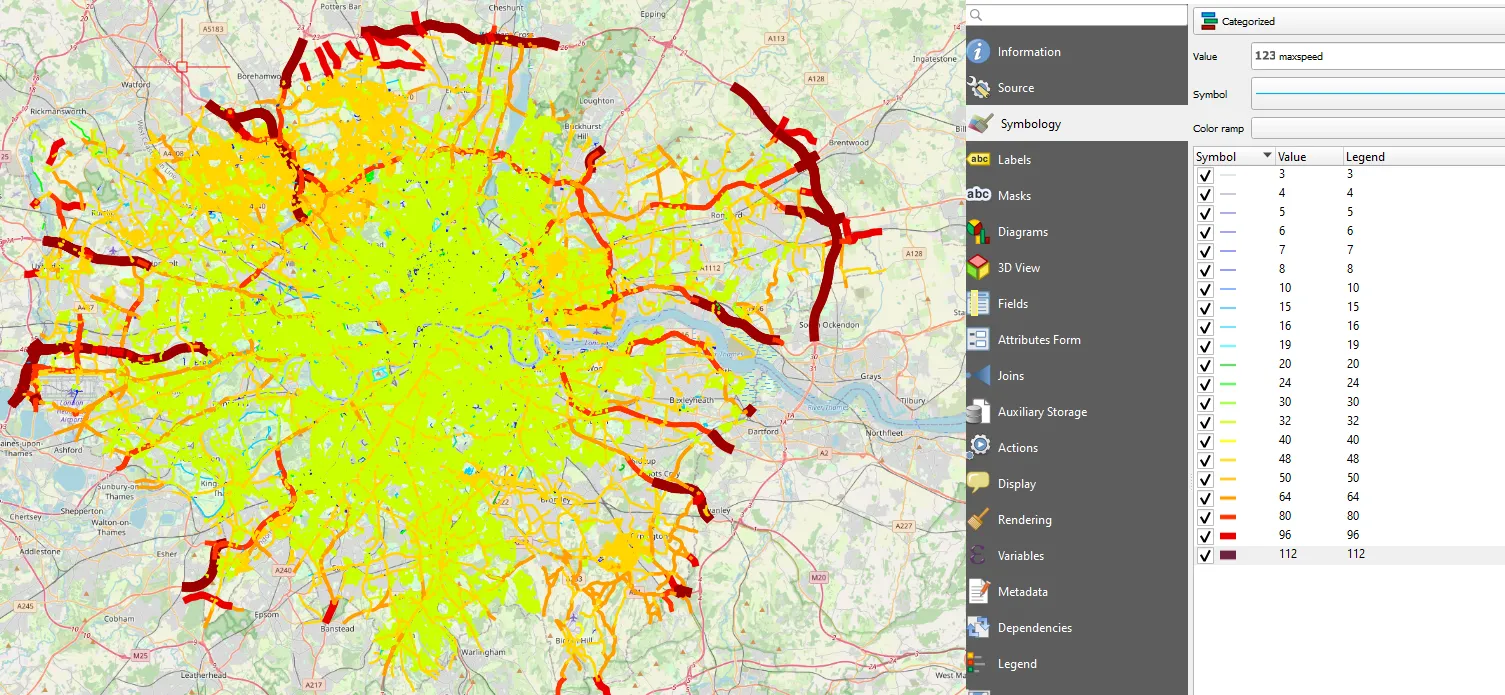
Pic. 9 Speed limit map is ready! The categorized styling was turned on for reference.
However, we have some incomplete parts of the Greater London area, as you can see below. It looks like in one place the maxspeed value hasn’t been filled up. On top of that in other areas probably wrong values have been provided (Pic. 10).
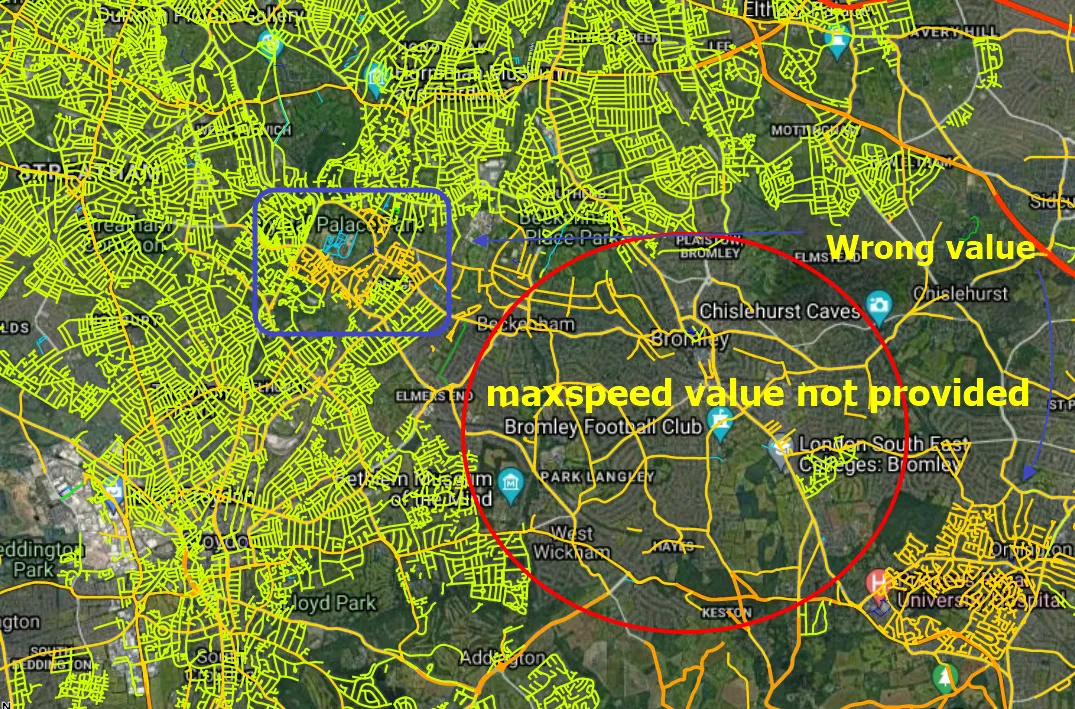
Pic. 10 The example of incomplete or incorrect speed limit data is included in the maxspeed column. This is the result of insufficient user contribution in these areas.
7. At the very end we can customize our map by adding decoration elements (Pic. 11) or editing the print layout items (Pic. 12).
Pic. 11 The speed limit map is decorated with the north arrow and scalebar in QGIS.
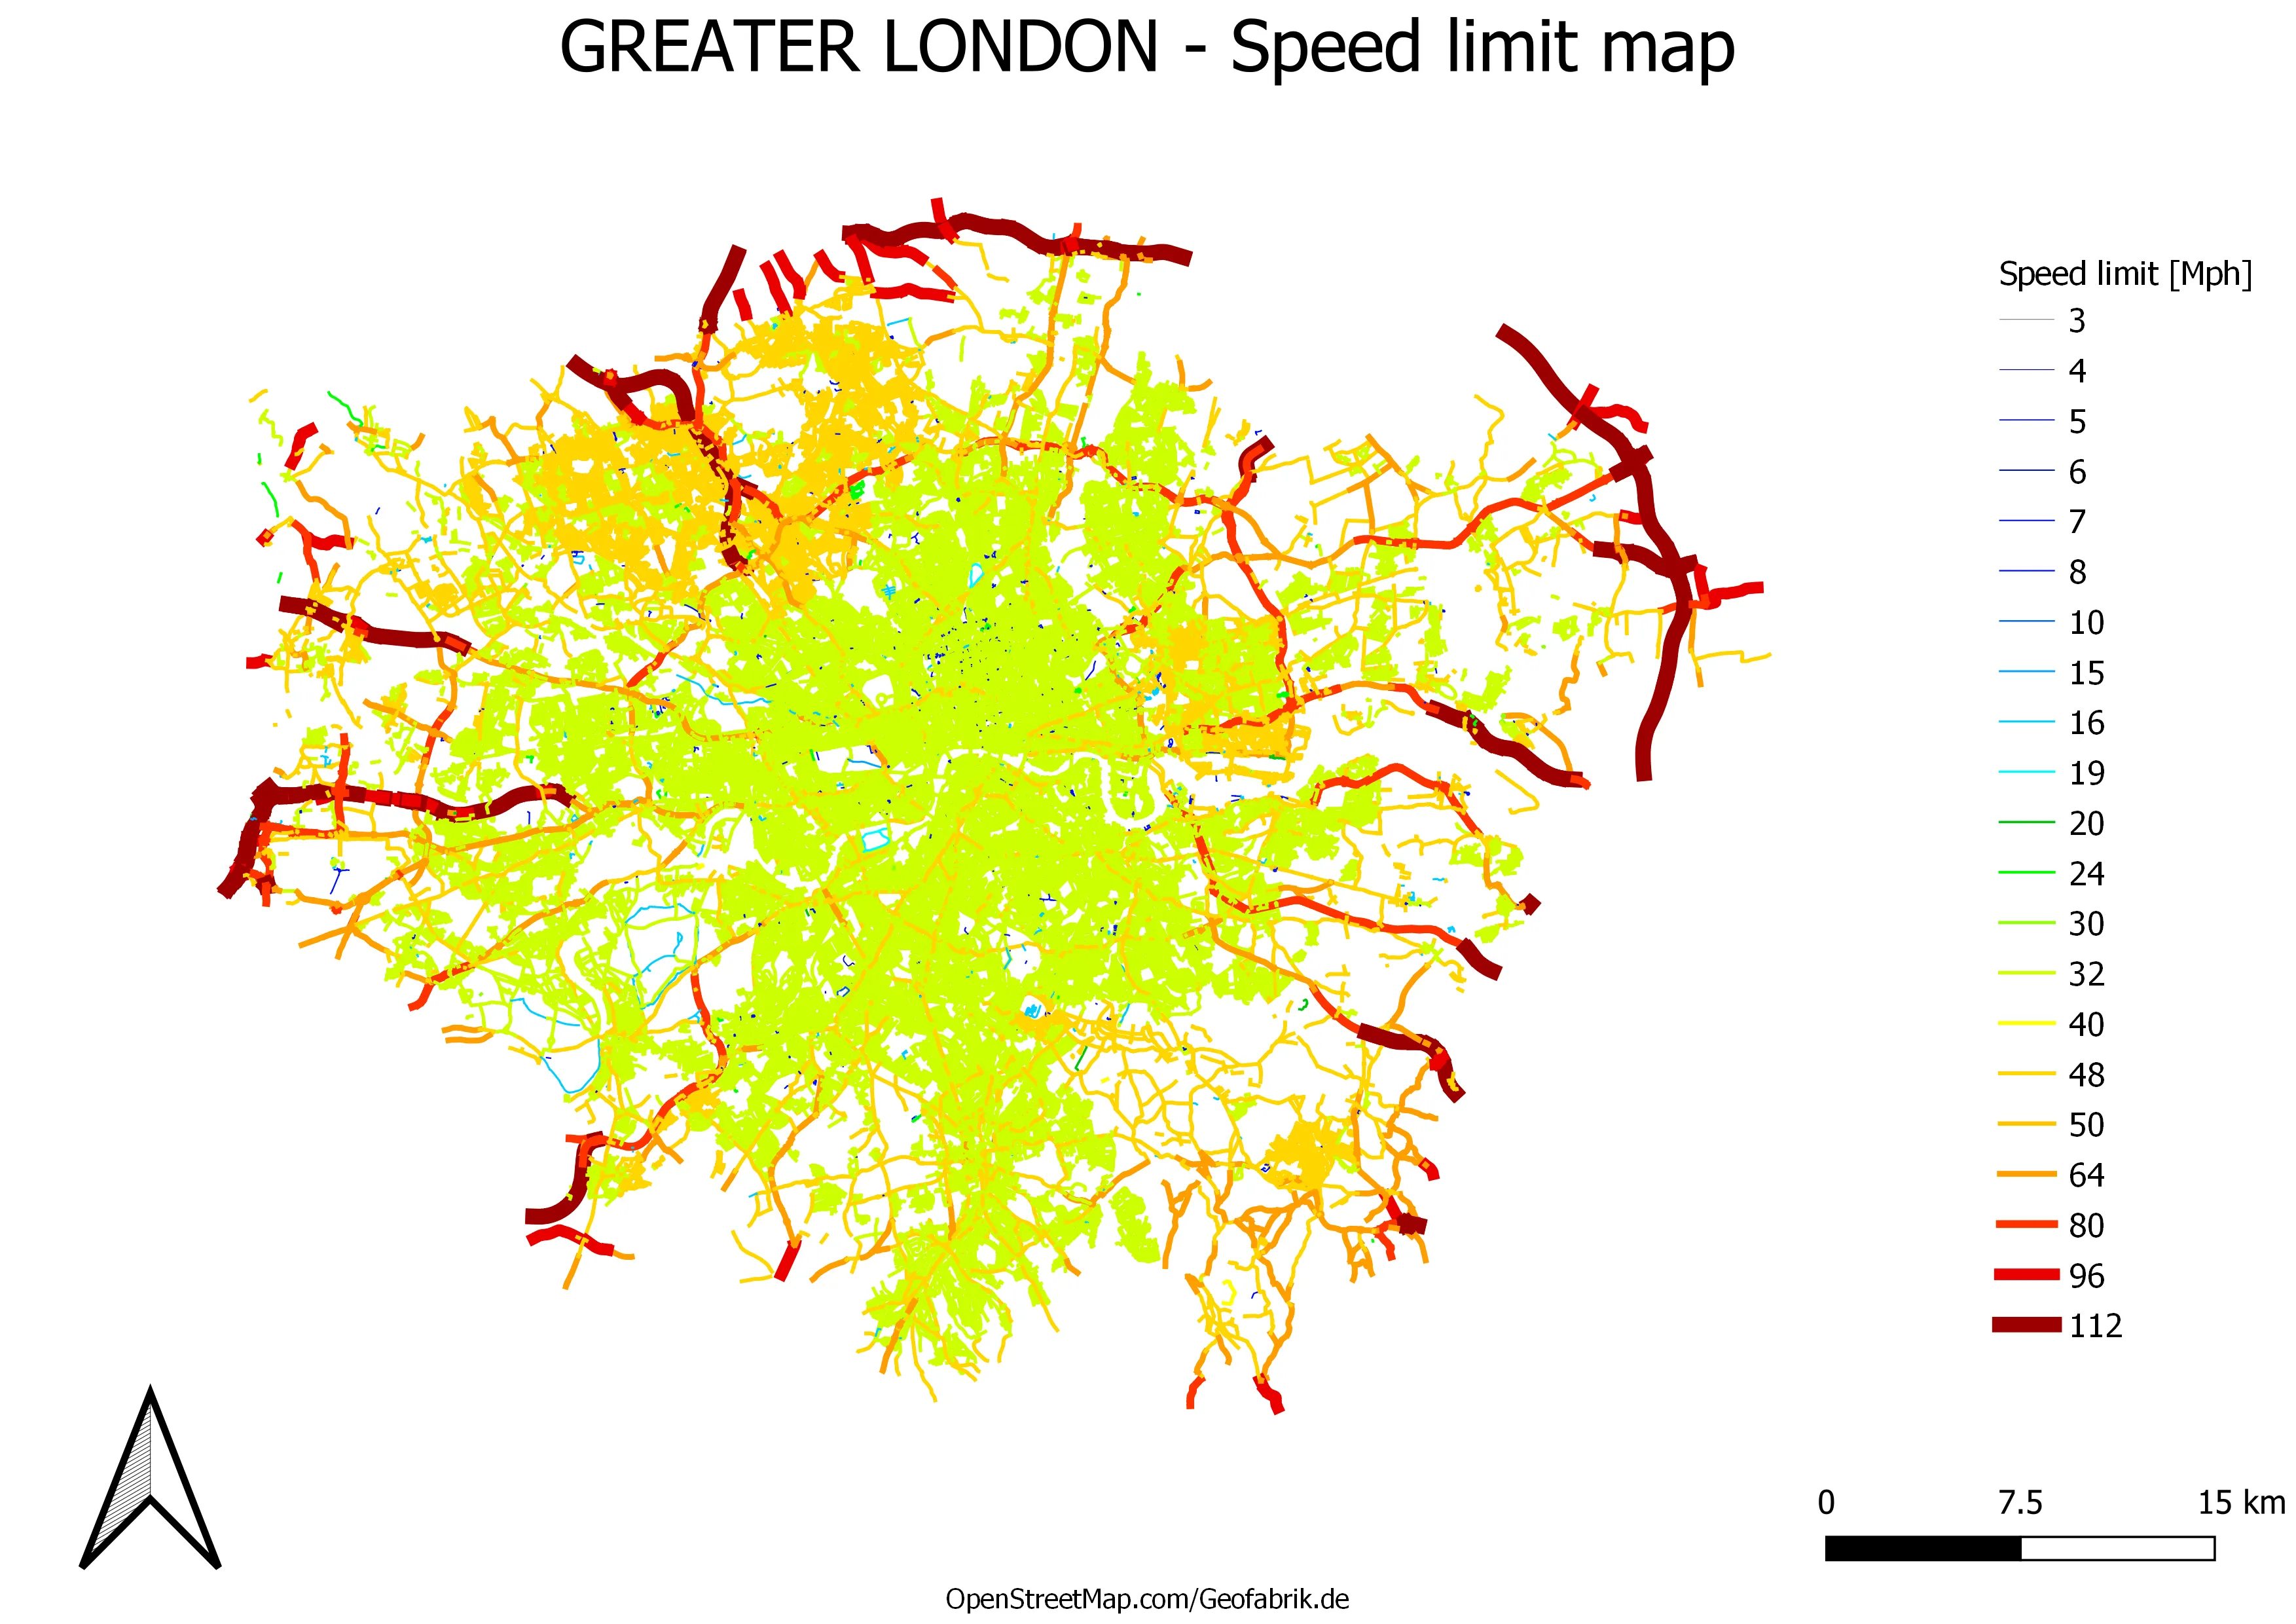
Pic. 12 The ready speed limit map customized in QGIS print composer, where the legend and other map elements have been included. Click to enlarge.
II. CONCLUSIONS
Downloading data from the Geofabrik server is very convenient. We can have the whole voivodeship or even country in one go, as long as your computer memory resists it. However as the OpenStreetMap dataset is an output of a multitude of contributors worldwide, we must be aware, that the data might be patchy in some regions. As a result, we can get simply incomplete data for our work (Pic. 10). An alternative way is editing the OpenStreetMap speed limits, which can be done i.e. by the StreetComplete editor or some mundane methods like checking the Mappillary imagery, where the speed limit signs can be discerned from the user images, Google Street View or Waze.com discussed earlier working pretty much at similar basis as the OpenStreetBrowser.
In other cases, the maxspeed value alterations are required, especially when the on-site situation has changed (i.e. residential area has been expanded). If they are not provided yet or the input is wrong, they do give not us genuine information, which is adequate for lack of information.
Another problem might be the server limitation, which makes you unable to download for example a whole continent in smaller pieces. In this case, it better is to save the dataset in one go.
Mariusz Krukar
References:
- Ramm F., 2021, OpenStreetMap Data in layered GIS format – version 0.7.11
- Zilske M., Neuman A., Nagel K, 2011, OpenStreetMap for traffic simulation, (in:) OpenStreetMap conference, Wien, p.126-134.
Links:
- https://download.geofabrik.de/
- https://www.geofabrik.de/geofabrik/free.html
- https://labs.mapbox.com/mapping/jp/mapping-for-navigation/road-features-mapping-guide/
- https://anylogic.help/markup/converting-roads.html
- https://towardsdatascience.com/beginner-guide-to-download-the-openstreetmap-gis-data-24bbbba22a38
- https://sumo.dlr.de/docs/Tutorials/Import_from_OpenStreetMap.html
- https://cran.r-project.org/web/packages/osmextract/vignettes/osmextract.html
- https://mdl.library.utoronto.ca/technology/tutorials/exporting-map-data-openstreetmap
- https://extract.bbbike.org/
- https://www.openstreetbrowser.org/
Github:
- https://github.com/streetcomplete/StreetComplete
- https://github.com/openmaptiles/openmaptiles-tools#multi-streamed-osm-data-downloader
- https://github.com/openstreetmap/osmosis
Forums:
- https://help.openstreetmap.org/questions/64487/what-is-geofabrik-download-request-rate-limit
- https://www.reddit.com/r/gis/comments/ok71rd/us_speed_limits/
- How can I get route data into a SHP or KMZ file for GIS software like QGis?
- https://help.openstreetmap.org/questions/77727/export-roads-with-maxspeed
- https://stackoverflow.com/questions/15749133/get-speed-limits-from-openstreetmap
- https://help.openstreetmap.org/questions/7927/how-can-i-see-the-speed-limit-of-a-street
- https://stackoverflow.com/questions/28238536/local-nominatim-openstreemap-with-speed-limits
- https://www.researchgate.net/post/How-to-extract-legal-speed-limit-from-GPS-coordinates-in-OSM-OpenStreetMap
- Is There a Website That Shows The Different Speed Limits in Victoria?
- Github.com: Quick editing of OpenStreetMap speed limits
- https://help.openstreetmap.org/questions/1330/speed-limits-map-correction
Wiki: