
The flood simulation in Google Earth
Introduction
Google Earth is a handy tool to browse terrain in any part of the globe. Due to detailed satellite imagery, you are able to characterize the interesting area in any line of geographic research. Nowadays 3D quality imagery manages to develop across the World, especially in the most populated areas. The 3rd dimension of imagery refers not only to simple objects that exist in the geographical space but also to render detailed landforms and terrain declivity of the local area.
Google Earth engine is known for use eg. landslide location, ground coverage, landform identification, geological features, small-scale topographic features and mainly for interesting places location and surface inspection. To be said Google Earth is a widespread tool in the following examples:
- Mapping of disease ranges, in relation to satellite imagery of the area of surveillance, that may be used to create a base map in GIS software (.shp). Visual imagery from Google Earth can be used to prioritize specific places (landfills, large areas of standing water, etc) for targeted further control interventions.
- Extraction of urban agriculture sites through the analysis of high-resolution aerial images in conjunction with another GIS software (e.g ArcGIS). It leads to identifying and mapping public and private spaces of food production within big urban areas.
- Inspection of archaeological monuments thanks to detailed remote sensing provided by Google Earth imagery. It may illustrate how satellite imagery can be exploited to shed important light on the character and development of the human landscape.
- Analysing the processes based on the external framework, which is available for viewing in the Google Earth application (weather patterns, land coverage, etc.) to demonstrate the process. You can demonstrate the process by sharing your work with other Google Earth and other GIS users via the internet.
- Making land-use plans like geological itinerary stops in some natural park. Thanks to this you are able to establish a conservation protection plan to meet the educational and social needs of society.
Every remarked earlier way to use the Google Earth software is helpful in any research sciences and companies.
I demonstrated the flood simulation using the Google Earth software for 3 cities: Cambridge (United Kingdom), Warsaw (the capital of Poland) and Dresden (Germany). To manage the biggest flood in those cities I used flood markings and historical data.
Appropriate flood simulation can be done by advanced software like flood modeller or global mapper. Software, which is able to cooperate with numeric terrain models. Using Google Earth for flooding occurrences can simplify the process, however, I am telling you in advance that it won’t be accurate enough.
Pros and cons of using Google Earth to analyse flood hazards in your area:
+
- quick analyse, without difficult software which will free you to make it within less than 5 minutes,
- you may keep the layers saved and return to your simulation whenever you want,
- you can make a flood simulation in a few places at once,
- 3D coverage gives you an opportunity to analyse the flood circumstances in urban areas clearly,
- according to 3D coverage, you can take a look into flood situations from different sites and angles,
- you are able to run the ground view (or street view) to insight into your area how it could be like during any size of flood,
- full Google Earth database in conjunction with the flood simulation allows you to delimit some alternative ways of traffic etc when high water occurs.
- you are able to record a movie including the whole flood process,
- quick save the picture in Google Earth gives you a quick way to create a time-lapse of flood occurrence.
- the tool may be perfect for modelling the water reservoirs in mountainous areas.
–
- You are able to change the flood level on 1 m adjustment only,
- The simulation doesn’t really work with Street View mode, doesn’t cover proper areas and the layer disappears quite often,
- The simulation doesn’t take into account the terrain declivity, so you need to separate your area for more narrow peace depending on where you are,
- As per as aforementioned terrain declivity, the simulation doesn’t work in mountainous areas,
- The simulation can’t take into account the levees when they exist and basically, you need to adjust your river bed area to them,
- High PC system requirements, the 3D mode is provided by Google Earth 7+,
- 3D coverage is not available in many places in the World. It covers mainly the biggest and most renowned cities.
How to create the flood layer?
- Select “add polygon” from the top toolbar (Pic. 1).

Pic. 1 Select “Add polygon” from Google Earth’s top toolbar.
2. You should receive a pop-up window entitled “Google Earth – New Polygon”: in the “name” row put the name of your polygon. You can also add the description below (Pic. 2) however, You will deal with it a little bit later.

Pic. 2 Name and description of your polygon.
3. Drag the dialogue box back into your view (basically, you can pick up 4 points only making the square-shaped area of your simulation)(Pic. 3,4).


Pic. 3,4 A new box created in Google Earth exists like a layer. To create it quickly you need only 3 or 4 points. You can also have more points when your analysis is more advanced.
4. Go to the aforementioned pop-up window and pick up your favourite colour, however, it’s good to set the similar to the flooding river colour. You can set the opacity also. I advise you to put around 90-100%. Do the same both for lines and areas (Pic. 5).

Pic. 5 The default “Clamped to the ground” option.
5. Go to the “Altitude” sheet and toggle the “Absolute” option rather than “Clamped to the ground” selected as default (Pic. 6,7,8).

Pic. 6 Your box layer when clamped to the ground. It covers the whole area except the 3D objects.

Pic. 7 The box altitude options in the Google Earth software. Select “Absolute” as per as above.

Pic. 8 The box altitude – “absolute”. Your box is already gone.
6. On your left side, you can adjust the altitude value. Remember that the altitude value of 0 m is equal to the sea level! To set the right altitude value for the area of your surveillance set the cursor into the river bed and see the elevation value in the bottom right corner (pic. 9).

Pic. 9 When elevation is 4 m (above sea level) then you need to set at least 4 m to see your box on the ground. In this case, the south Peterborough’s bottomland lies at 4 m above sea level, but the River Nene water level is about 3 m above sea level, thus setting your layer at 4 m altitude “makes” the river Nene completely full.

Pic. 10 When elevation is 5 m (above sea level), in the River Nene case we have a flood then. The footpath alongside the river is actually out of use due to the flood.
7. If you can compare your flood in different levels you can copy the created layer (right mouse click and select copy) (pic. 11) and paste (pic. 12) (right mouse click and select paste). Remember to close the box window “Edit Polygon” before! Otherwise, right-clicking the mouse will modify the shape of your box. Alternatively, you can do this operation in your toolbar where you have your box located (pic. 13). To make your visualisation tidy change the opacity of a higher level from 90-100% to e.g. 30 or 40% and altitude from 5 m to 3 m (Pic. 5,9,14).

Pic. 11 After the right-click mouse, select “Copy”…

Pic. 12. …and next “Paste”.

Pic. 13. An alternative option in your toolbar.

Pic. 14 Finally you received 2 layers: Upper with an altitude of 5 m and 40% opacity and lower with a 3 m altitude and 100% opacity. River Nene heads east, hence lower layer is visible in the right corner. Google Earth doesn’t take the terrain declivity into account.
My examples of flood simulation
- Cambridge (United Kingdom)
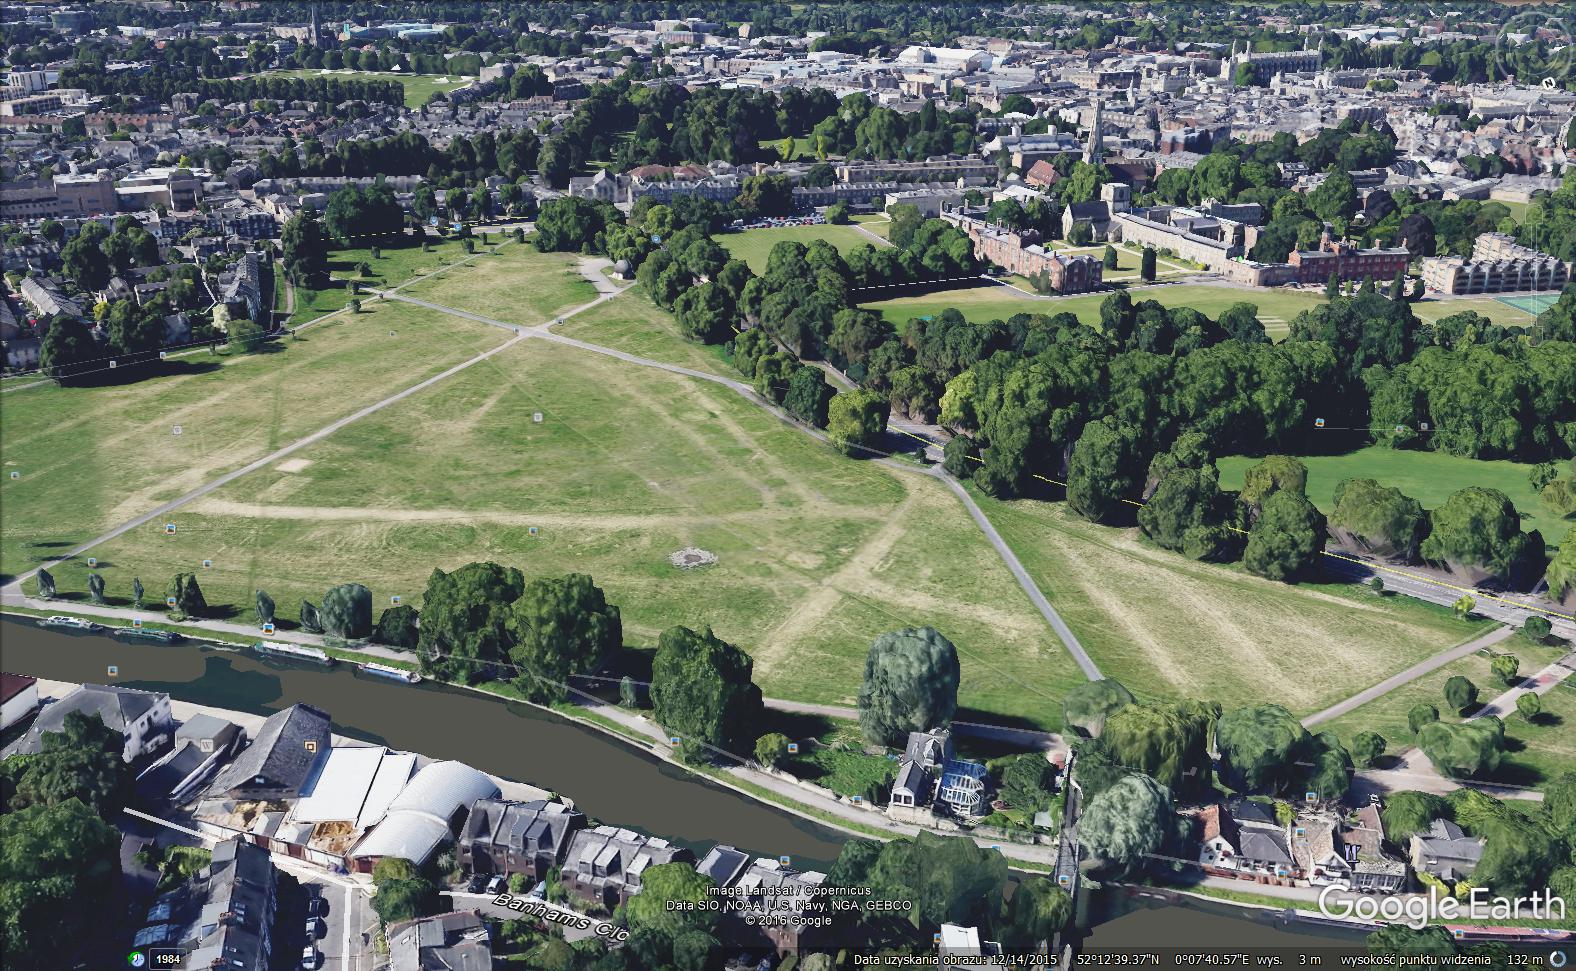
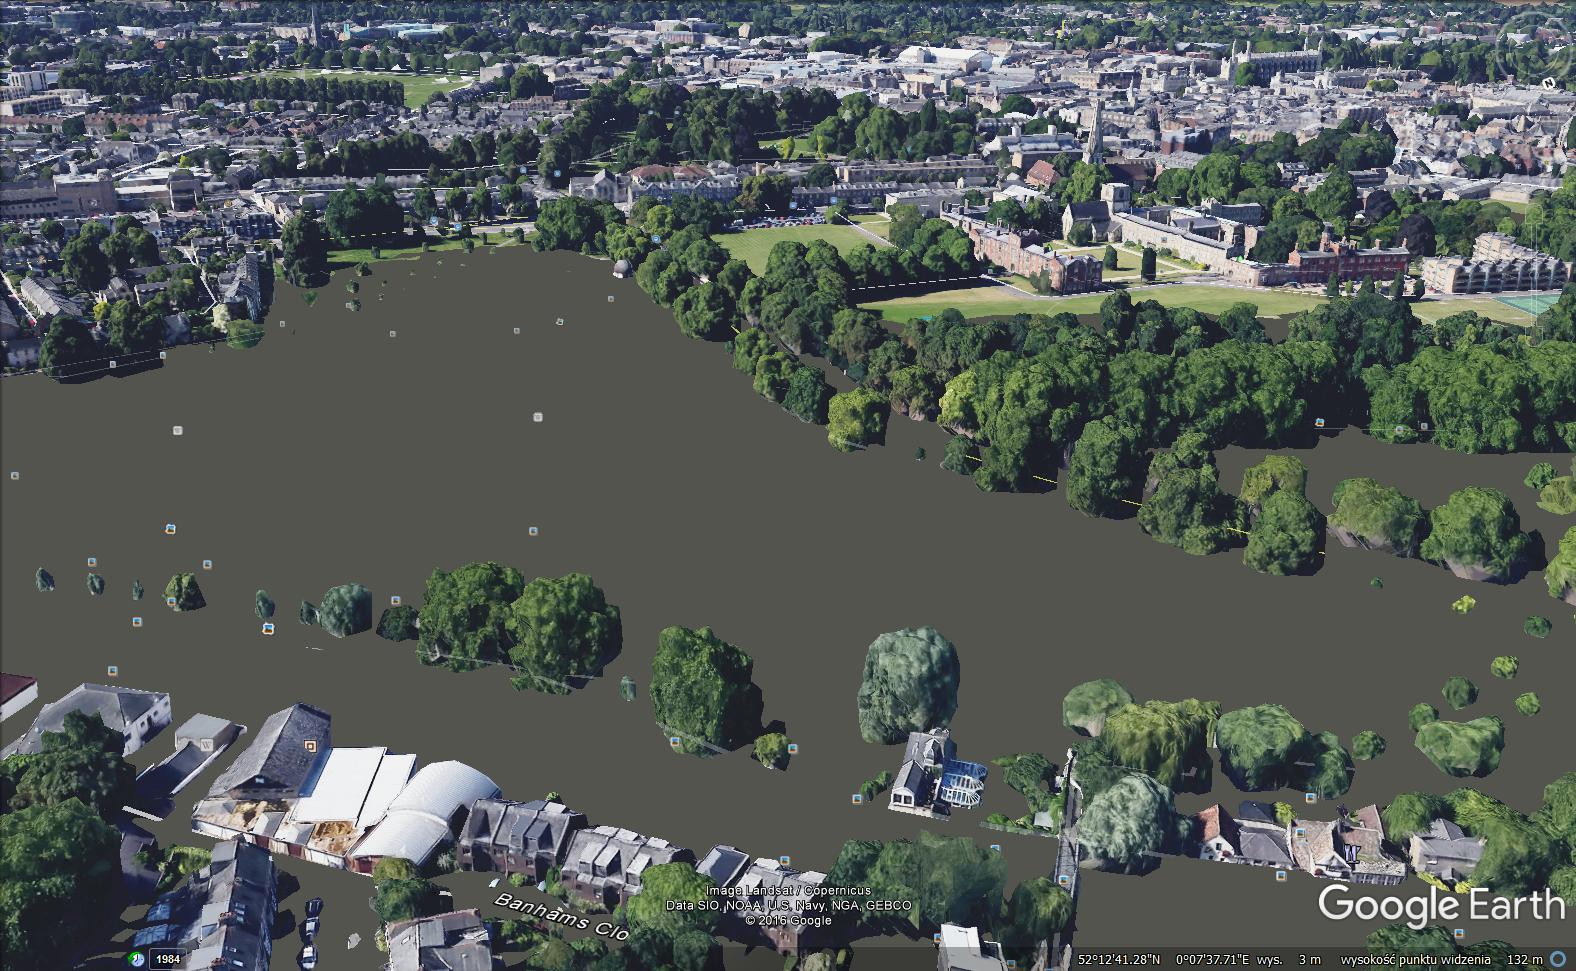
Pic. 15,16 Cambridge, Midsummer Common during the highest flood, which may be possible in Cambridge.

Pic. 17 The Cambridge city centre during the extreme flood situation.
Cambridge lies in the Cam river valley. The river Cam is a short (64 km-length) lowland river, which didn’t cause big floods in the last decades. The biggest market flood in Cambridge occurred in 1947 and 1973 (pic. 18). However, the GIS stuff contains areas inside the city, which are excluded due to flood risk. The best example of this is Midsummer Common and Jesus Green – the lowest-situated areas in the city centre.

Pic. 18 Flood marks on St Jone’s College bridge in Cambridge.
2. Warsaw (Poland)


Pic. 19,20 Central Warsaw flood simulation with a view towards Świętokrzyski bridge.
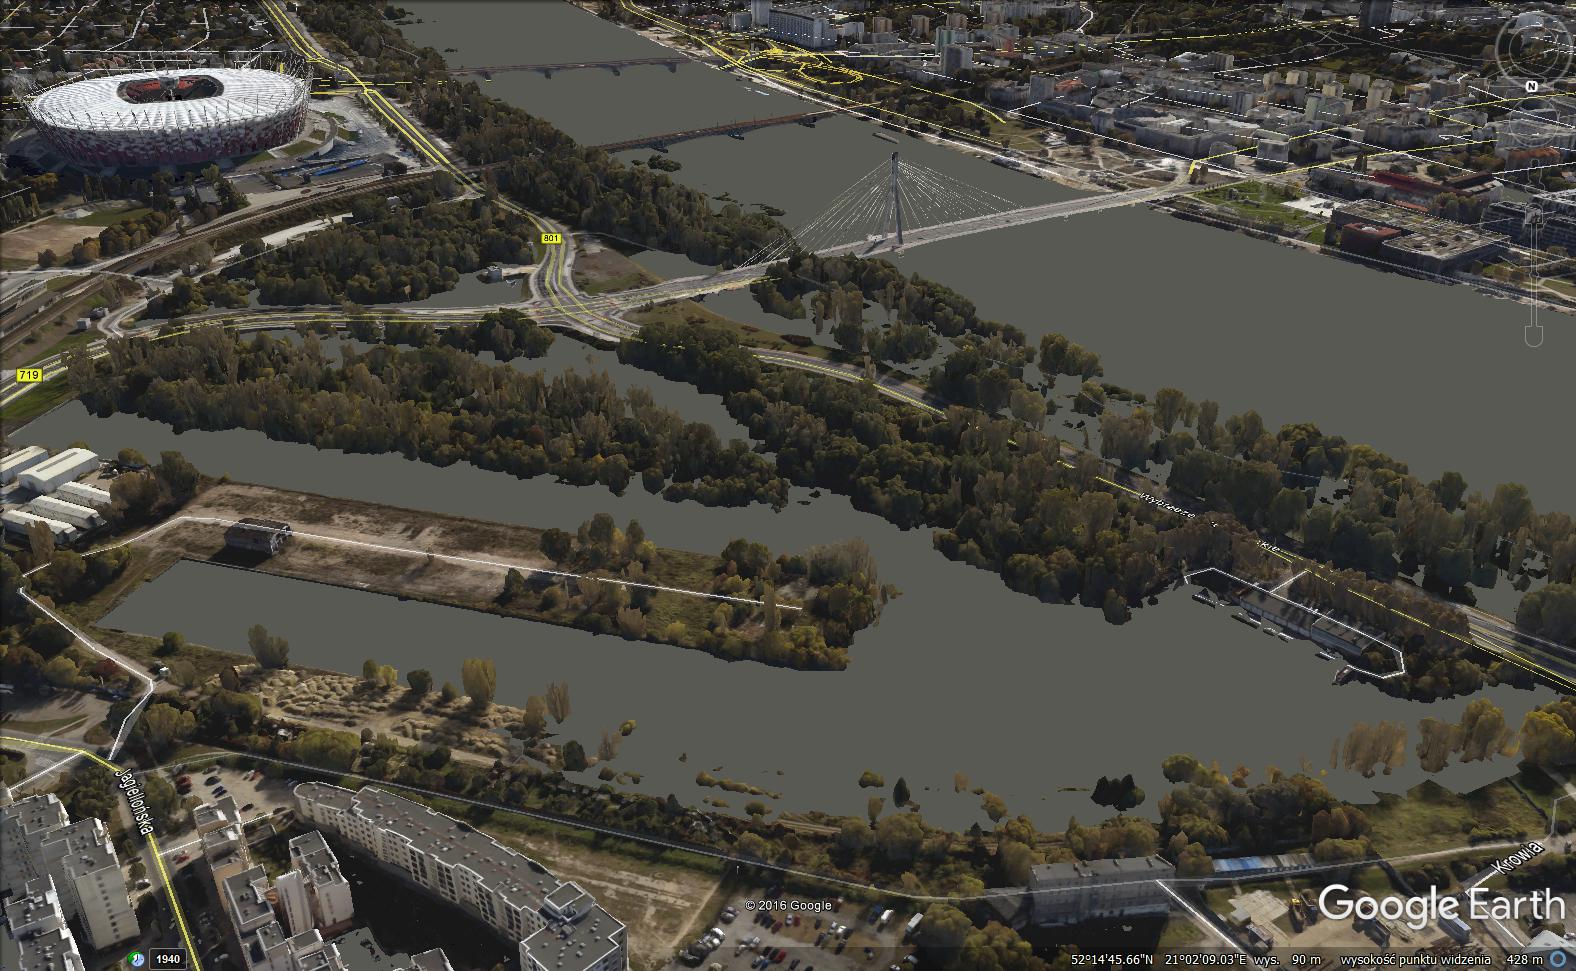
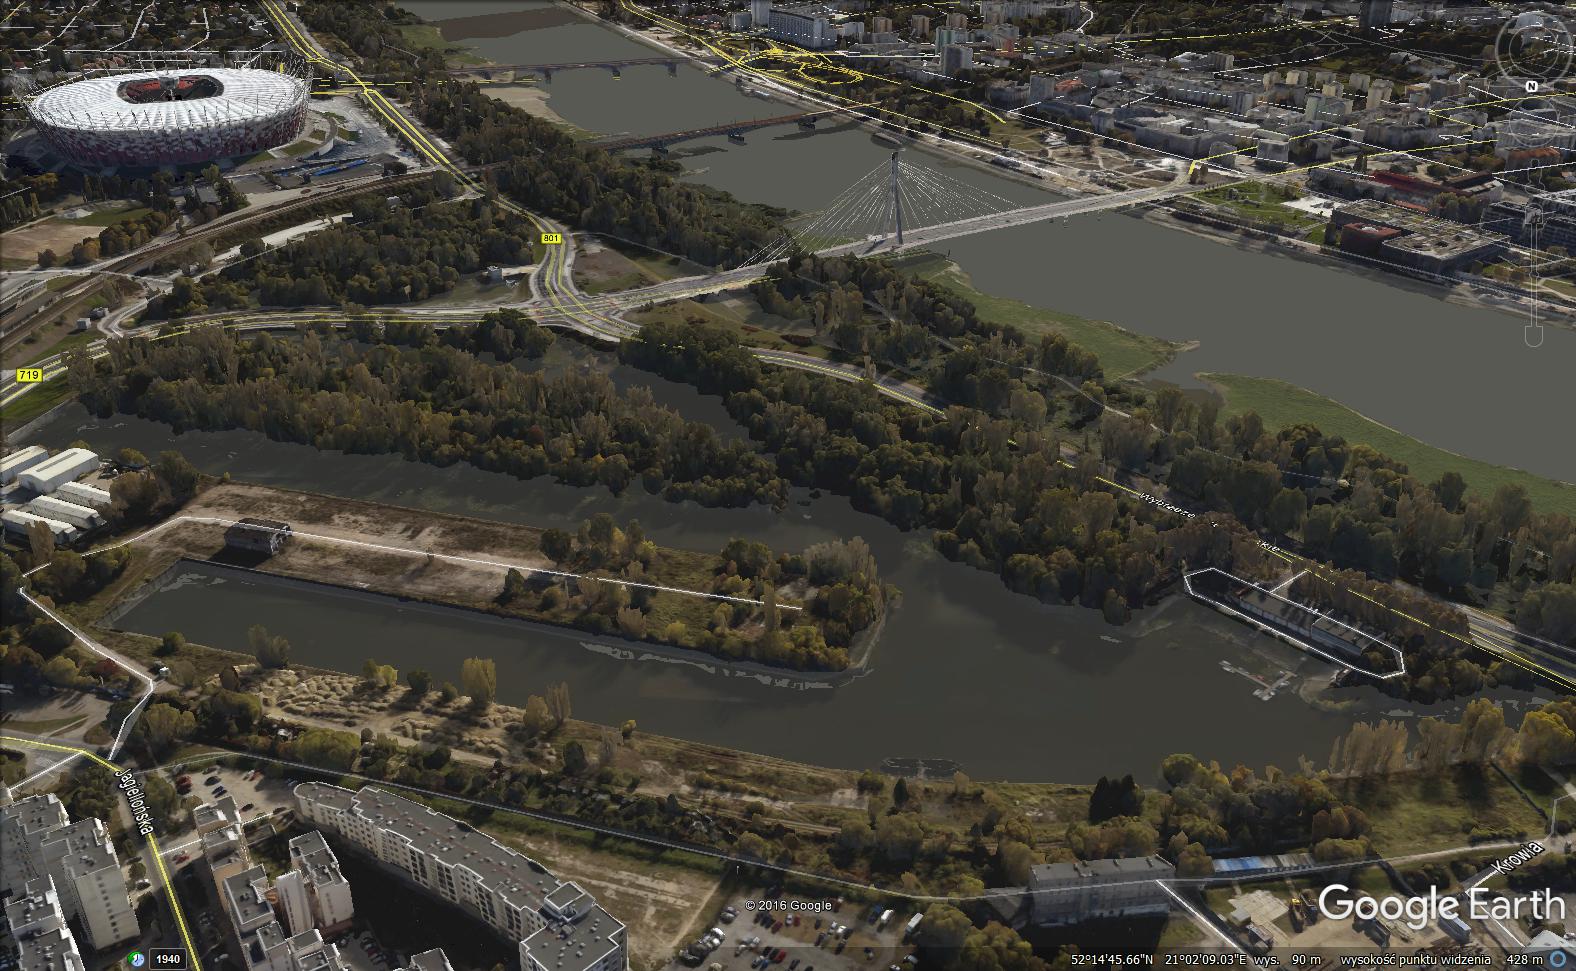

Pic. 21 – 23 Central Warsaw flood simulation with a view towards National Stadium and Świętokrzyski Bridge from the north-east: 1 – maximal flood, 2 – layer with receded maximal flood (40% opacity) + “current flood level” layer (100% opacity), 3 – no flood.
The area, which had been inundated remains silted when the flood recedes, so Pic. 22 shows clearly the relation between the maximal flood level (layer with 40% opacity) and the current flood level (layer with 100% opacity). The layer with 40% opacity shows us the flood’s effect in central Warsaw. Pic. 19 and 23 show the situation when the flood layer is equal to the altitude of the Vistula River water level – 78 m above mean sea level. According to historical measurements, the highest level ever recorded of the Vistula river – 863 cm was in 1844. Pushing the flood layer 9 m up we can see what the biggest flood in Warsaw could be like (Pic. 20,21) then.
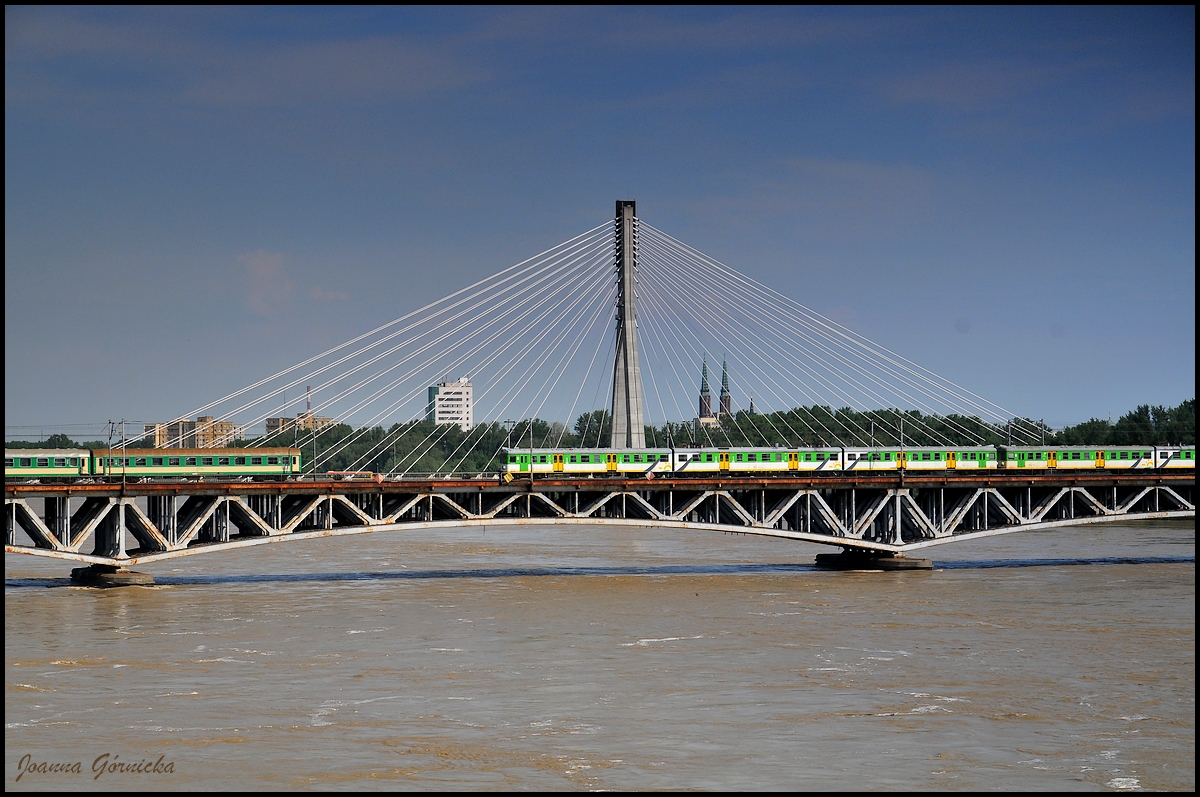
Pic. 24 Flood in Warsaw, June 2010 (photo by Joanna Górnicka, Panoramio.com).
The last big flood in Warsaw occurred in May and June 2010. The highest flooding level was recorded on the 22nd of May – 780 cm.
3. Dresden (Germany)
Dresden witnessed the biggest flood recently, in 2002 when the flooding level on the Elbe river reached 9,4 m and swamped the majority of the Old Town. Many landmarks were totally surrounded by water.
According to the Google simulation, it’s good to know, that the Elbe river water level is 104 m above mean sea level (in the vicinity of the Augustus Bridge). To illustrate the flooding level from 2002 we need to lift up our layer to 113 m.

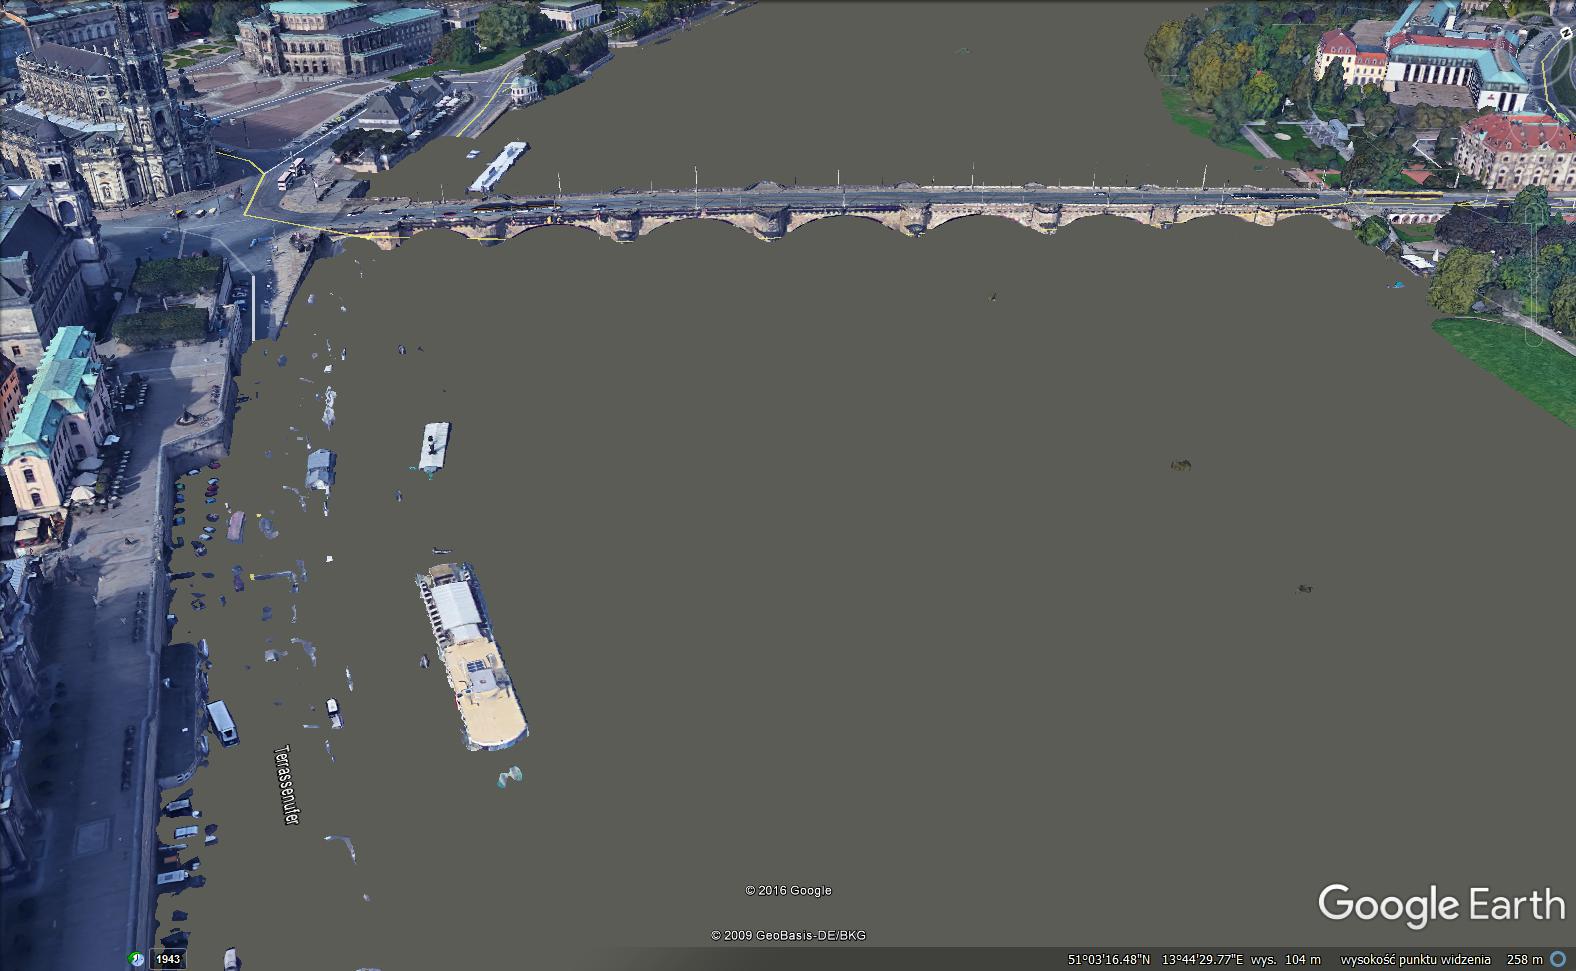

Pic. 25 – 27 Dresden flood simulation: 1 – no flood, 2 – flooding level 7 m, 3 – flooding level 9 m, that remains the flood in 2002.

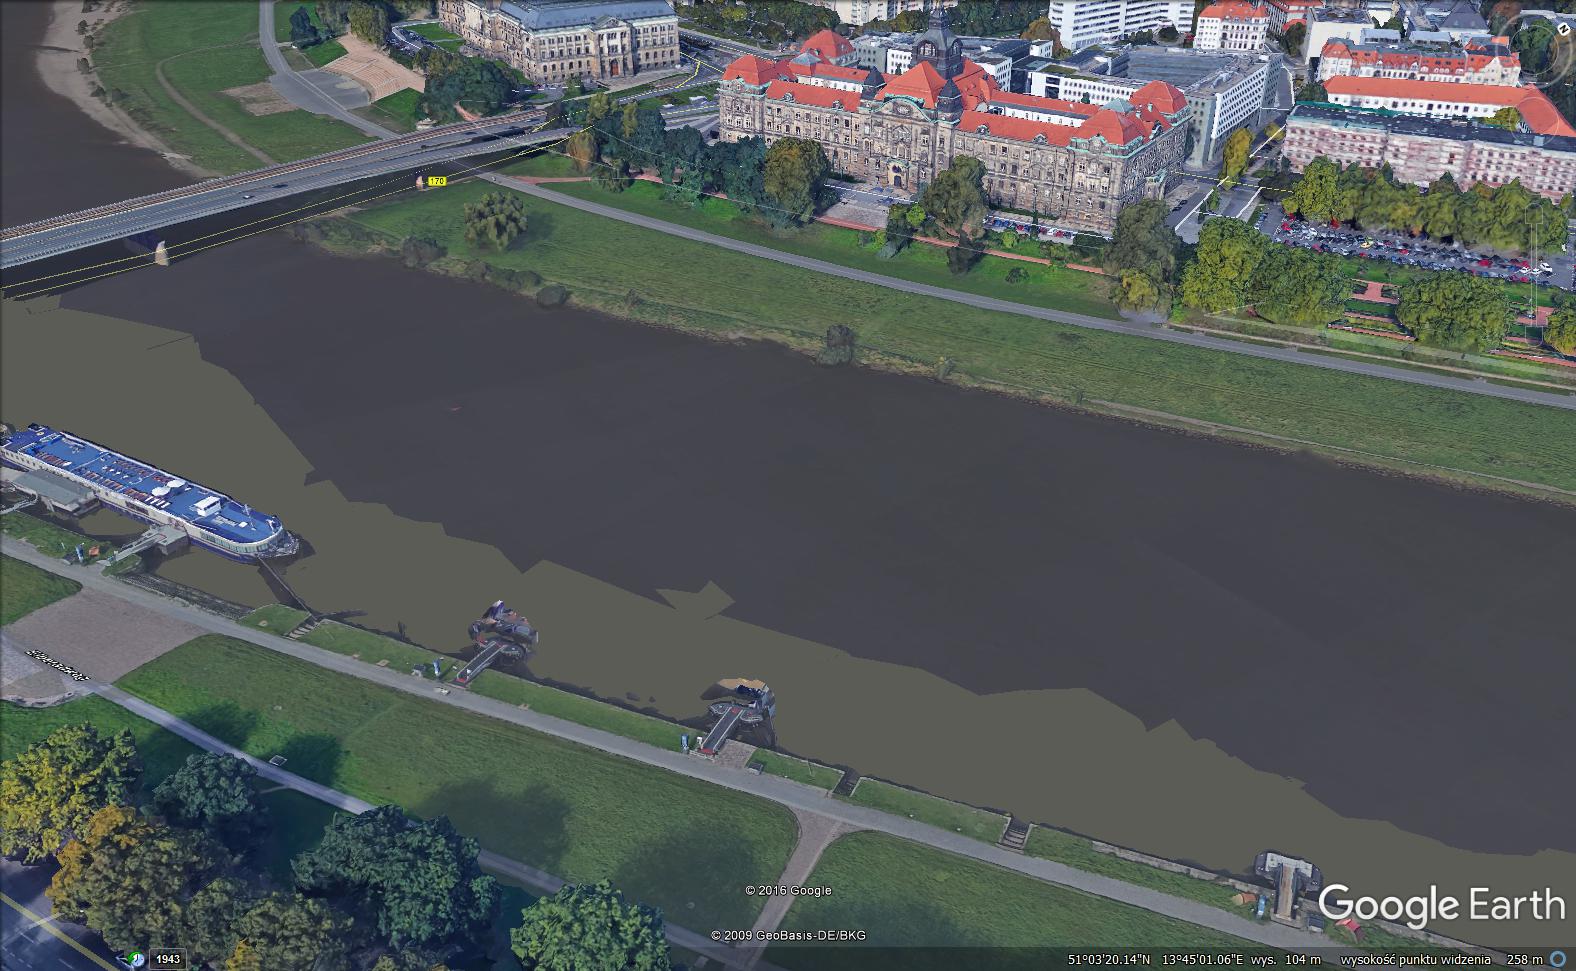
Pic. 28, 29 The flood effects in Dresden are displayed by 2 layers, where the lower layer (100% opacity) shows the actual water level and the upper, transparent (40% opacity) layer shows the maximal flooding level, that occurred.

Pic. 30 The Augustus Bridge clearly remember the biggest recent flood in Dresden.
All simulations have been collated in the animation below:
The water reservoir visualisation
The water reservoir visualization is a perfect way to simulate how your region could look when a water dam exists. There are many places in the world where countries and their governments are going to build new reservoirs to protect flooding areas.
I would like to give you an example of the Kąty – Myscowa water reservoir in southern Poland, which is to be built in the future. This project has been postponed several times, although the local inhabitants are aware that they will have to move somewhere outside the planned investment.
Kąty and Myscowa are two small villages situated inside the Beskid Niski range in the Wisłoka river valley. The top of the dam is planned to be 43 m in height, so basically, the newly created lake is going to reach Krempna, the capital of the Magurski National Park! (Pic. 32).


Pic. 31, 32 The water reservoir Kąty-Myscowa visualisation: 1 – before, 2 – after. The base is situated around 318 m above mean sea level so once the water level will be increased up to 361 m the bottom of the lake is going to reach Krempna village.
Taking into account, that the water level will not be as high as the top of the dam we can consider the 356 m as a main water reservoir level. In this case, the backwater will be situated around 1,2 km from the Krempna village centre (Pic. 33).

Pic. 33. The Kąty-Myscowa water reservoir visualisation when the water level altitude is 356 m.
Only the easternmost part of the Myscowa village (The Koniec Górny hamlet) should be untouched. In the heat of this situation, it will probably turn into a nice summer resort (Pic. 34, 35, 36).


Pic. 34 – 36. The Myscowa-Kąty water reservoir visualisation: 1 – before, 2 – after (361 m), 3 – after (356 m above mean sea level).
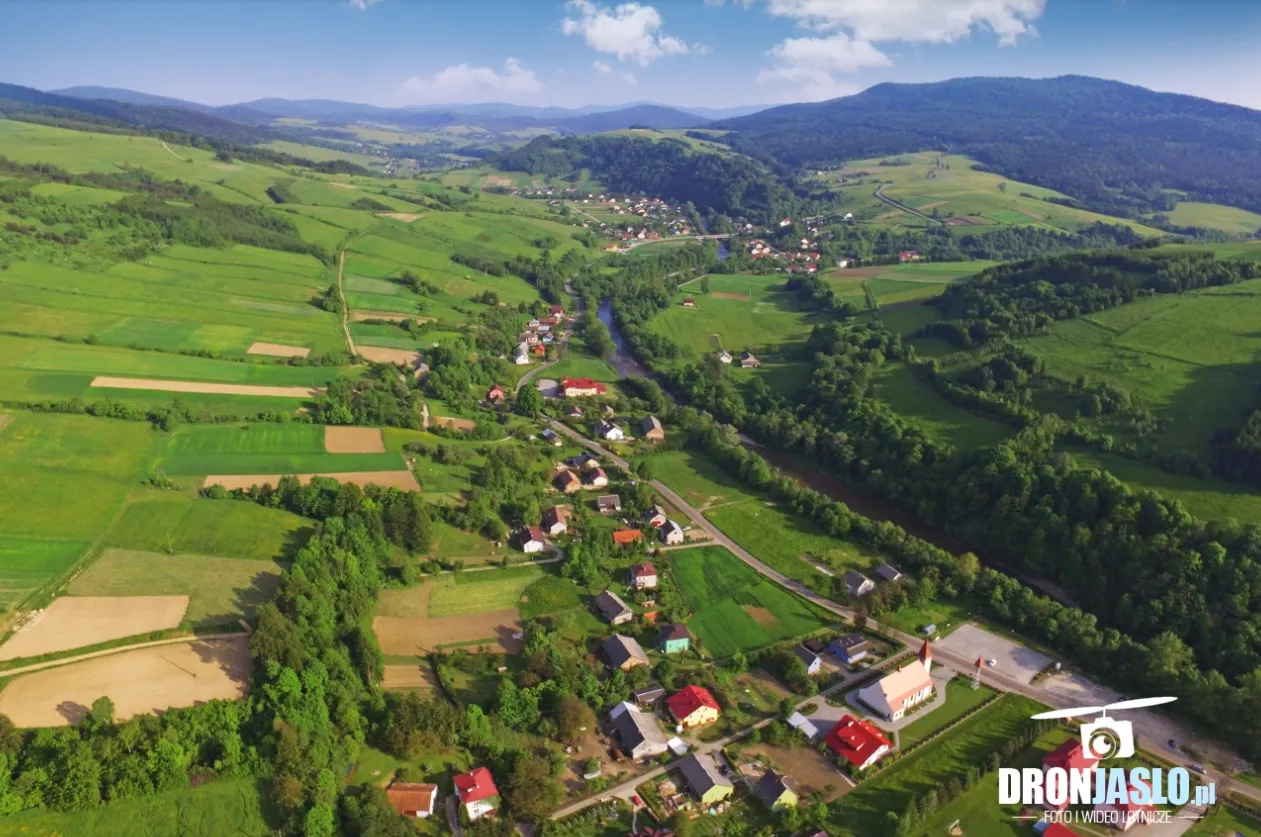
Pic. 37. The Kąty village and Myscowa village are beyond and are seen from the drone (dronjaslo.pl).
Unfortunately, the lack of a three-dimensional view of the small-sized areas outside the high-populated regions eliminates the opportunity for detailed simulation (Pic. 38). However, this is not needed when looking for this area on the macroscale.

Pic. 38. The inconsistency between the terrain declivity provided by Google Earth and local dip. The river bed is outside the inundated area.
Besides we should hope that 3D detailed coverage will continue to extend across the World.
Conclusions
The flood simulation through Google Earth is the easiest way to check the flood hazard in the area of your interest. Instead of advanced software, which demands proper GIS skills to manage the flood using digital terrain mode Google Earth gives you the quickest and the easiest way to do it. Unfortunately isn’t equally detailed against the professional GIS tools. The simulation of flood risk using the Google Earth software may be handy to seek alternative ways of communication and protection of urban areas in case of flood arise. The ease of the method should allow checking the flood hazard for everyone who uses Google Earth. Moreover, you can use this process to simulate the water reservoir in your interesting (mountainous) area.
Mariusz Krukar
References:
- Aleen Y Chang, et. al, 2009, Combining Google Earth and GIS mapping technologies in a dengue surveillence system for developing countries, (in:)International Journal of Health Geographics.
- Kennedy D., BishopM.C., 2011, Google Earth and the archeology of Saudi Arabia. A case study from the Jeddah area, (in:) Journal of Archeological Science, vol. 36, issue 3, p. 1284-1293.
- Lisle J.L., 2006, Google Earth: a new geological resource, (in:) Geology Today, vol. 22 issue 1, p.29-32.
- Martinez-Grana A.M., Cimera C.,A, Goy, J.L., 2013, A virtual tour of geological heritage: Valourising geodiversity using Google Earth and QR code, (in:) Computer & Geosciences, vol. 61, p. 83-93.
- Taylor J.R., Taylor-Lowell S., 2012, Mapping public and private spaces of urban agriculture in Chicago through the analysis of high-resolution aerial images in Google Earth, (in:) Landscape and Urban Planning, vol. 108, issue 1, p.57-70.
- Travis M.S, Lakshmanan V., 2006, Utilising Google Earth as a GIS platform for weather applications.
Links:
- High flooding level on the Vistula river in 2010 (Polish)
- Big floods in Warsaw – a history and threatened areas (Polish)
- Elbe flood in 2002
- Flood in Dresden, 2002
- Kąty-Myscowa – this reservoir has to be built (Polish)
- Will the Kąty-Myscowa dam investment start in 2018? (Polish)
- Flood simulation in Google Earth – how to?
- Flood in Google Earth
This article is great