
Maybe you were wondering about the possibility of transferring the legend from the QGIS print layout to Excel? This short text shows you how to do it, especially for the simple legend, which won’t last long. The tutorial is oriented toward not programming-savvy people, therefore please don’t expect any kind of automatization here. Of course, there are methods, that could allow you to render the legend accurately from the QGIS print layout, but I won’t focus on them. The sample solutions can be found here. My text explains a nice workaround by using a third-party tool, whose usability will depend on the legend circumstances in our print layout. My work, in fact, will play around with the most simple examples.
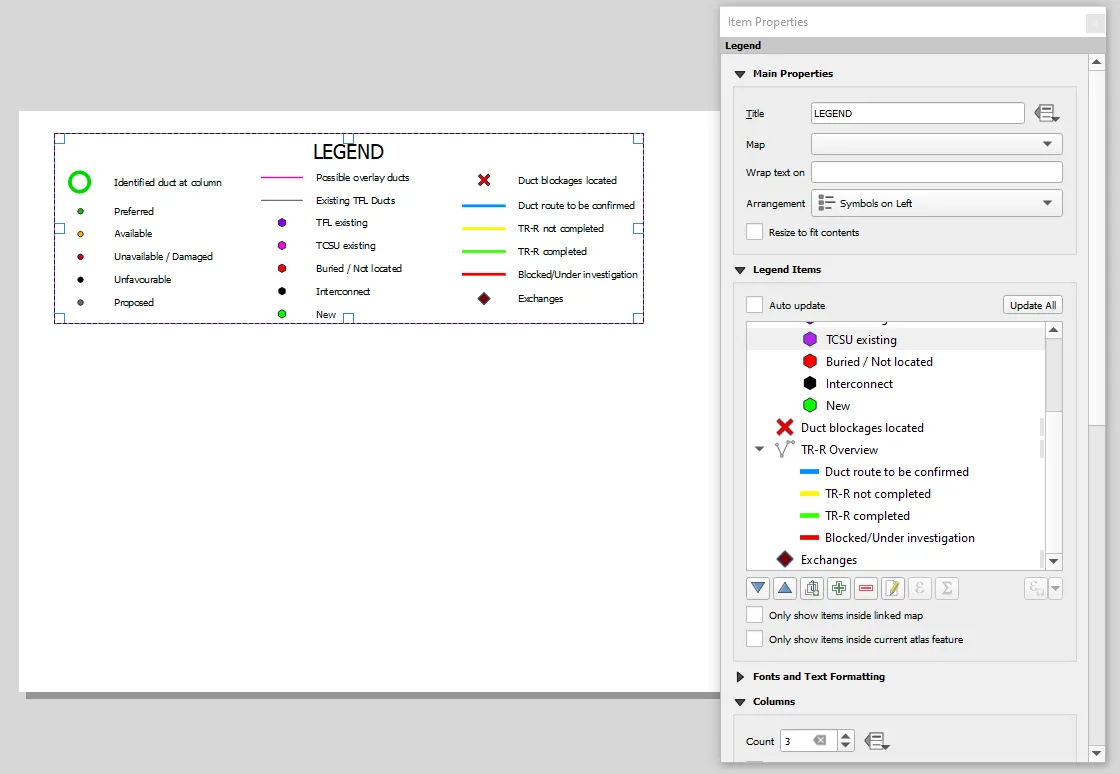
I assume, that you have already sanitized your legend and keep only the items you need on your map. It can be done by unticking the “Auto update” box and removing unwanted inputs by selecting them and clicking the red minus symbol (Pic. 1).
If you do so, then we can start transferring our legend item into Excel. The first example will be very simple. I will consider just a 1-column legend without any group headings.
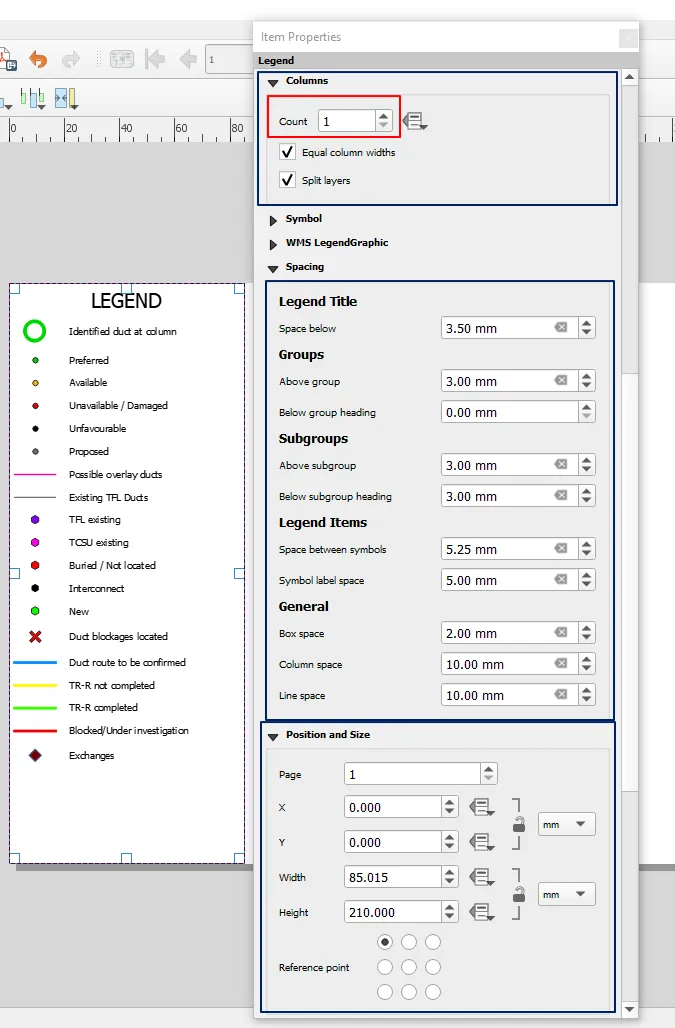
Any legend might require some quick alterations. In the case of planned usage of the easiest pattern of this legend in Excel we should take the following steps:
– set column counts as 1,
– set the proper spacing between the legend title, group & subgroup headings, and legend items. The total spacing must be adjusted to your page size. The legend object cannot exceed the page bounds. On the other hand, when the spaces between the single elements are too small, they might be congested in the Excel worksheet cells later,
– position of the legend doesn’t matter in this case the same as the arrangement of symbols.
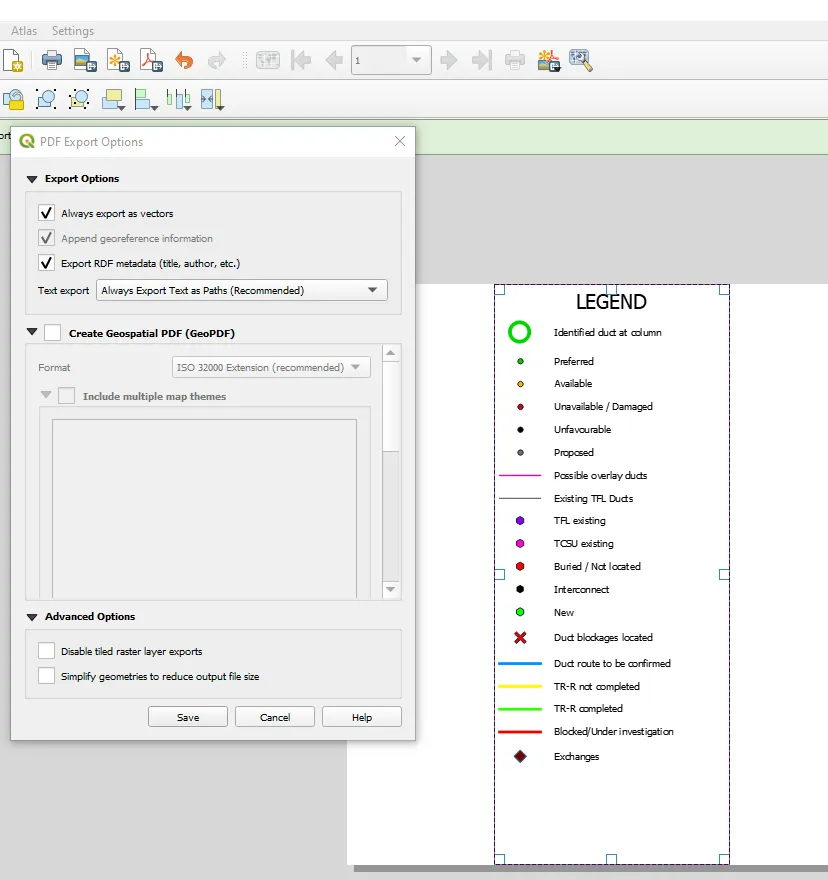
This is all, we can do in QGIS. Our next step is saving the legend as the .pdf file while keeping all the saving options as default (Pic. 3).
Our next step must be using the third-party tool, which is the file converter. There is a multitude of open-source tools available on the web, although not each of them provides correct conversion from our point of view. Basically, most of them are fine unless we deal with various tables, images, symbols, and so forth. The best one I’ve managed to find for the following exercise is pdf2go.com.
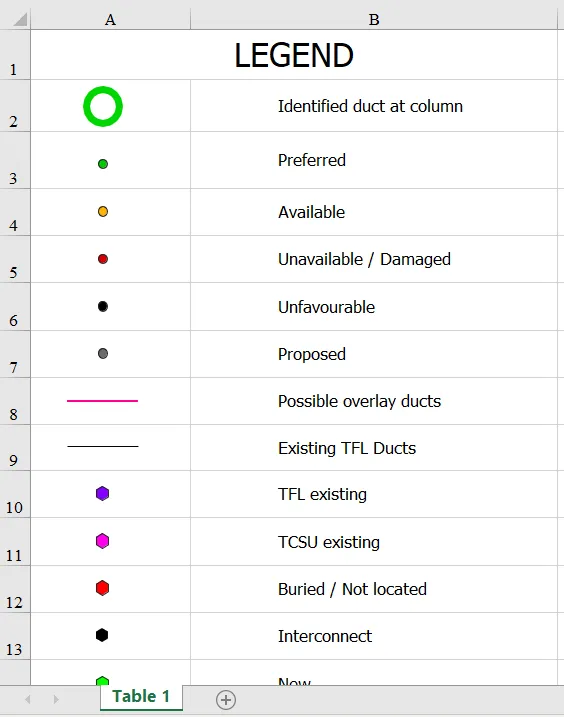
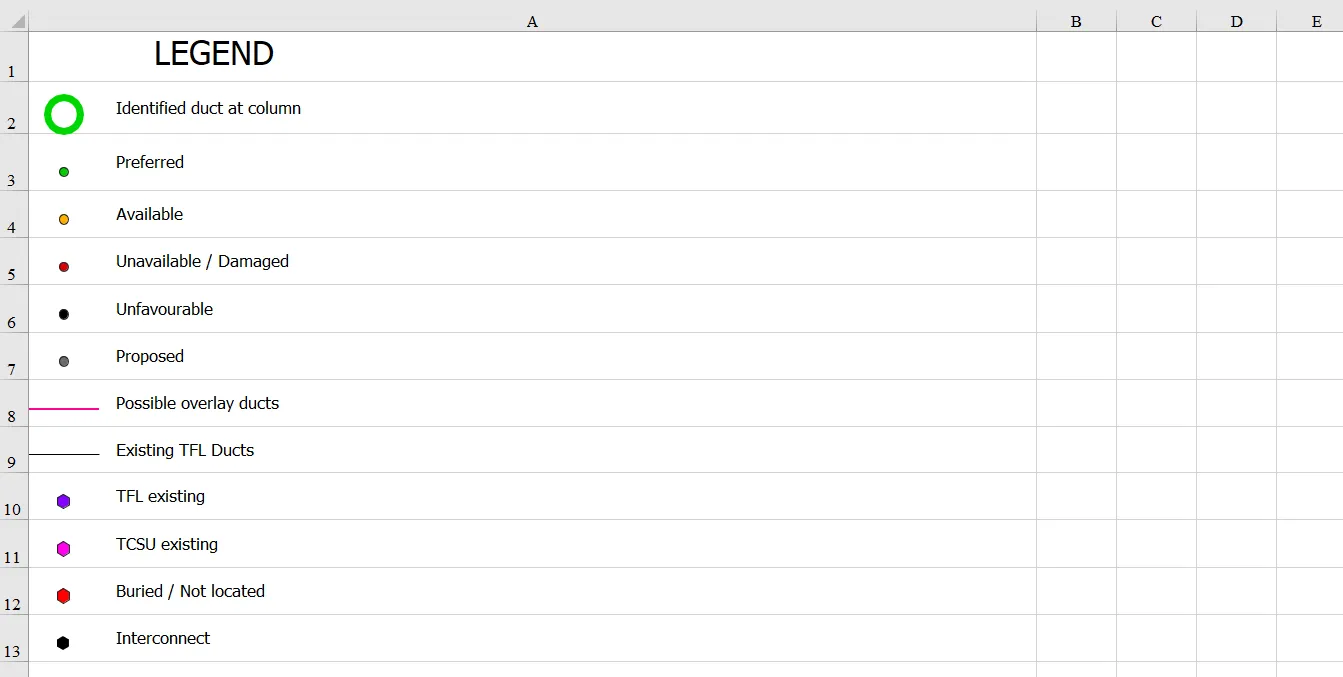
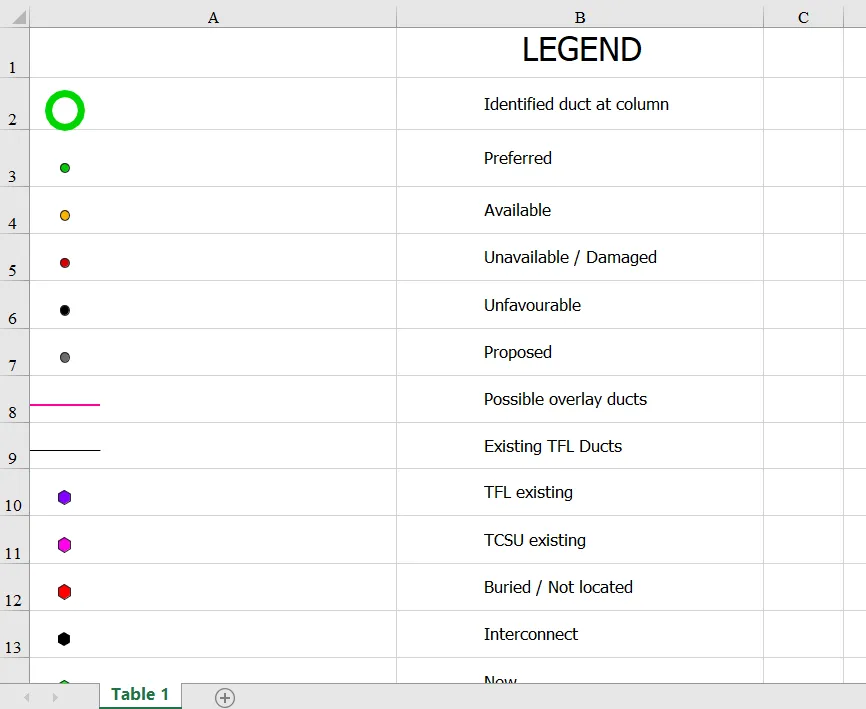
After the successful conversion of your file, the legend in Excel should look as below:
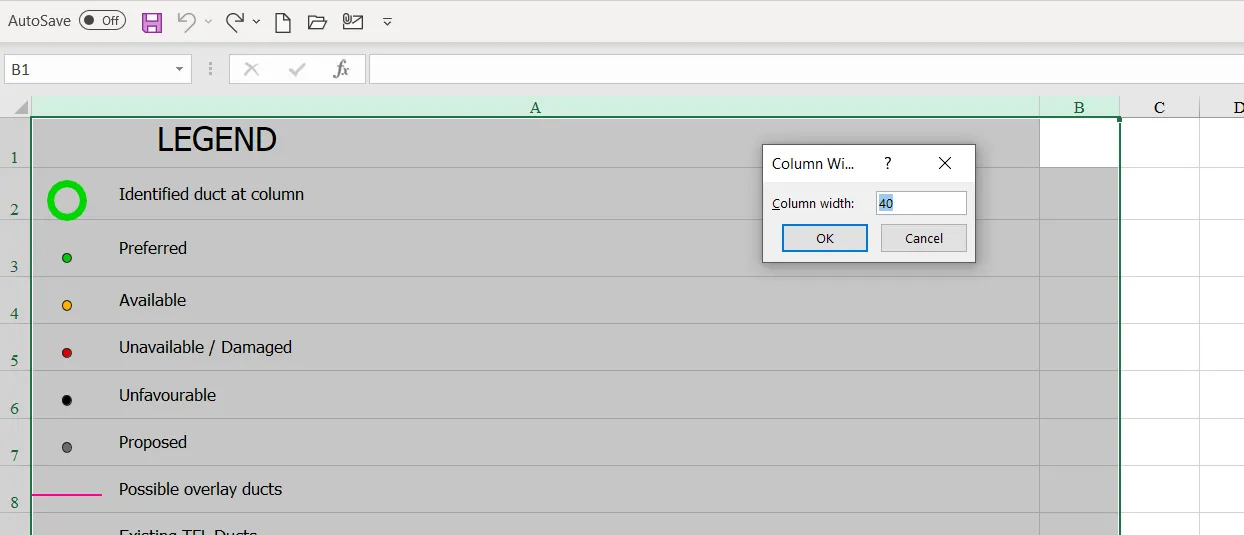
where the first column is very wide. We don’t need a width like this, so it can be reduced from 111 to 40 when right-clicking and selecting “Column width”. This parameter can be set both for columns A and B (Pic. 5). However, doing it just for column A will still be enough. The major problem here is the location of both symbols and their descriptions in the same cell. You probably would like to have them separated. That’s why 2 columns must be used here.
Next, we can replicate the content from column A to column B (Pic. 6). When you haven’t changed the column B width earlier, now it should go automatically with the standard pasting of your data (Pic. 6).
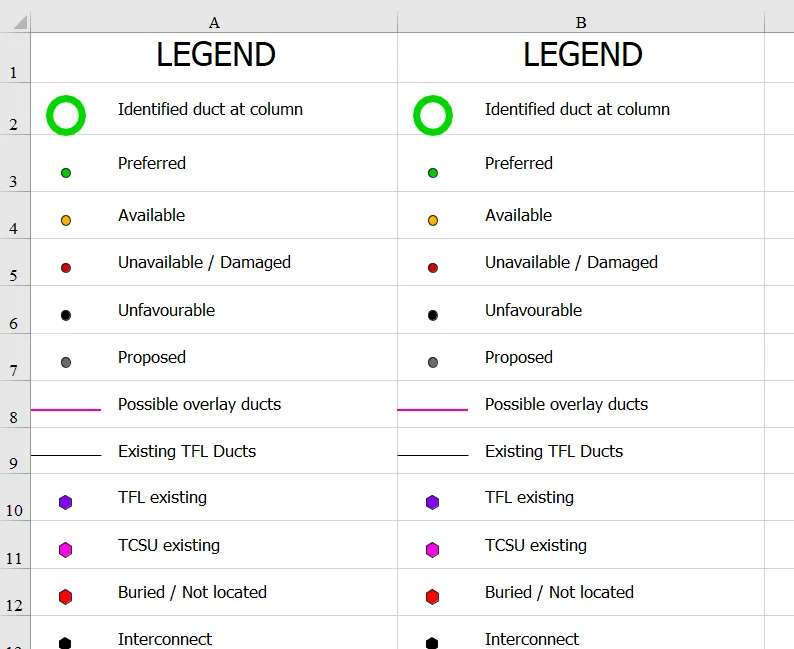
Why is this duplication for? We will store symbols in one column and their descriptions in another one.
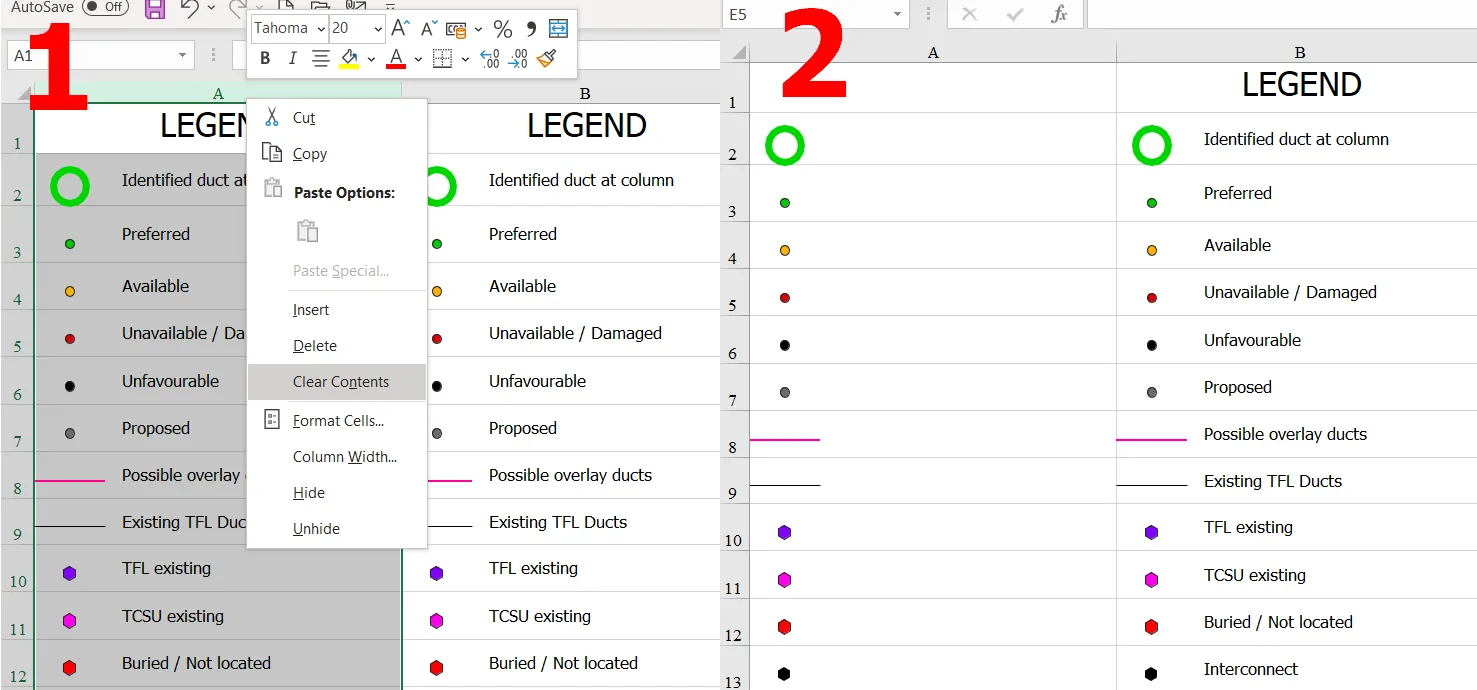
Now, from column A we can clear text by choosing the “Clear contents” option after the right-click on selected column A (Pic. 7).
In column B we need to delete the shapes. It’s not unfortunately the thing, which could be done just in Excel, so we should use the piece of VBA code for this purpose. The code can look like this:
Sub RemoveObjects()
Dim Sh As Shape
Dim ws As Worksheet
Dim LastRow As Long
Set ws = ActiveSheet
LastRow = ws.Cells(ws.Rows.Count, "B").End(xlUp).Row
With ws
For Each Sh In .Shapes
If Not Application.Intersect(Sh.TopLeftCell, .Range("B1:B" & LastRow)) Is Nothing Then
Sh.Delete
End If
Next Sh
End With
End Sub
and it should erase all objects that fall inside the B-column bounds down to the last row.
The code works regardless of the sheet name, which after the conversion is called “Table 1” instead of the default “Worksheet1”.
Another step we should do is the adjustment of the remaining objects on our left in column A. Their position is uncomfortable, as they are placed just near the column edge.
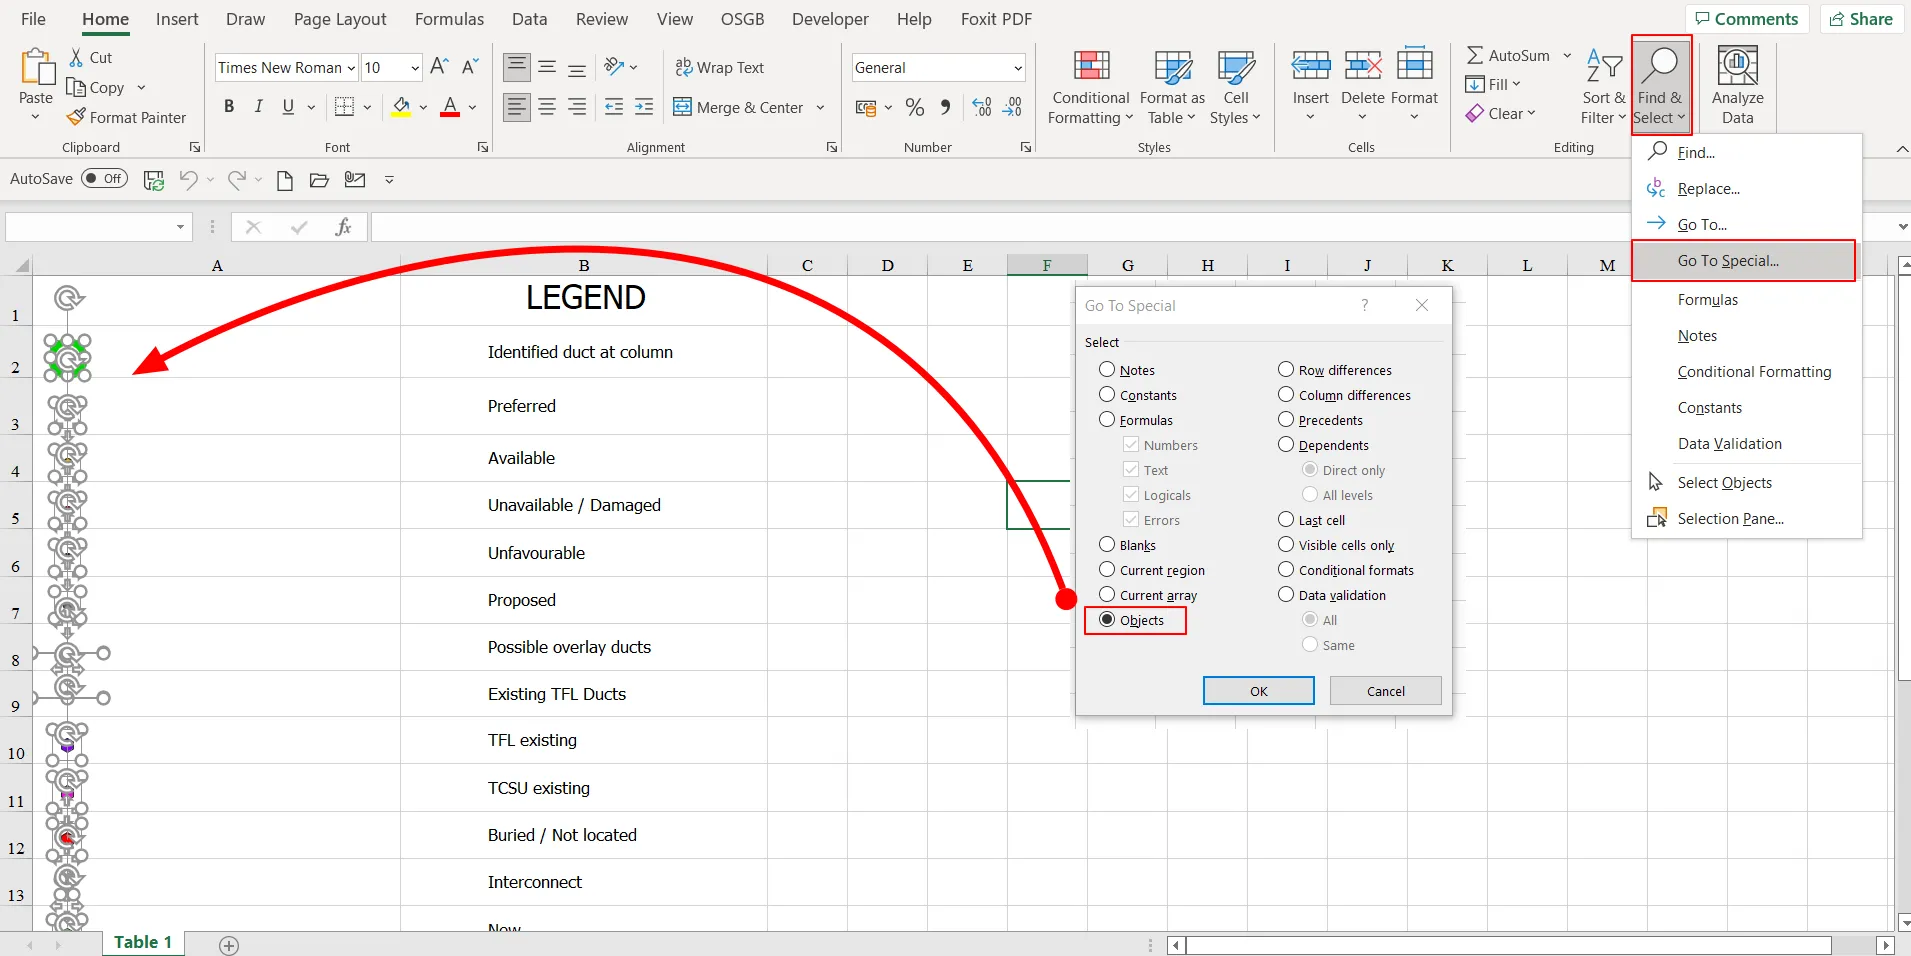
In this case, in our Home section, we should drop down the “Find & Select” panel and choose the “Go to Special” option, where we pick up the “Objects”. After clicking OK we can see all our objects selected, thereby they became movable in one piece, what exactly we need! (Pic. 9).
After adjusting the final position of the object’s row, we can reduce the width of column A and merge row 1 with the “LEGEND” title. Our legend is done! (Pic. 10).

Now is the time for a bit more complicated example, which will include the group and subgroup headers.
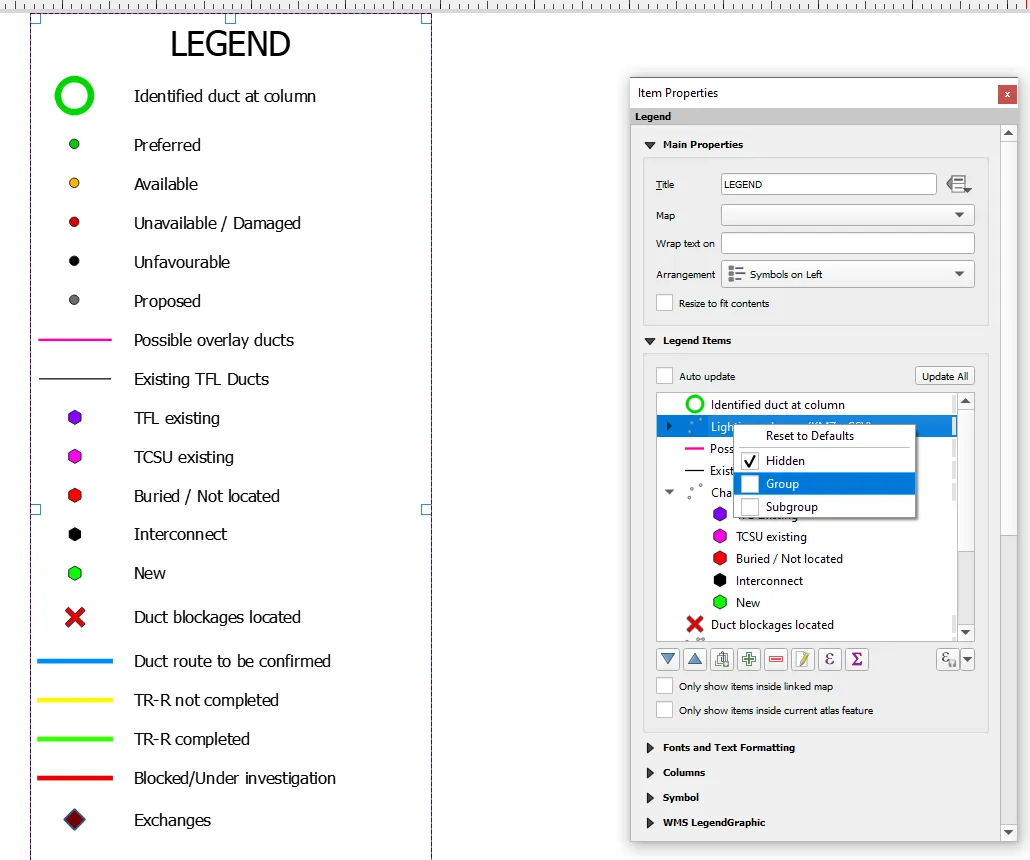
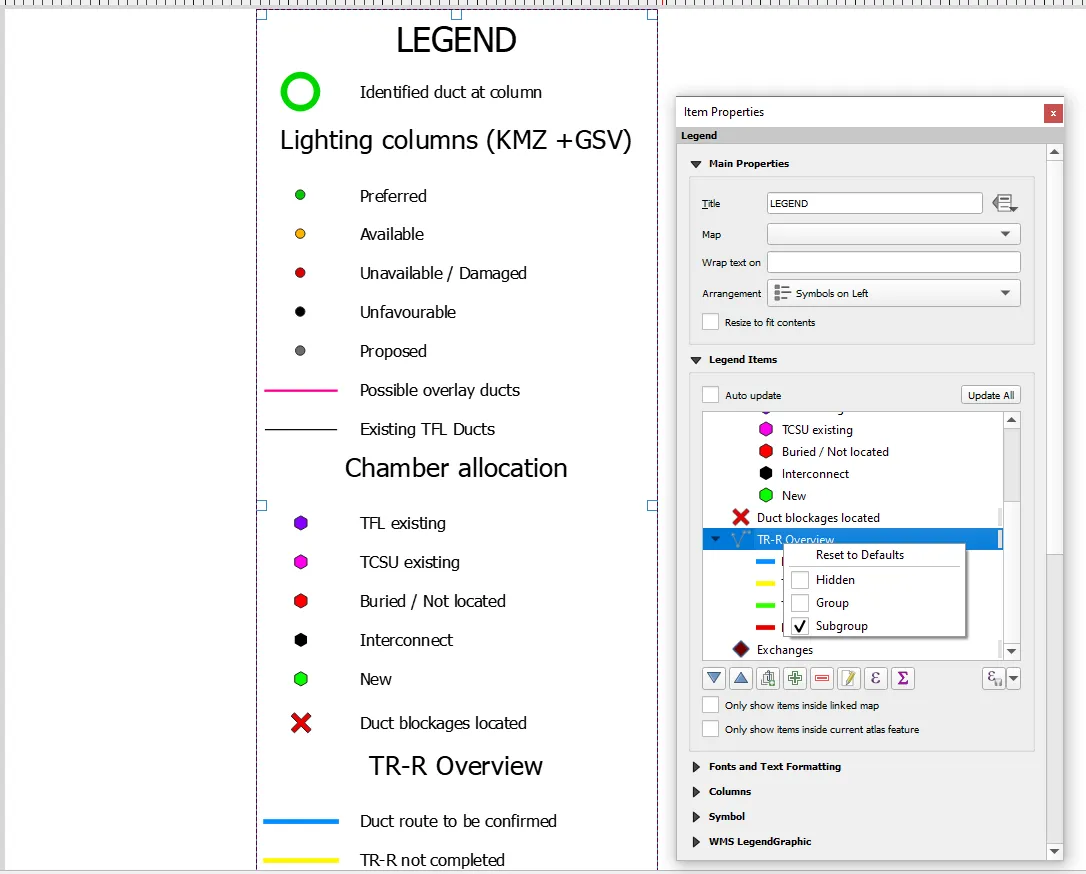
There is an option in our print layout legend item properties, where we can define the visibility of group or subgroup headers (Pic. 11, 12).
When applied, they appear somewhere in the center of our legend width and between the particular item groups, which are divided by them. The situation becomes complicated in Excel, where unlike previously everything was falling in a separate cell, now the subgroup headers appear in the same cell which is placed just after the line break. In turn, the default row height disrupts the alignment of some of the objects (Pic. 13).
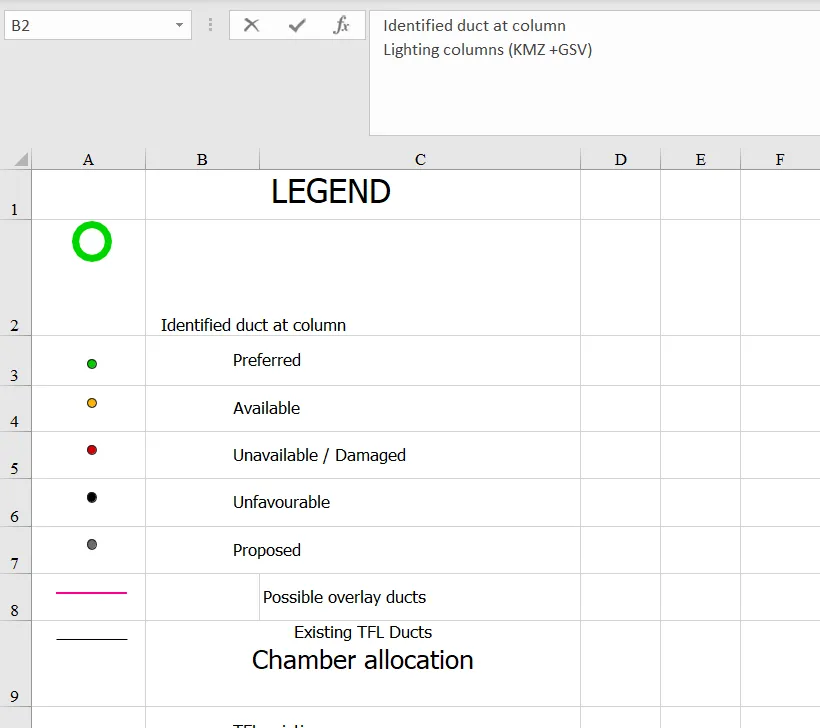
In order to fix this affliction, we should use the “Text to columns” option and pull these headings over from the items descriptions row. First, make sure that all your columns are unmerged. Sometimes the conversion tool throws merged columns in the rows including the subgroup headers (Pic. 13).
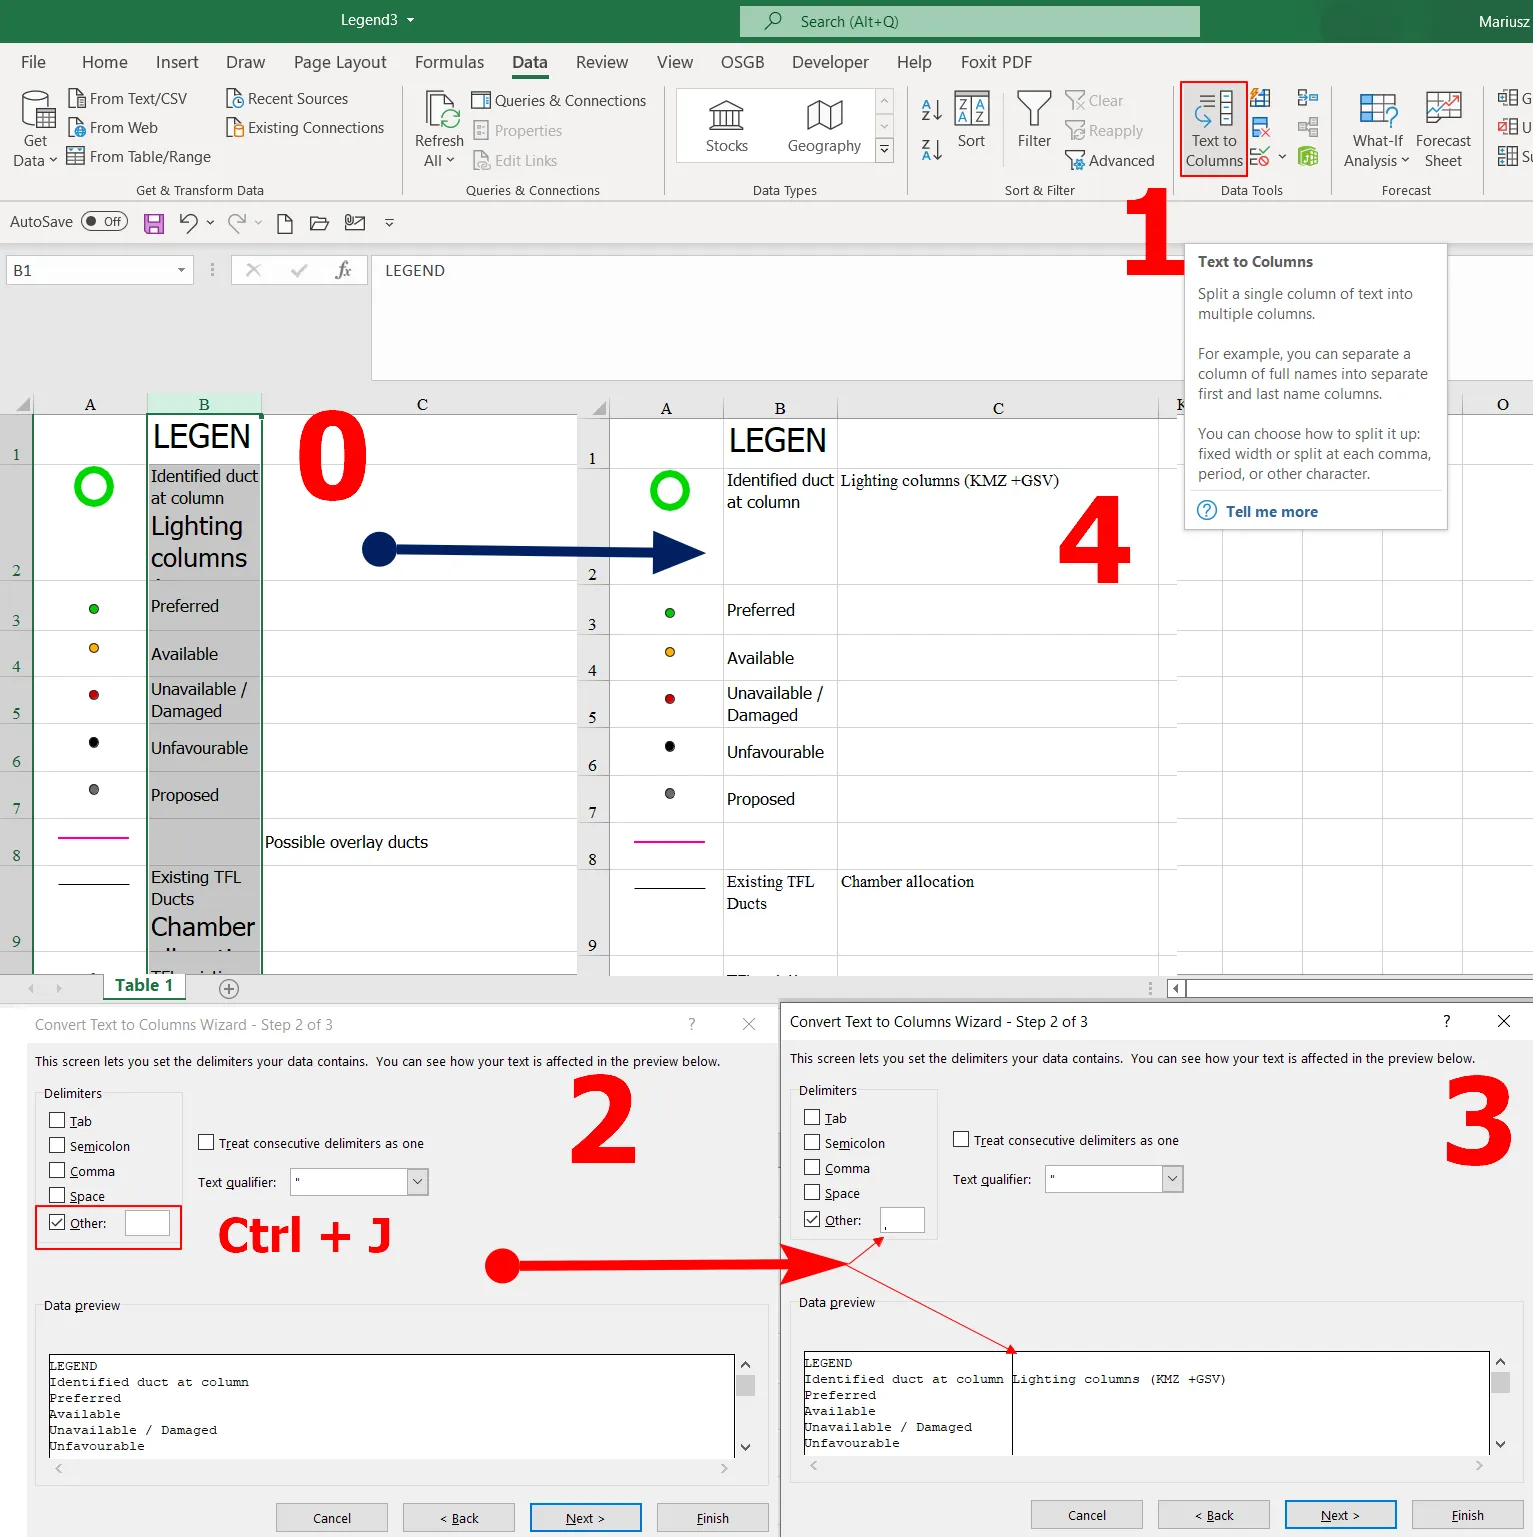
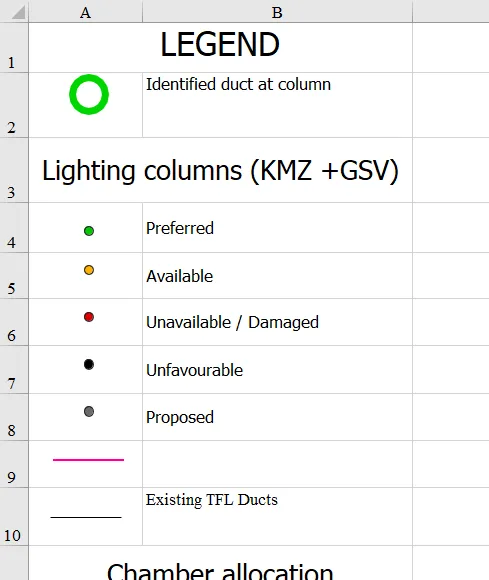
Next, we should follow the image above (Pic. 14), where our criterion will be simply the break expressed by the Ctrl + J shortcut. The result is immediately visible in our insight section beneath. Moreover, in the box, you should see some blinking dot meaning that everything is fine. After validating this way, we should have the headings on the following column. Unfortunately, this method doesn’t transfer the font formatting, so it must be done separately.
The remaining parts of this exercise are manual work, however, it can be done quickly. It includes:
– insertion of new rows where the subgroup headings are to be placed
– alignment of some objects
– using format painter in order to retrieve the initial font transferred from QGIS
– bulk adjusting the row height (optionally).
Anyhow, the final version should look pretty much as below:
As you can see the process of transferring the legend from QGIS print layout to Excel is doable, although valid just for simple examples. More complicated cases definitely require programming skills, especially Python, which is widely used in QGIS.
Mariusz Krukar
Links:
- https://docs.qgis.org/3.22/en/docs/user_manual/print_composer/composer_items/composer_legend.html
- https://www.pdf2go.com/pdf-to-excel
- https://www.extendoffice.com/documents/excel/714-excel-delete-all-auto-shapes.html
- https://www.automateexcel.com/how-to/text-to-columns-line-break/
Forums:
- https://www.mrexcel.com/board/threads/how-to-delete-objects-in-specific-range.366121/
- https://forum.ozgrid.com/forum/index.php?thread/1228094-delete-shapes-in-specific-column/
- https://www.mrexcel.com/board/threads/excel-vba-delete-shapes-in-a-range.81462/
My questions: