
Transfer AutoCAD drawing to ArcGIS Online part II
The previous post explained to you the simplest way of migrating the AutoCAD drawing to ArcGIS Online. It included the important bits like the AutoCAD layer extraction as well as its further import to QGIS. In fact, this is the section, that doesn’t change, so if you are not familiar with it jump to the first part of this topic.
In this text, I will focus on preparing the AutoCAD drawing upon its loading to ArcGIS online. This step requires an additional 3rd party tool, which in this case is QGIS.
AutoCAD drawing includes symbols, which come from user-defined palettes or are created ad-hoc from the drawing panel. The crucial thing is, that all these shapes are rendered accurately in the DXF format. A situation such as this can be troublesome especially in the situation when we are facing a geometry mismatch in QGIS. The DXF format includes only vector data and attributes because the format was dedicated to data interoperability between various GIS environments.
In the same manner, the AutoCAD symbols will be imported to QGIS. They can look even worse, when including text labels, etc. Moreover, the AutoCAD layers usually come in a holistic sense, which means, that the linear layer is not just purely linear. It might include also a bit of label, points, etc., which will be displayed later in QGIS (Pic. 1).
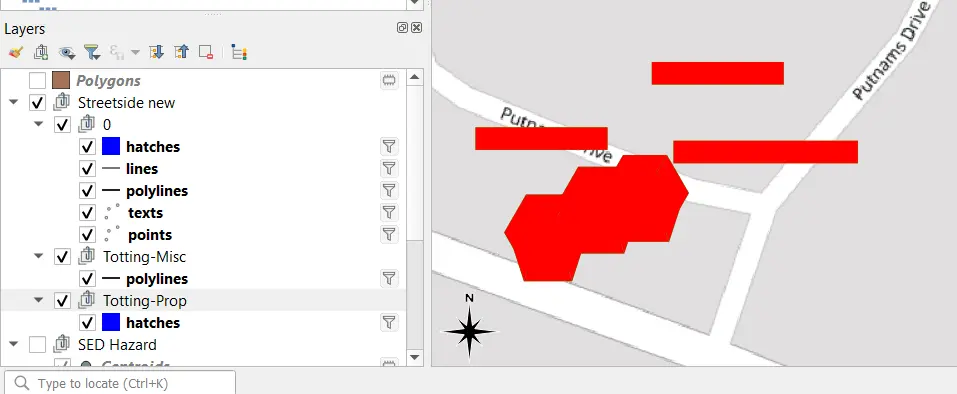
Pic. 1 Weird shapes as a result of importing .dxf file to QGIS from AutoCAD. One layer might include more than one element with different geometry.
First, what is advisable to do is selection of the layers, which are certainly needed for our further work. The simplest approach for it can be switching off each of them until the necessary one is encountered (Pic.2).
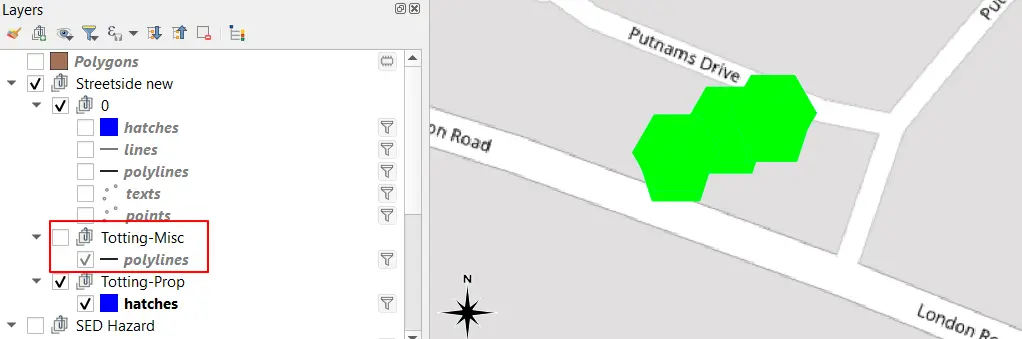
Pic.2 QGIS – Selected layer imported from DXF
As has been told earlier, the .dxf file includes the AutoCAD symbology, which is later pulled into QGIS. In the case shown above (Pic.2) we can see exactly this situation. As long as the objects stay far away from each other it’s fine. Sometimes they are close enough to be bound as one. Before the Processing Toolbox algorithms will be used we need to seclude them unless it’s another layer available, which potentially could help us omit this stage (Pic. 2). The images above show all the layers derived from our AutoCAD drawing (Pic. 3) which must be investigated prior to any other step. Because our QGIS layer group includes more than 1 layer matching our AutoCAD drawing (Pic. 3) we should have considered all of them.
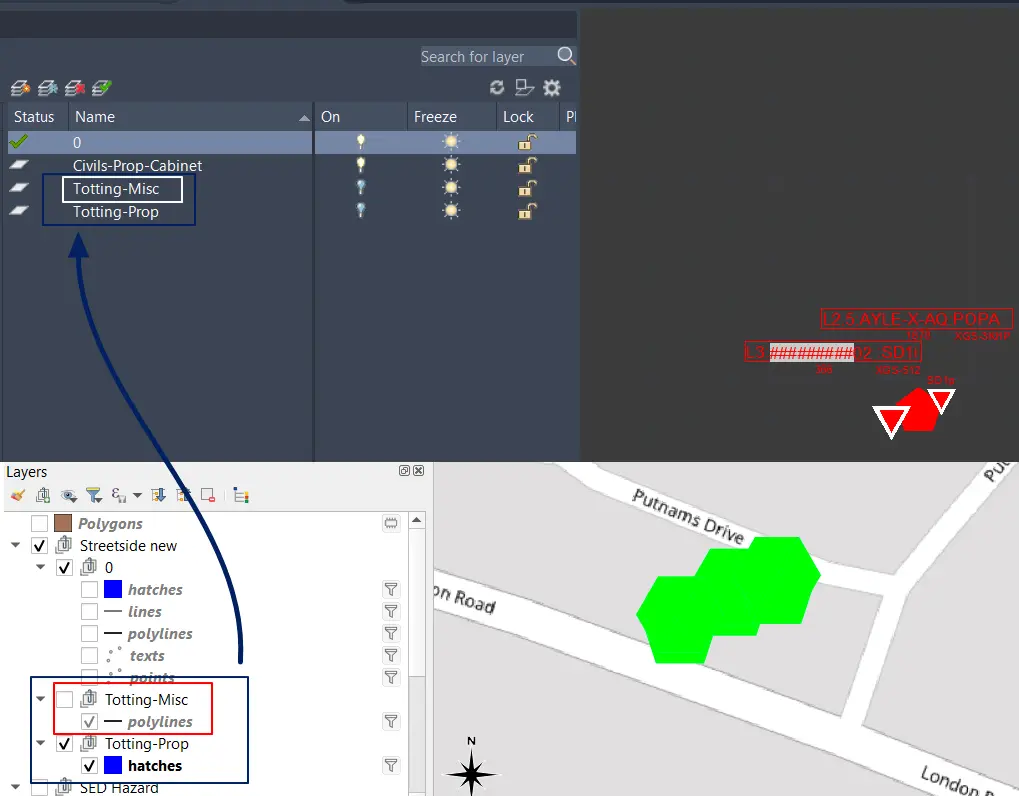
Pic. 3 AutoCAD layers in QGIS layer group after importing the .dxf file. The names of subgroups in QGIS reflect the names of layers in our AutoCAD drawing.
When at some point some of the examined layer isn’t visible at all, we should export it (preferably) to the shapefile (.shp) format. This file format is a good remedy for most situations such as this. If it’s successful, the layer comes out (Pic. 4).
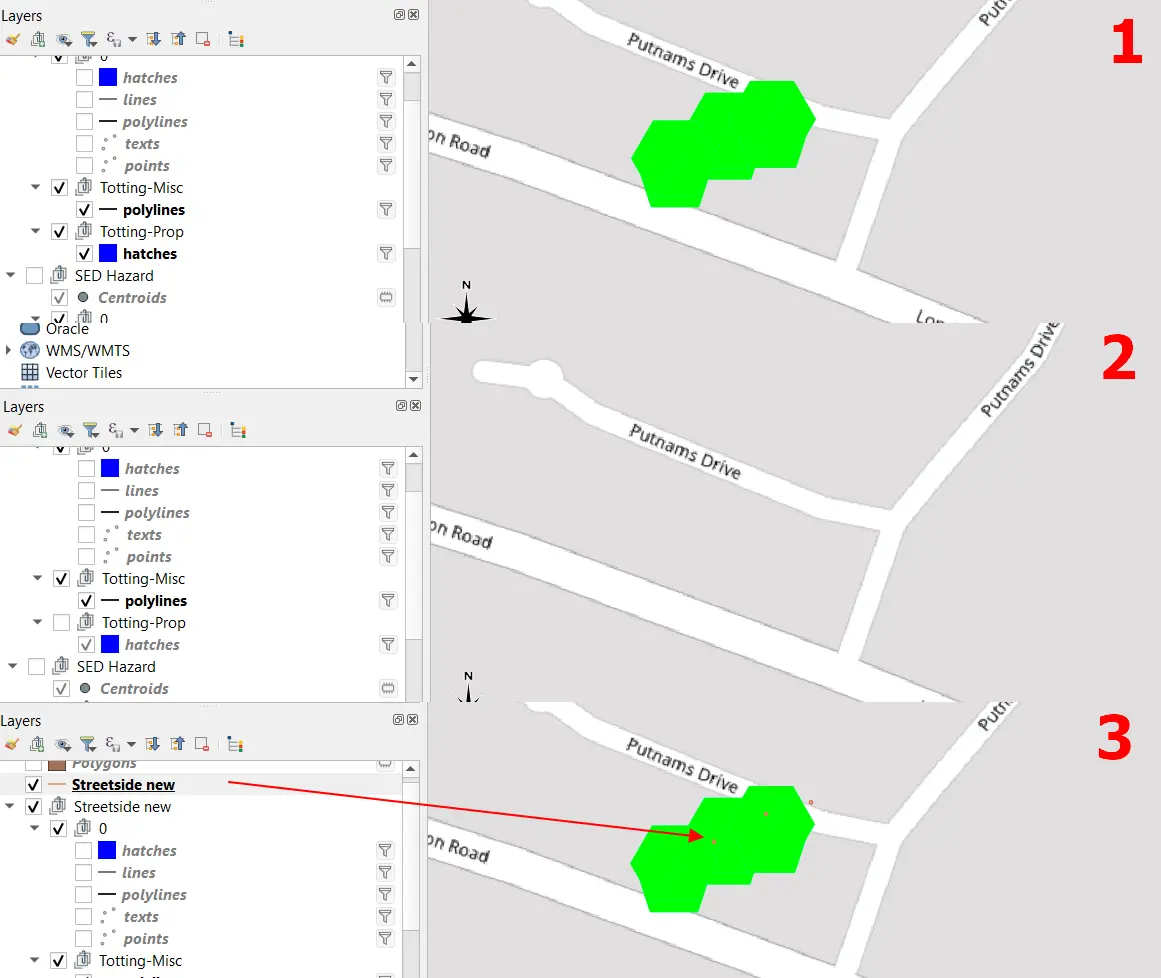
Pic. 4 Saving imported .dxf layer as shapefile in QGIS.
You must right-click on the imported layer from AutoCAD LT -> Export -> Save feature as -> and select ESRI Shapefile format.
The layer will come out with visible items, which can be left alone later on by switching all other layers off (Pic. 5).
Pic. 5 The point layer imported from the .dxf file into QGIS.
Now we are facing the issue of geometry. Our goal is to have the point layer, whereas the “point” symbol migrated from AutoCAD is exposed as the linear layer. It represents linear enclosed circles (Pic. 5). For this reason, we would need to use two algorithms from the Processing Toolbox panel. The first one is Polygonize, and the second one will be Centroids.
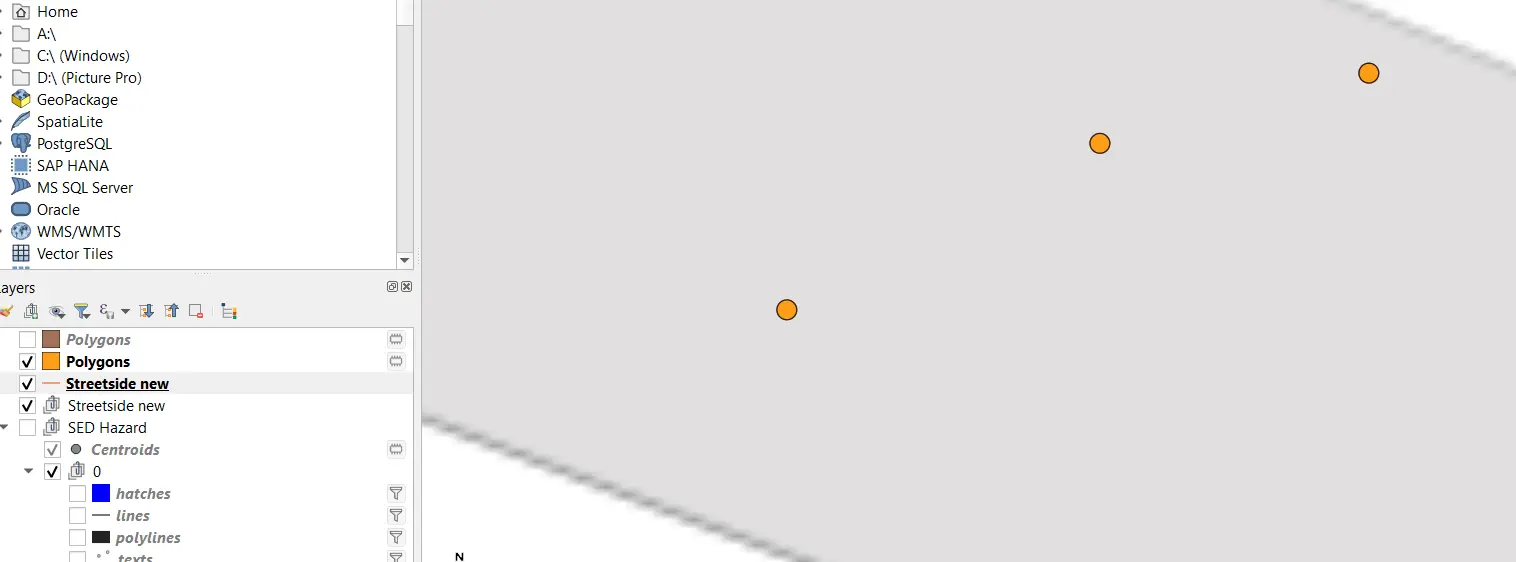
The given tool can be found by starting typing in the search box (1). Another important thing refers to the Input layer at the moment when the tool pop-up window comes out. The proposed (default) input layer will always reflect the layer being selected in the Layers panel (2) especially when the Edit mode is turned on (although it’s not needed). In turn, using the Polygonize tool is just hitting the “Run” button (3)(Pic. 6).
6. Polygonizing layer in QGIS.
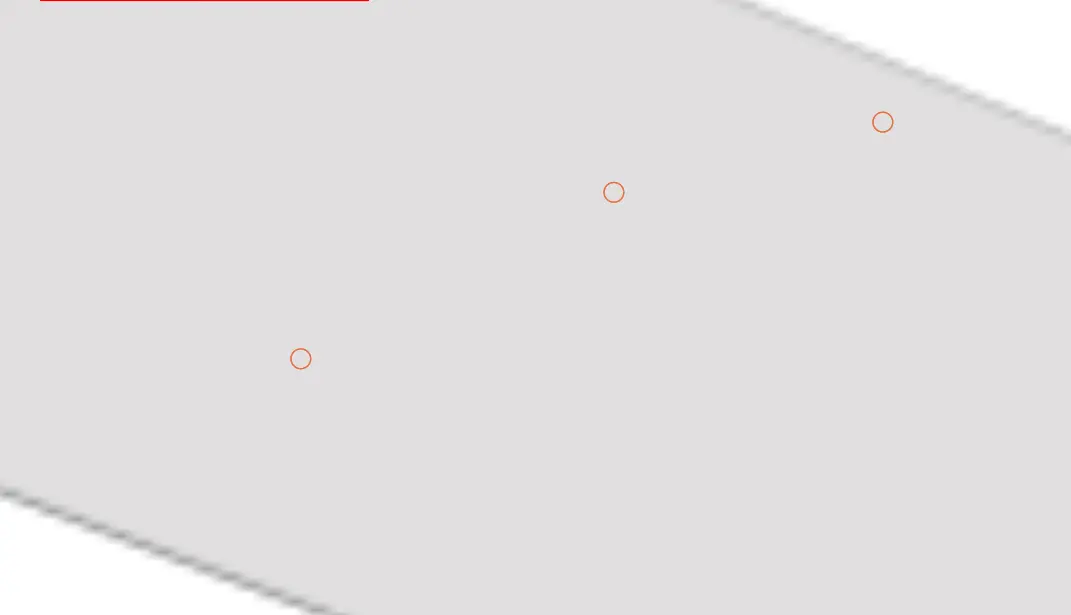
When executed successfully, we should see both new temporary polygon layers in our Layers panel (called “Polygonized“) as well as on the major map canvas (Pic. 7).
Pic. 7 Polygonized layer in QGIS.
Before I jump to extracting points from polygons it’s important to flag up another situation, which might occur. Quite often the linear layer comes separately as “lines” and “polylines” (Pic. 8).
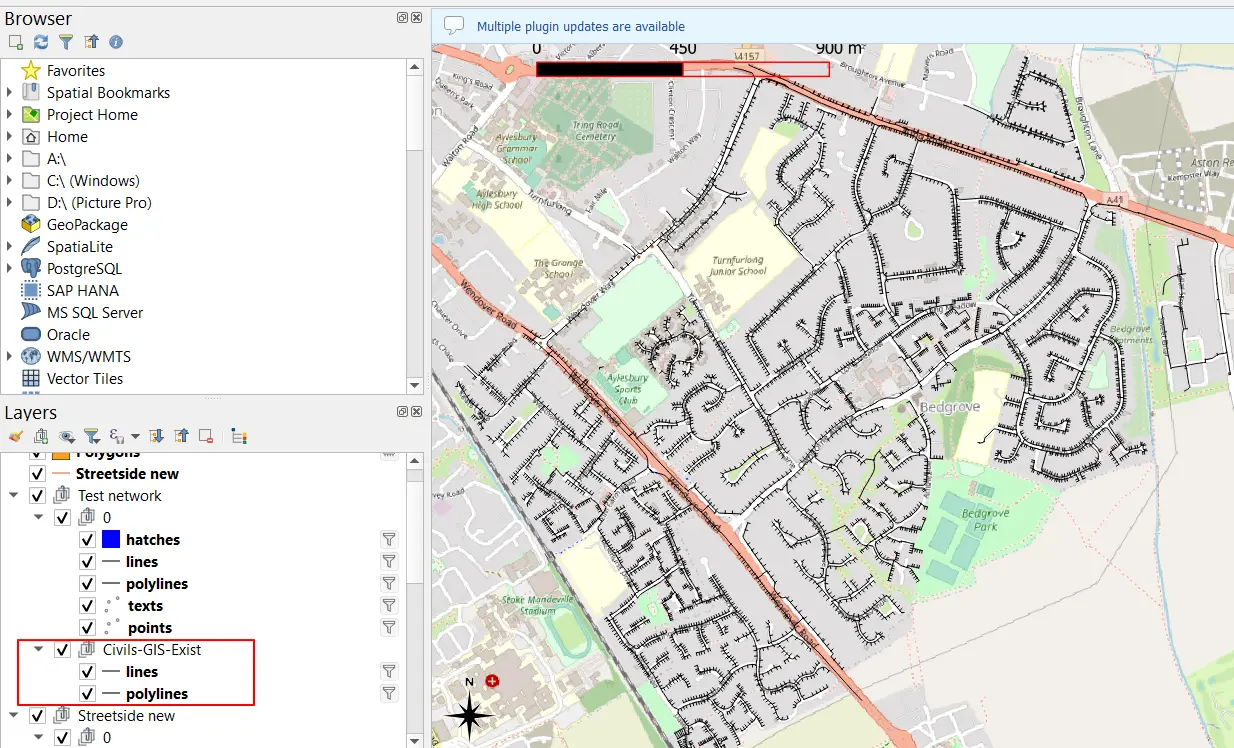
Pic. 8 Separated linear and polylinear layer in QGIS.
They must be merged. As we might have several separate “lines” and “polylines” across our list of layers in QGIS, it would be good to rename the ones, which are assigned to the layer we want. The name of the layer can be changed easily by right-click -> Rename. Next, they appear under the new name and are better recognizable in any layer list wherever considered.
The merging tool can be found in the Main bar -> Vector -> Data Management Tools -> Merge Vector Layers. Next in the Input layers, you can easily find the layers needed for the final one (Pic. 9).
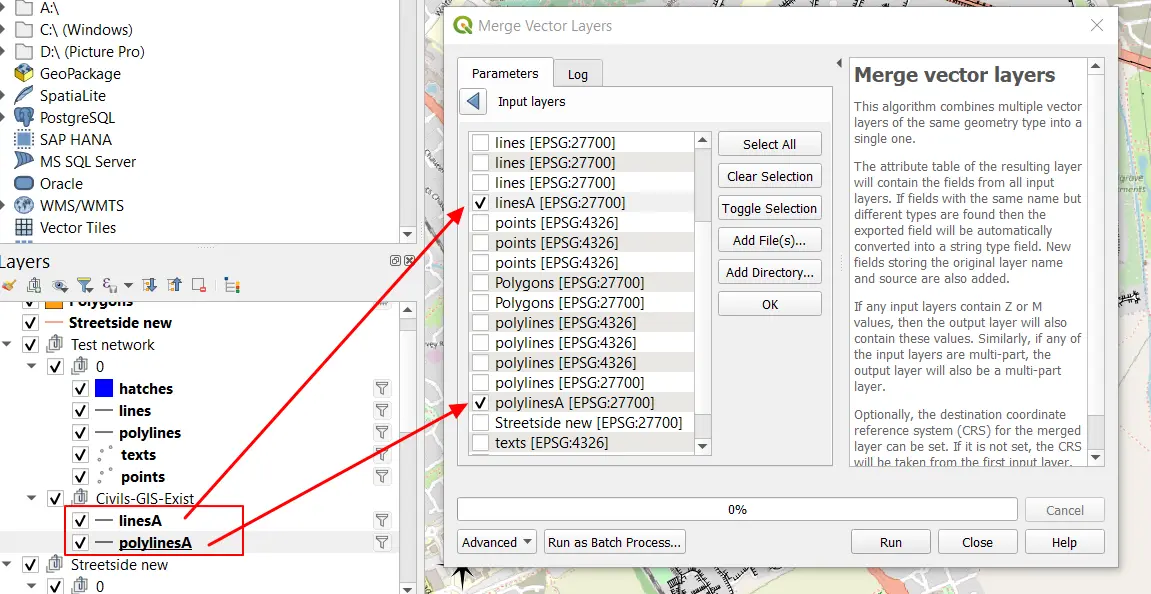
Pic. 9 Merging linear layers in QGIS.
Once the process is completed, the Merged temporary scratch layer will appear in our QGIS project (Pic. 10).
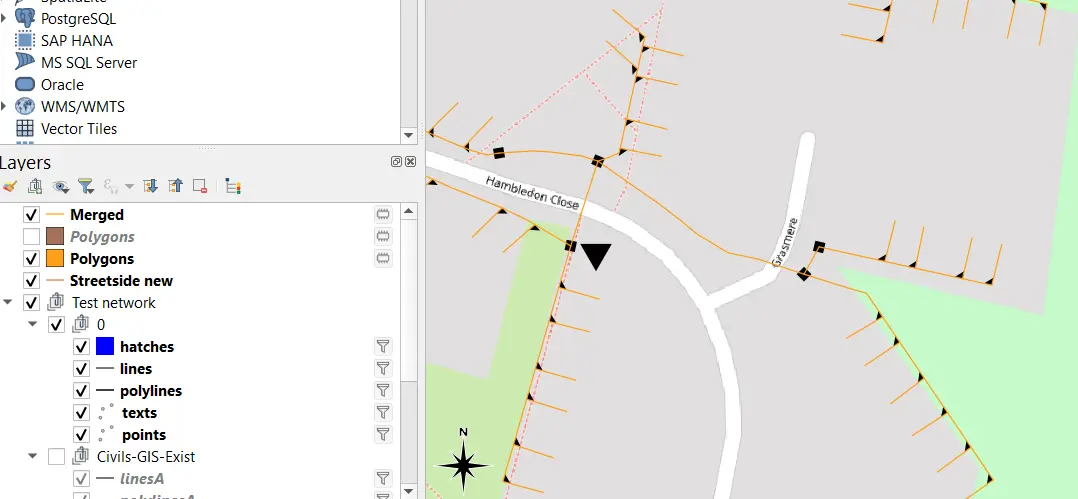
Pic. 10 The final, merged linear layer in QGIS.
This layer must be exported (saved) under the desired GIS format. It’s also a good moment for CRS reprojection. The .dxf layer comes in the CRS system used in our AutoCAD drawing, which is often different than WGS 84. ArcGIS Online, likewise the KML language accepts only the EPSG 4376 WGS 84 system. Otherwise, our data will be shifted or not displayed correctly. This is also the occasion for removing unnecessary fields (Pic. 11).
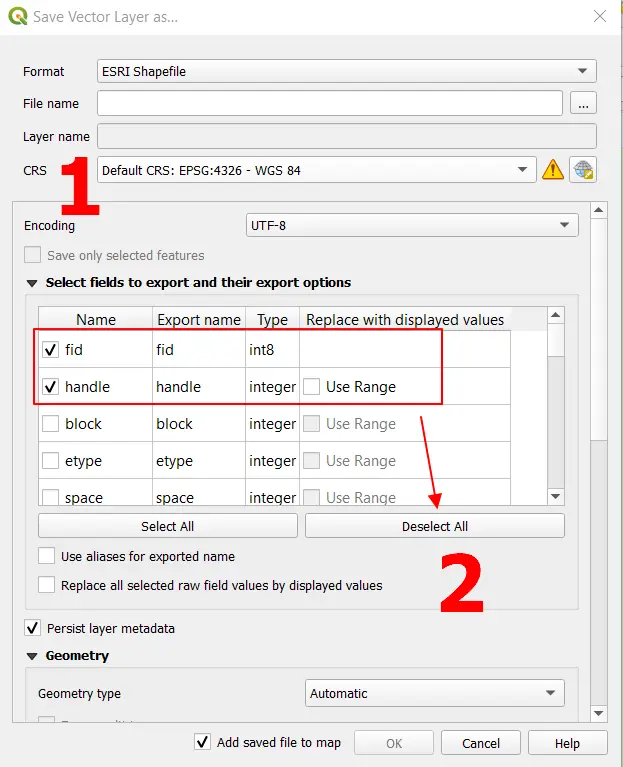
Pic. 11 Reprojecting layer in QGIS.
The saved linear layer is pretty much ready to use in our ArcGIS Online project.
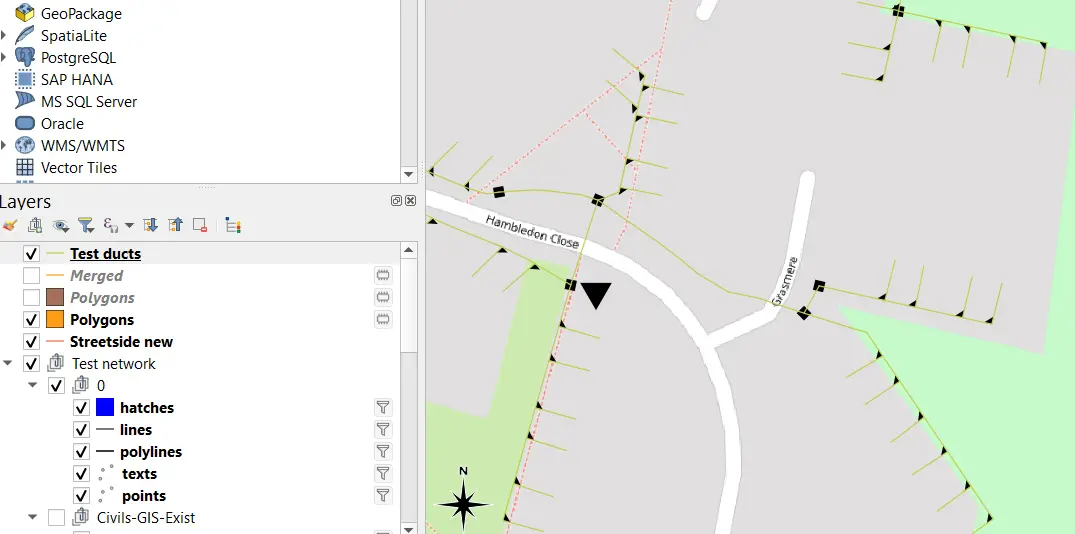
Pic. 12 Linear layer is complete after merging.
In other cases, we won’t always need the entire layer from our DXF import. Sometimes the extraction of some objects is essential. In this case, we must figure out the details in the attribute table.
Let’s consider the same layer group, from which the linear layer was reproduced (Pic. 13).
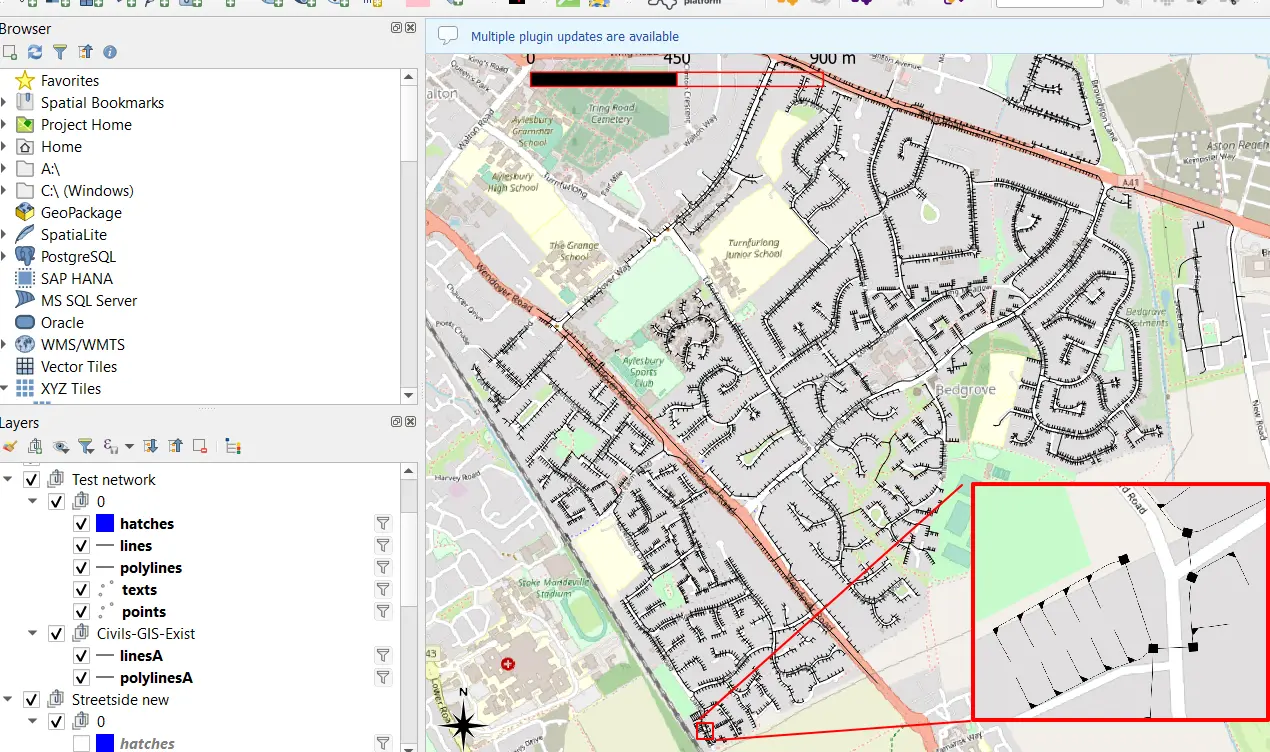
Pic. 13 Other components of the imported AutoCAD layer.
Except for the linear layer, we have other elements, that act like point layers despite their shapes resembling polygons. We would need just one type of presented shape. Therefore the attribute table data would be needed here. The .dxf file doesn’t give many details, although there are still columns, which can be utilized at some point (Pic. 14).
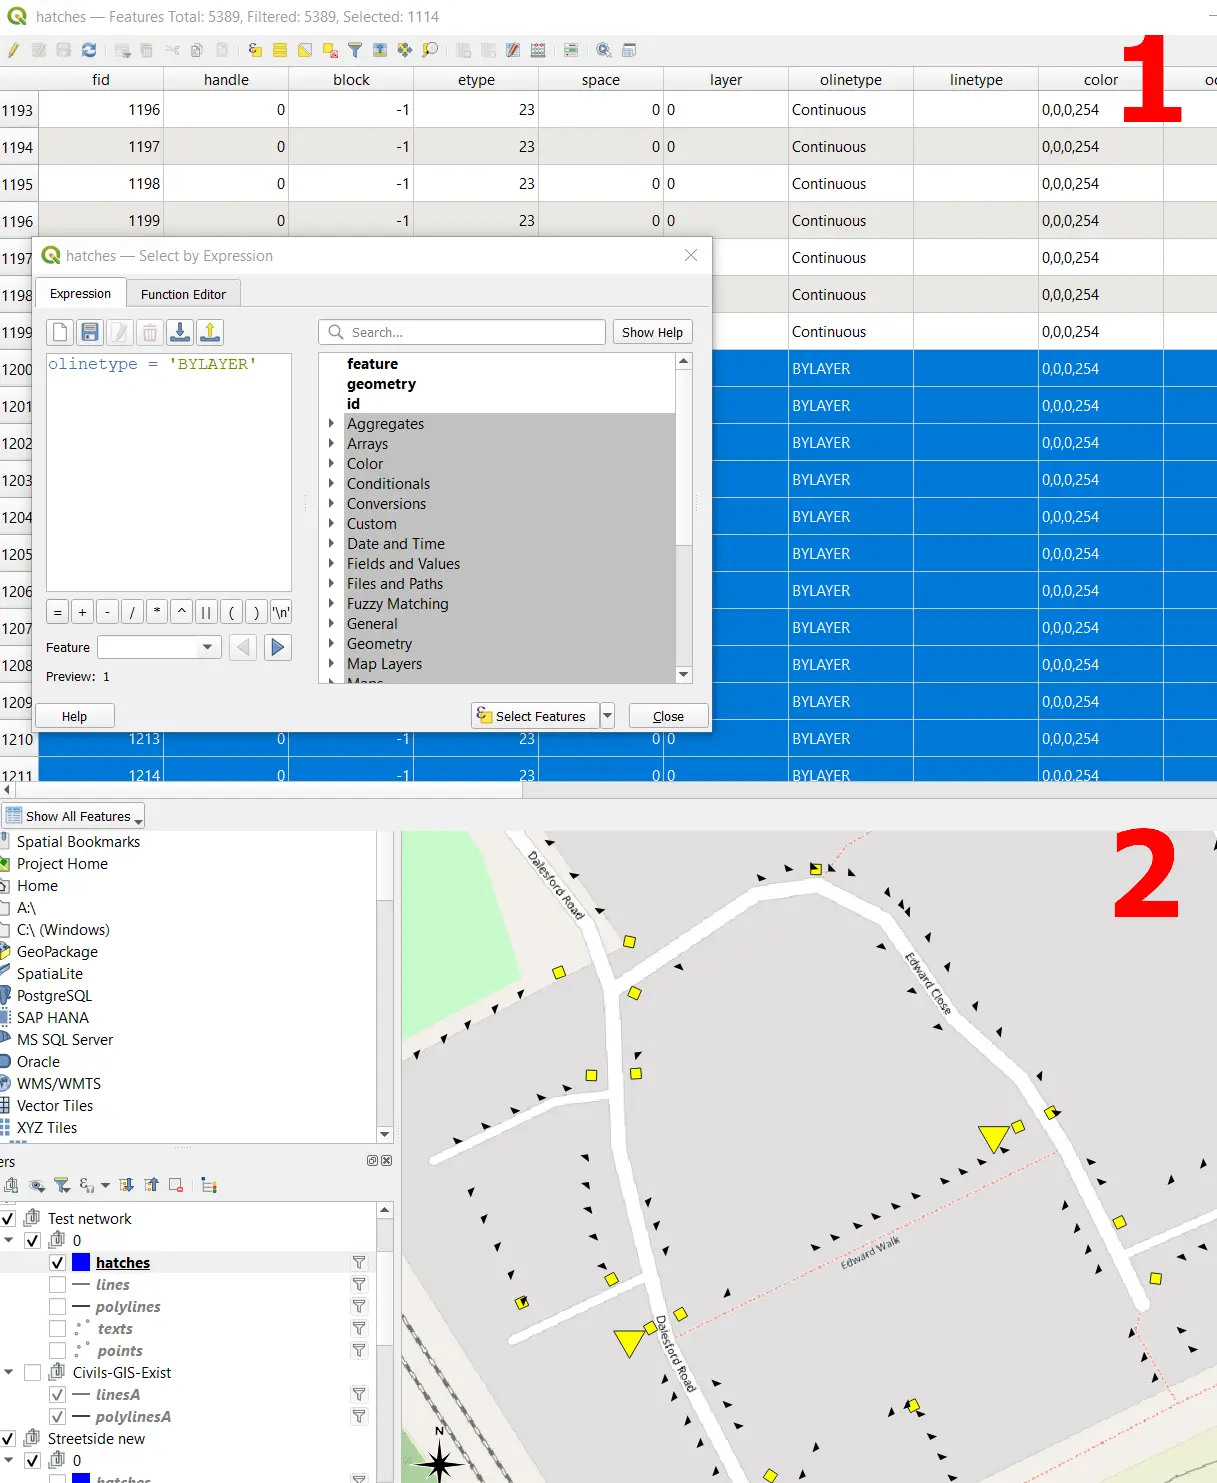
Pic. 14 Distinction of the items from the layer imported along with the .dxf file.
However, sometimes it might be not enough. In this case, instead of relying on columns derived from AutoCAD, we can simply add a new field and define our own value, which will be based on some distinguishable calculations like area or number of nodes (Pic. 15).
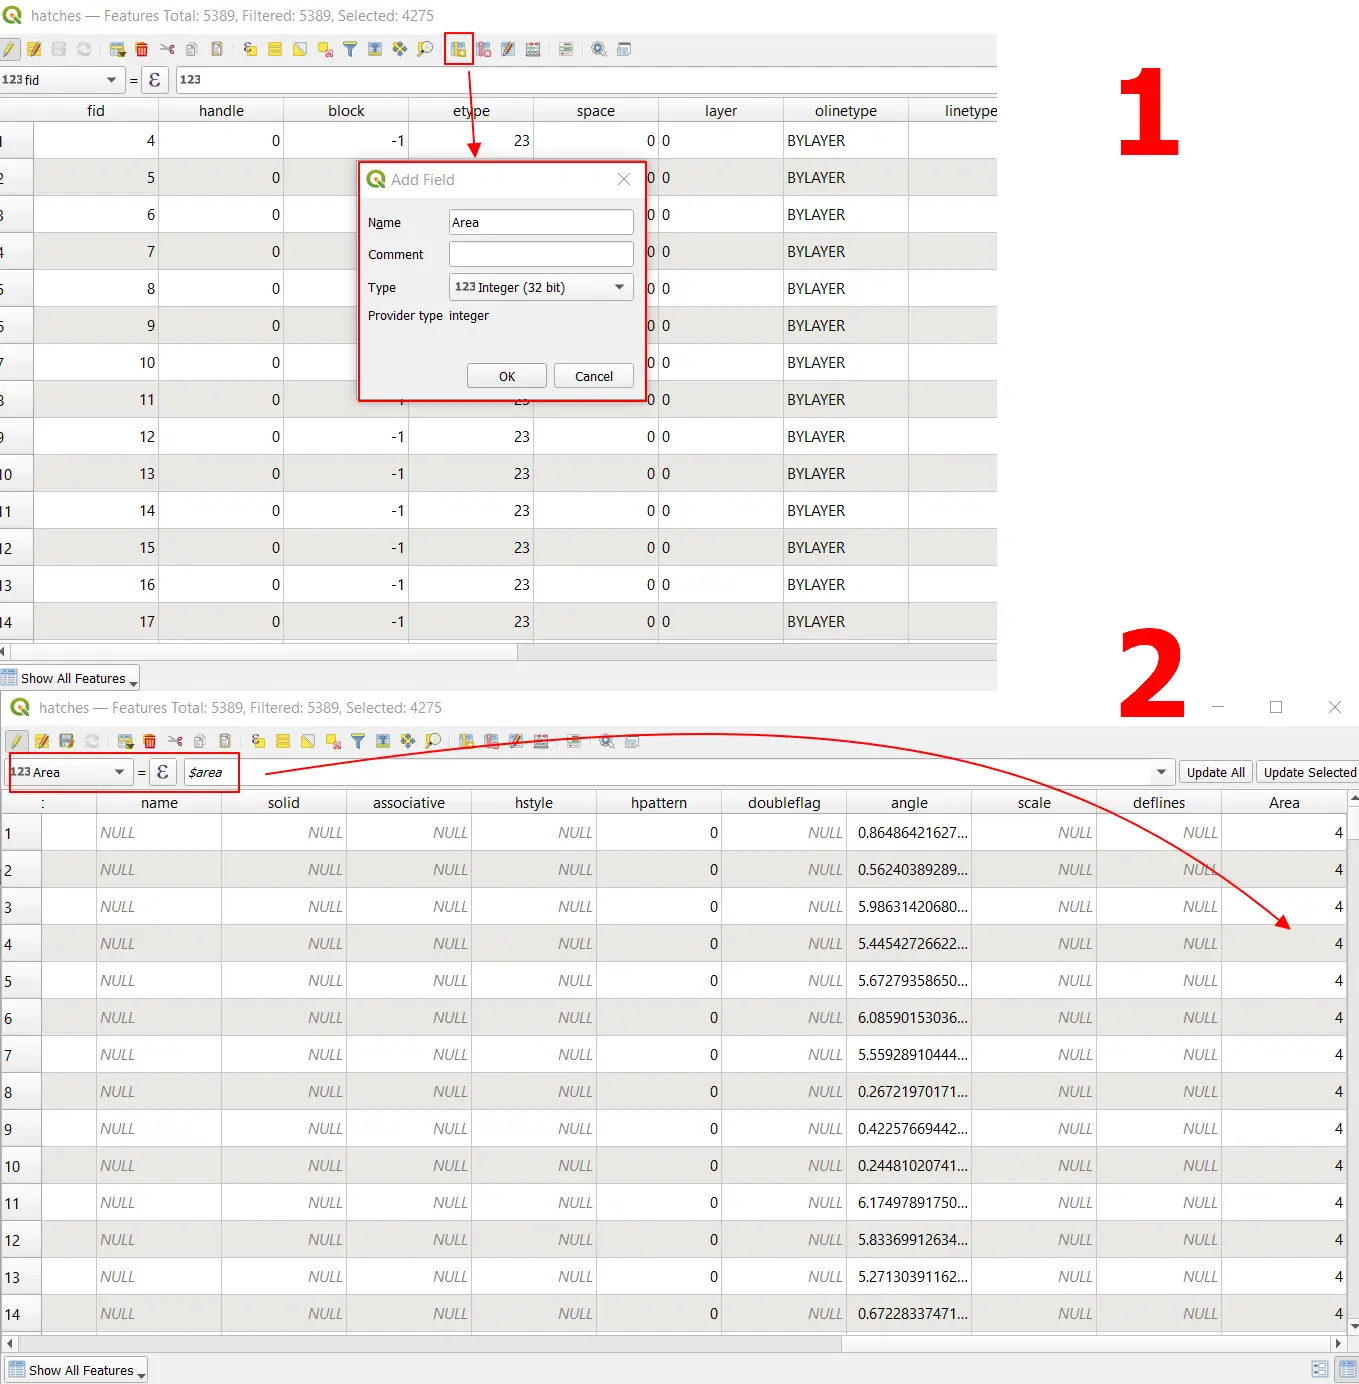
Pic. 15 Creating a new column in the attribute table with rule definition.
Once the column is created (1), the rule (calculation) can be done straight away by using the function panel on the top (2) unless our formula is too complicated.
Next, our selection can be based on this calculation, which should return the desired effect (Pic. 16).
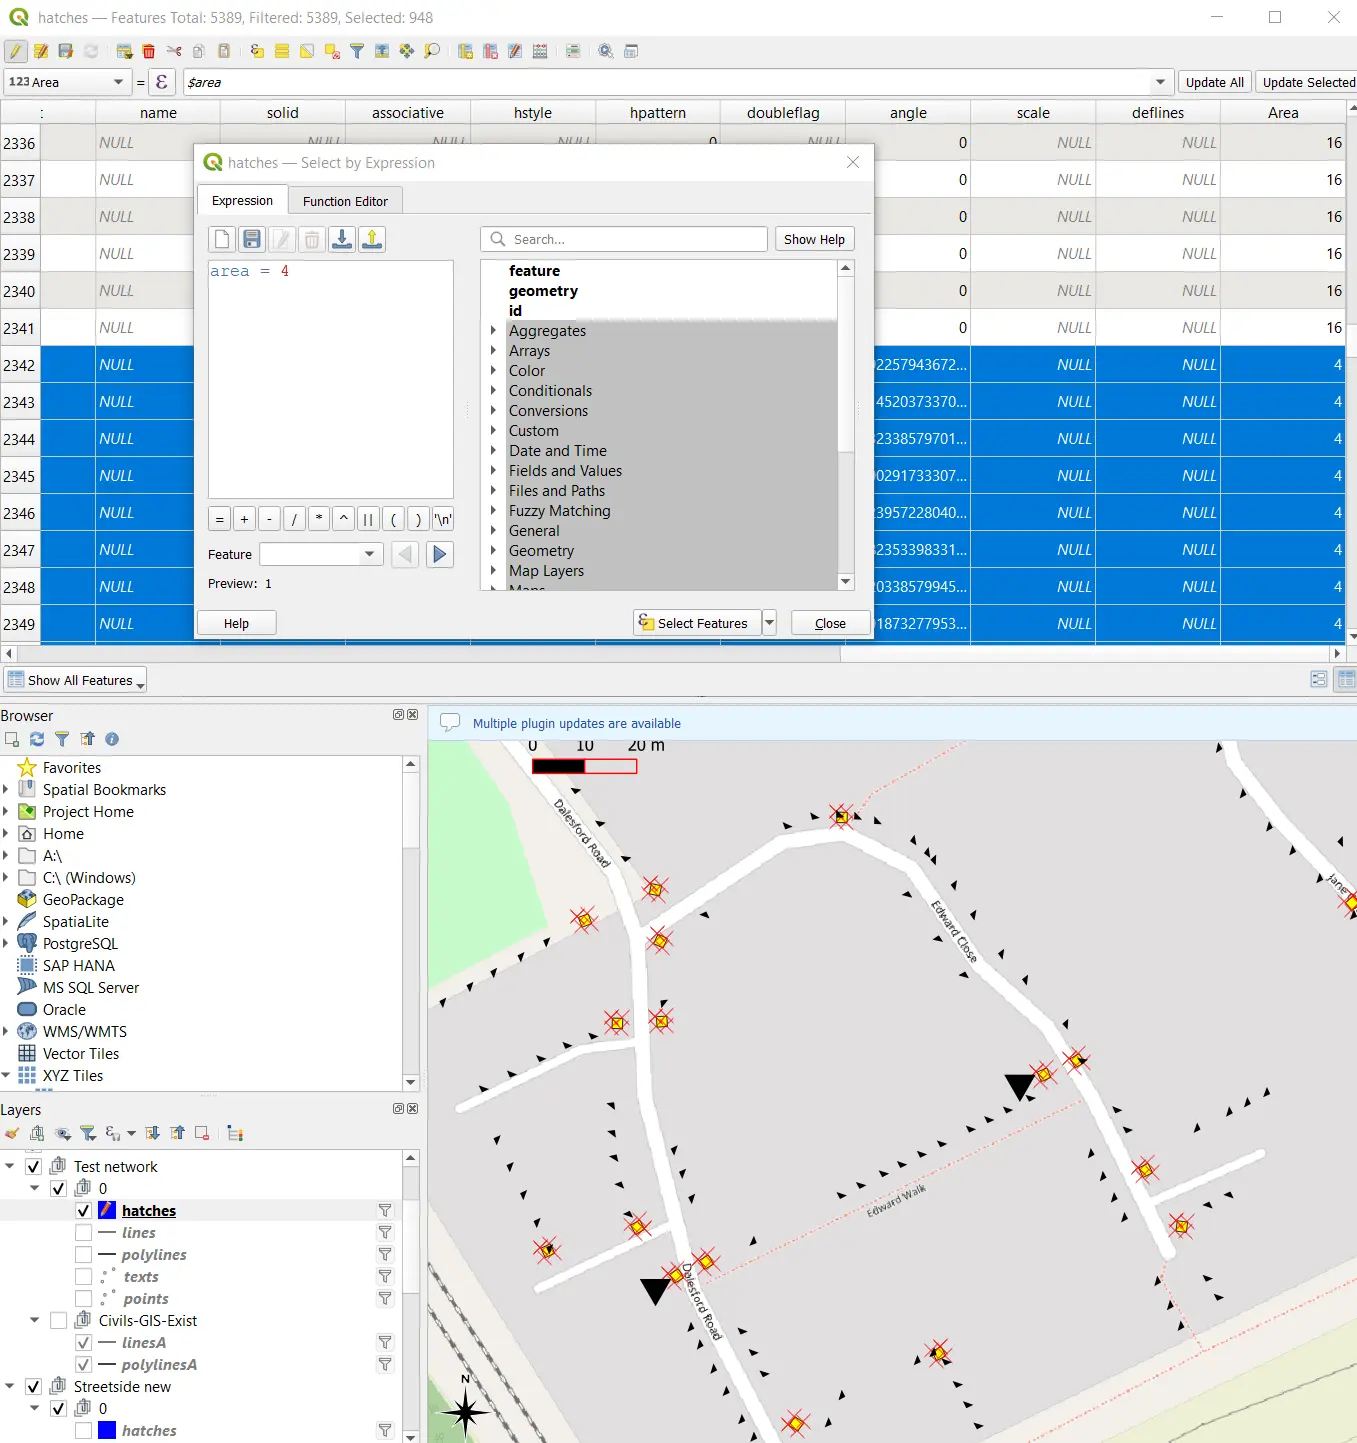
Pic. 16 Selecting values corresponding to the layer elements needed in ArcGIS Online.
Once our items are selected correctly (Pic. 16), we can convert them to the correct geometry, which in this case is the point.
Previously you learned how to polygonize shapes made by linear layers. Now it’s time for the next step, which is conversion from polygons to points.
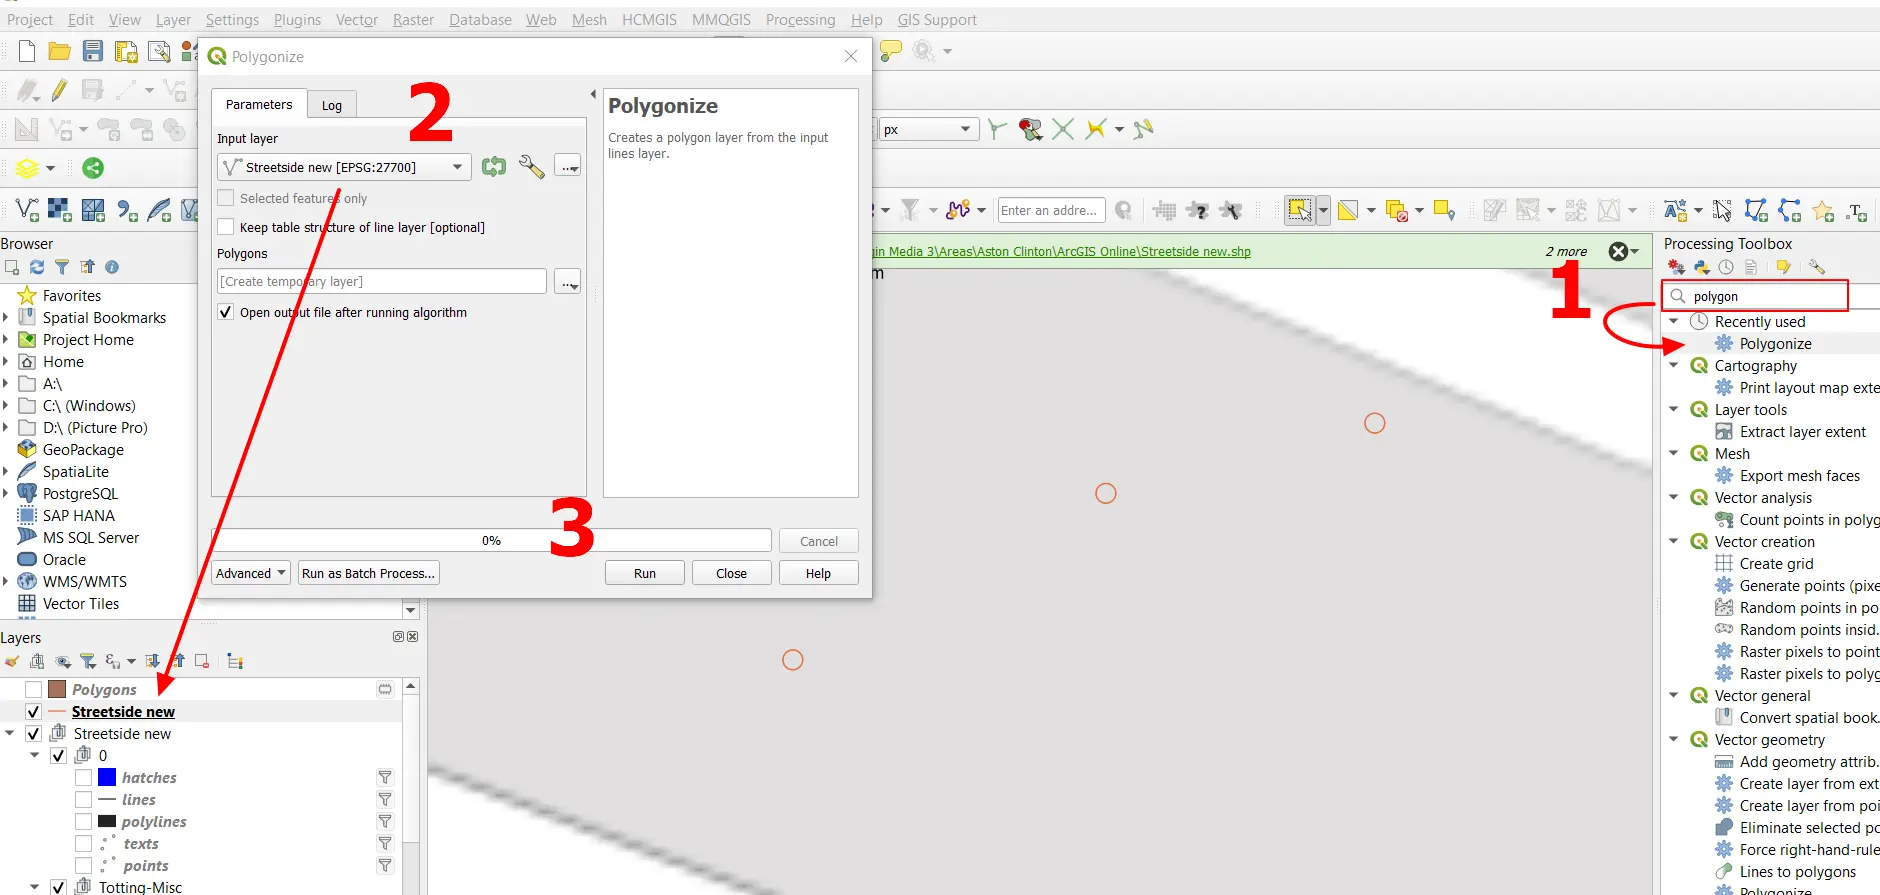
I mentioned earlier, that the best algorithm is the Centroids. We can use it, but only for the selected features, which have been already distinguished by selection (Pic. 17).
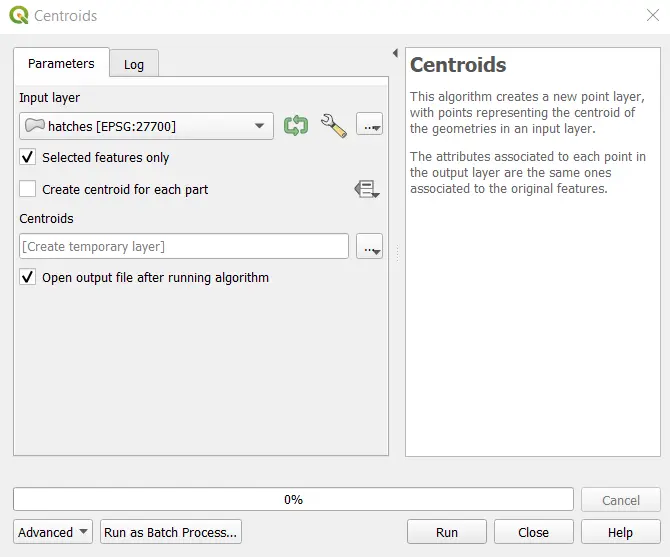
Pic. 17 Extracting points from polygons by using the Centroids tool.
The process shouldn’t take long, and you will be pleased to see the new point layer including only the type elements, which you need (Pic. 18), which marks this layer ready to go to the ArcGIS Online platform.
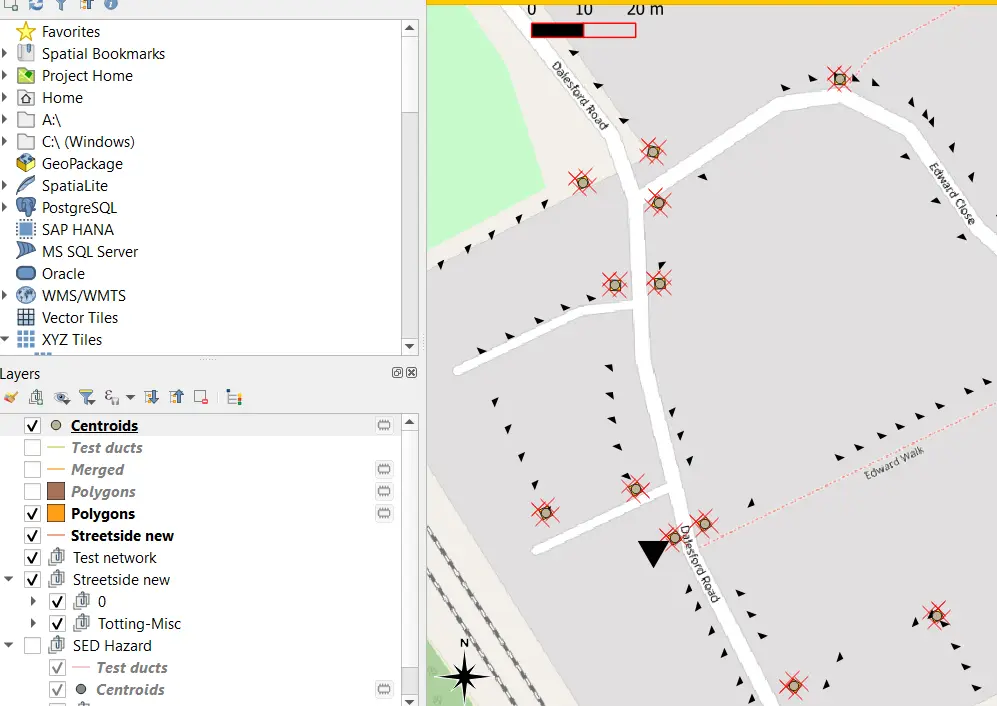
Pic. 18 Point layer received from polygons in QGIS.
In fact, if you haven’t done it earlier in the meantime, you must do it now. It’s the layer reprojection. The easiest way of doing it is by saving our layer to the file. The Save Vector Layer as panel includes the CRS option, where the Default CRS: EPSG:4326 – WGS84 should be selected (Pic. 19).
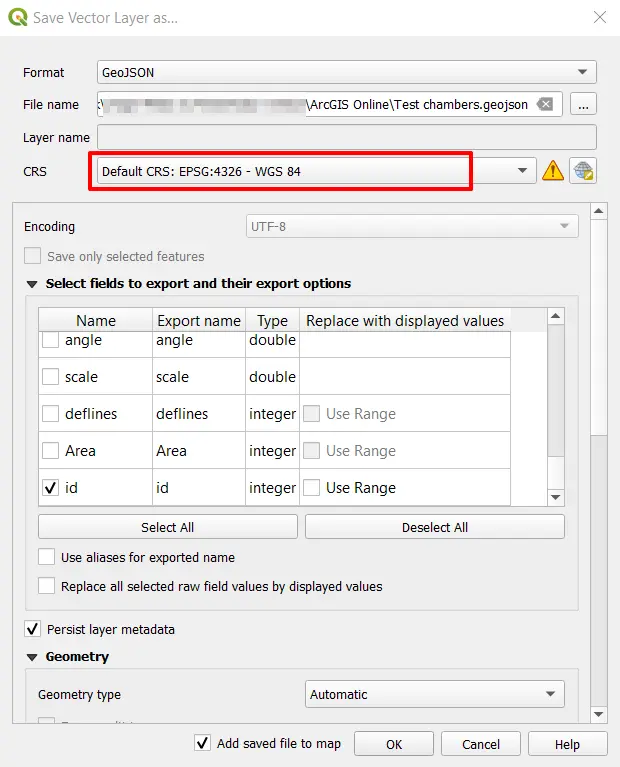
Pic. 19 The last step is a reprojection of our layer if you haven’t done it earlier.
In our ArcGIS Online, we can select our later file source, exactly the same as shown in the previous article. This time, instead of uploading a file just as an item, we can select the other option (Pic. 20).
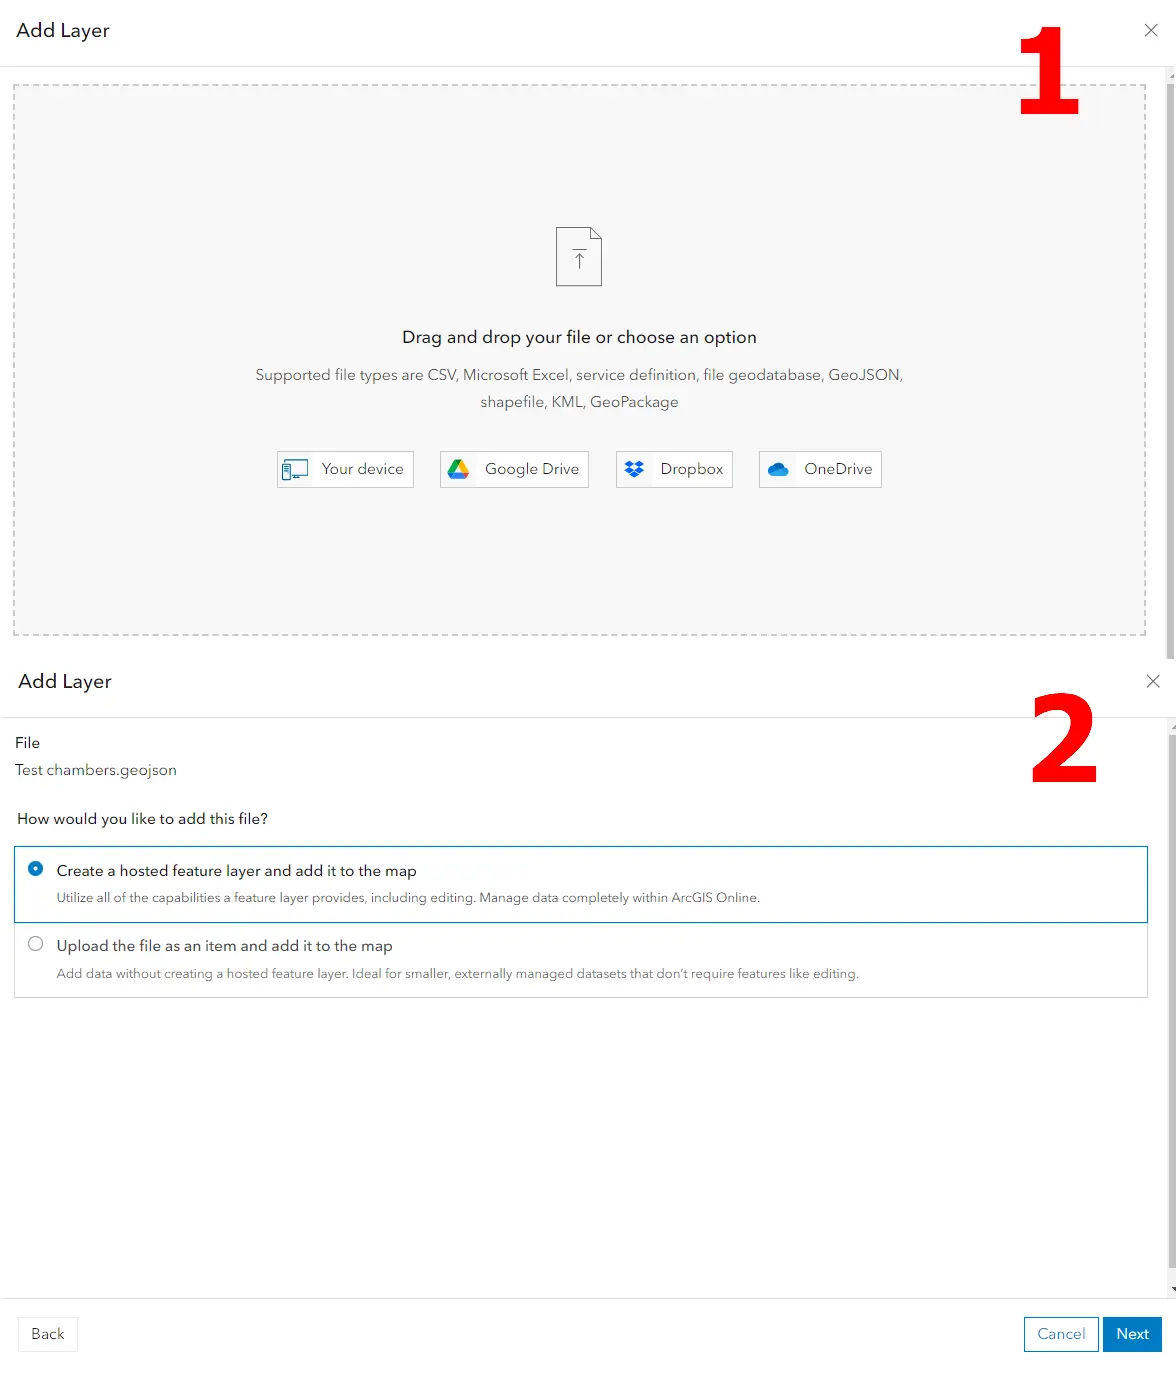
Pic. 20 Adding the .geojson file along with the hosted layer to ArcGIS Online.
Next, you will be asked about the folder selection, as shown in the previous article. This time we can create a new folder and store our layer there (Pic. 21).
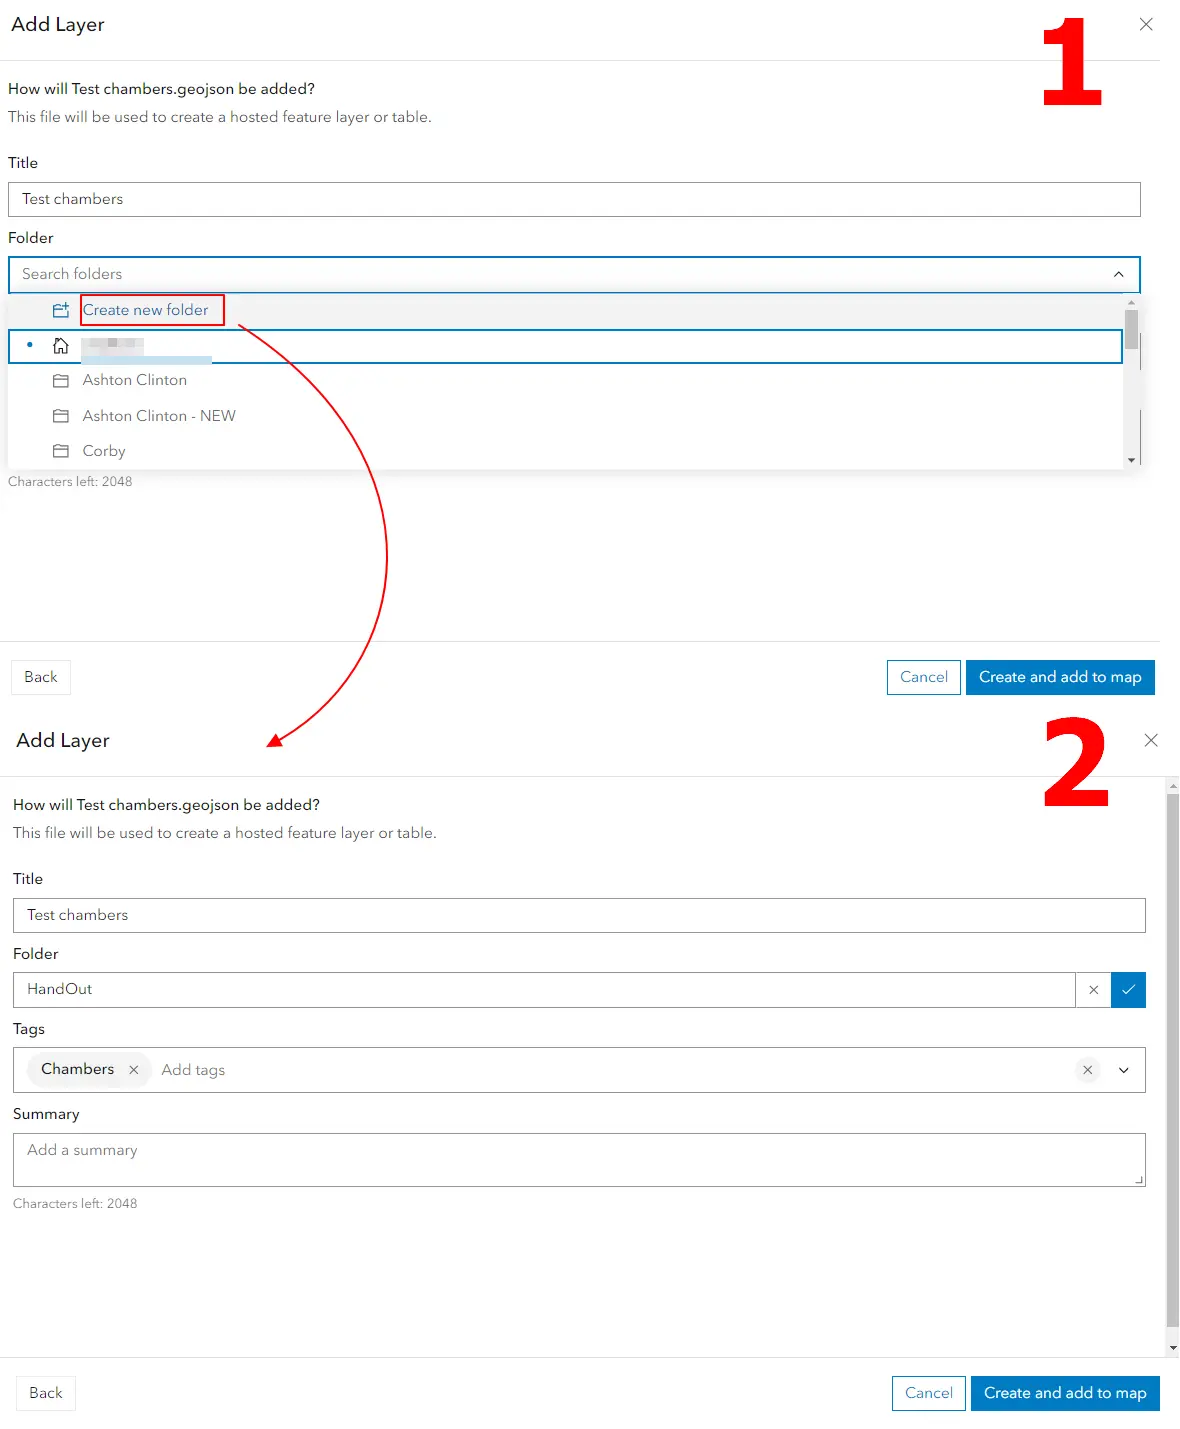
Pic. 21 Creating a new folder and adding a layer to the map.
After uploading, the layer is visible on our map (Pic. 22).
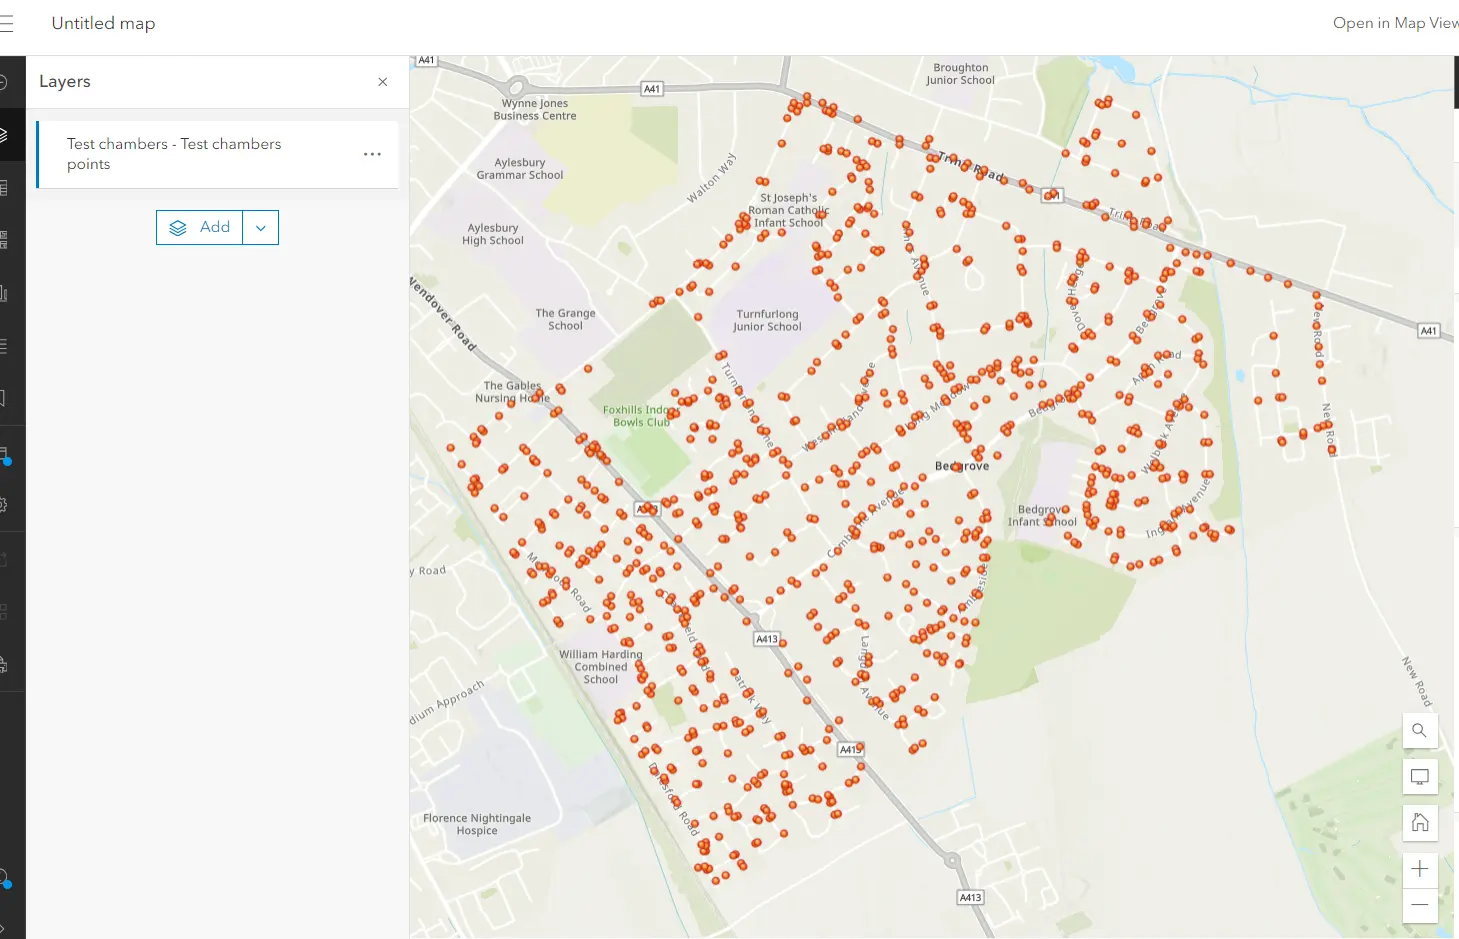
Pic. 22 New point layer added to ArcGIS Online map.
Don’t forget to save your map every time when the new layer is added! You will be informed about it by the blue dot appearing just next to the folder icon (Pic. 23, 24).
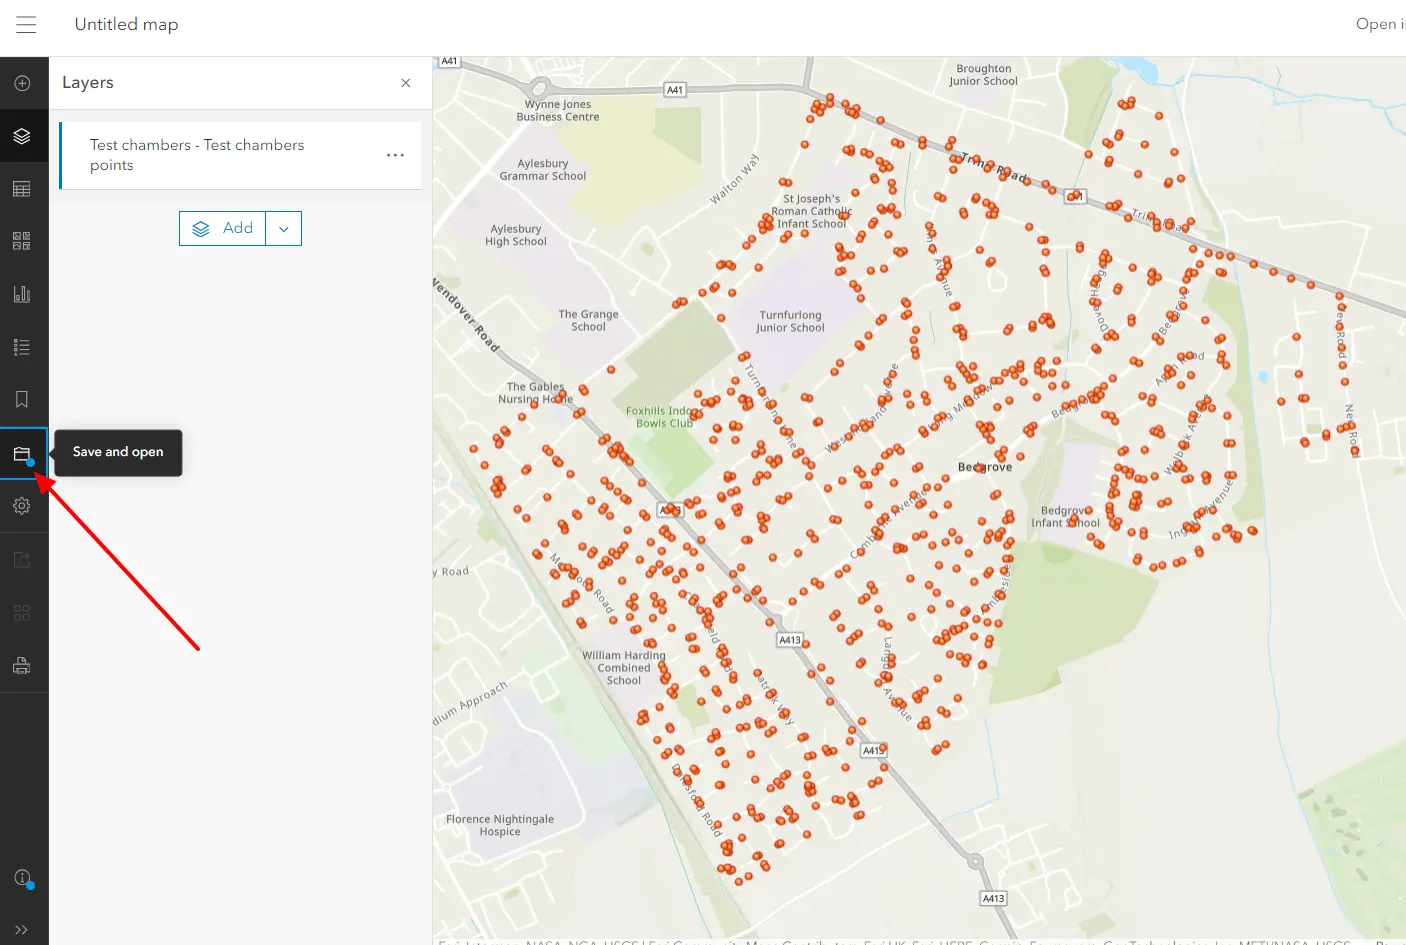
Pic. 23 The Blue dot expresses the necessity of saving the map edits.
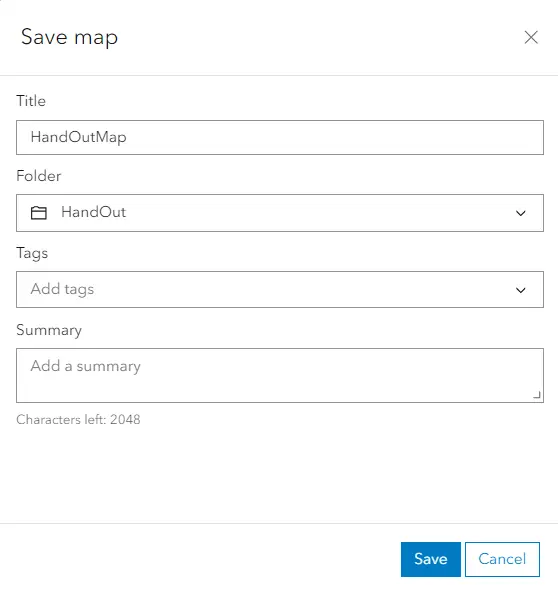
Pic. 24 The Save Map panel in ArcGIS Online.
Lastly, it’s worth looking into the content, where along with the uploaded file, the feature-hosted layer will be created in our content (Pic. 25).
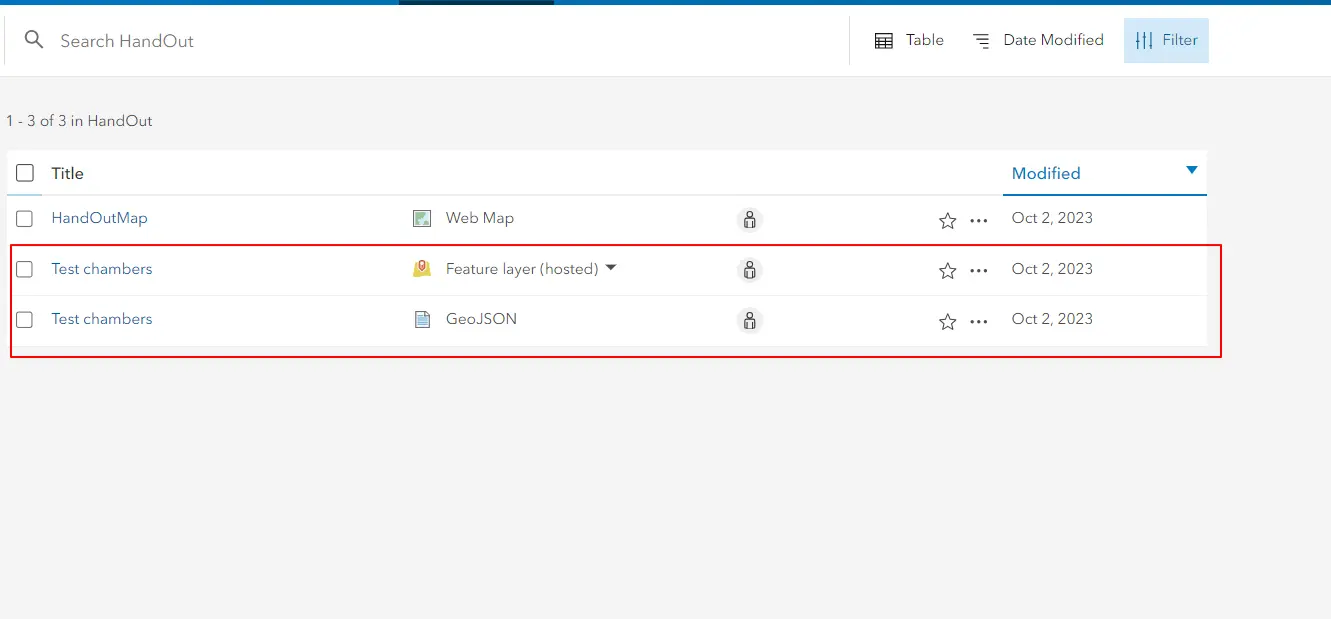
Pic. 25 Our folder content in ArcGIS Online.
The hosted layer created by us is not self-contained. It’s based on the external .geojson file upload from our device. In turn, we might still face some limitations in further usage. The last part of this text, which comes out soon afterward includes the way of creating a self-enclosed hosted feature layer, which can be used in various ArcGIS Online applications.
Mariusz Krukar
Forums:
Wiki:
Videos:
I have been surfing online more than 3 hours today yet I never found any interesting article like yours It is pretty worth enough for me In my opinion if all web owners and bloggers made good content as you did the web will be much more useful than ever before